Hurghada, Red Sea Airbnb Market Data 2026: STR Report & Statistics
How much can you earn on Airbnb in Hurghada, Red Sea? Based on AirROI's 2026 dataset (January 2025 – December 2025), the short answer is $4,103 per year — at a $51 nightly rate, 35.2% occupancy, and a N/A RevPAR.
Hurghada's 658 active listings and moderate demand with room for well-positioned listings to outperform position it as a midsize vacation rental market. Supply expanded 203.2% as revenue climbed even while nightly rates softened — occupancy gains are outrunning rate pressure. For hosts entering now, strengthening demand means there is still room to build a profitable listing.
Regulation is low with minimal registration requirements, pointing to an operator-friendly environment. The data suggests a market where disciplined pricing and strong guest reviews separate top performers from average listings.

Table of Contents [hide] [show]
What Are the Key Airbnb Metrics in Hurghada?
In Hurghada, the headline Airbnb metrics are $4,103 in average annual revenue,35.2% occupancy, $51 ADR, and $0 in RevPAR, and guests book about 28 days in advance.
How Much Do Airbnb Hosts Earn Monthly in Hurghada?
Understanding the monthly revenue variations for Airbnb listings in Hurghada is key to maximizing your short term rental income potential. Seasonality significantly impacts earnings. Our analysis, based on data from the past 12 months, shows that the peak revenue month for STRs in Hurghada is typically October, while March often presents the lowest earnings, highlighting opportunities for strategic pricing adjustments during shoulder and low seasons. Explore the typical Airbnb income in Hurghada across different performance tiers:
- Best-in-class properties (Top 10%) achieve $1,396+ monthly, often utilizing dynamic pricing and superior guest experiences.
- Strong performing properties (Top 25%) earn $759 or more, indicating effective management and desirable locations/amenities.
- Typical properties (Median) generate around $419 per month, representing the average market performance.
- Entry-level properties (Bottom 25%) see earnings around $181, often with potential for optimization.
Average Monthly Airbnb Earnings Trend in Hurghada
What Is the Monthly Airbnb Occupancy Rate in Hurghada?
Maximize your bookings by understanding the Hurghada STR occupancy trends. Seasonal demand shifts significantly influence how often properties are booked. Typically, Augustsees the highest demand (peak season occupancy), while May experiences the lowest (low season). Effective strategies, like adjusting minimum stays or offering promotions, can boost occupancy during slower periods. Here's how different property tiers perform in Hurghada:
- Best-in-class properties (Top 10%) achieve 81%+ occupancy, indicating high desirability and potentially optimized availability.
- Strong performing properties (Top 25%) maintain 63% or higher occupancy, suggesting good market fit and guest satisfaction.
- Typical properties (Median) have an occupancy rate around 36%.
- Entry-level properties (Bottom 25%) average 16% occupancy, potentially facing higher vacancy.
Average Monthly Occupancy Rate Trend in Hurghada
What Is the Average Airbnb Nightly Rate in Hurghada?
Effective short term rental pricing strategy in Hurghada involves understanding monthly ADR fluctuations. The Average Daily Rate (ADR) for Airbnb in Hurghada typically peaks in December and dips lowest during February. Leveraging Airbnb dynamic pricing tools or strategies based on this seasonality can significantly boost revenue. Here's a look at the typical nightly rates achieved:
- Best-in-class properties (Top 10%) command rates of $104+ per night, often due to premium features or locations.
- Strong performing properties (Top 25%) achieve nightly rates of $54 or more.
- Typical properties (Median) charge around $34 per night.
- Entry-level properties (Bottom 25%) earn around $25 per night.
Average Daily Rate (ADR) Trend by Month in Hurghada
What Is the RevPAR for Airbnb in Hurghada?
RevPAR in Hurghada is currently N/A. Because RevPAR combines nightly rates with realized occupancy, it is one of the cleanest ways to compare how efficiently listings turn demand into revenue across the market.
- Entry-level properties (Bottom 25%) see N/A RevPAR.
- Typical properties (Median) generate N/A RevPAR.
- Strong performers (Top 25%) earn N/A RevPAR.
- Best-in-class (Top 10%) achieve N/A RevPAR.
Average Monthly RevPAR Trend in Hurghada
RevPAR Insights for Hurghada
- RevPAR peaks in Jan and bottoms out in Jan, mirroring the broader seasonal demand pattern and suggesting opportunities for dynamic pricing.
Recommendations for Hosts
- Track your own RevPAR monthly against these Hurghada benchmarks. If your RevPAR falls below the median of N/A, examine whether low occupancy or low ADR is the primary drag.
- Use RevPAR rather than revenue alone when comparing properties of different sizes — it normalizes for available nights and gives a more accurate picture of performance.
Get Live Hurghada Market Intelligence 👇
Explore Real-time Analytics
When Is the Peak Season for Airbnb in Hurghada?
Hurghada's peak Airbnb season falls in October, December, November, while the softest stretch is January, February, March. Overall, the market shows moderate seasonality with distinct peak and low periods, which should guide pricing, minimum stays, and cash-flow planning.
Peak Season (October, December, November)
- Revenue averages $848 per month
- Occupancy rates average 42.0%
- Daily rates average $62
Shoulder Season
- Revenue averages $664 per month
- Occupancy maintains around 40.0%
- Daily rates hold near $53
Low Season (January, February, March)
- Revenue drops to average $502 per month
- Occupancy decreases to average 39.5%
- Daily rates adjust to average $50
Seasonality Insights for Hurghada
- The Airbnb seasonality pattern in Hurghada shows moderate seasonality with distinct peak and low periods. While the sections above show seasonal averages, it is also insightful to look at the extremes:
- During the high season, the absolute peak month showcases Hurghada's highest earning potential, with monthly revenues climbing to $941, occupancy reaching 43.7%, and ADRs peaking at $63.
- Conversely, the slowest single month marks the market's lowest point — revenue may dip to $490, occupancy could drop to 37.5%, and ADRs may adjust to $50.
- Lower occupancy paired with meaningful seasonality means hosts in Hurghada need to maximize every peak-season booking and seriously consider whether off-season pricing adjustments or minimum-stay changes can capture incremental revenue.
Seasonal Strategies for Maximizing Profit
- Peak Season: Maximize revenue through premium pricing and potentially longer minimum stays. Ensure high availability and consider tightening cancellation policies to reduce last-minute gaps.
- Low Season: Offer competitive pricing, extended-stay discounts, and flexible cancellation policies. Target off-season travelers like remote workers, budget-conscious guests, and travelers with flexible schedules.
- Shoulder Seasons: Implement dynamic pricing that bridges peak and low rates. Target weekend travelers, local events, and business visitors. Slightly more flexible terms than peak season can help maintain occupancy without deep discounting.
- Regularly analyze your own performance against these Hurghada seasonality benchmarks and adjust your pricing and availability strategy accordingly.
Do You Need a License for Airbnb in Hurghada?
Hurghada, Red Sea, Egypt currently shows a low regulation profile despite having 658 active listings. Larger markets with light regulation can attract new supply quickly, but that also means regulatory frameworks may evolve as local governments respond to growth — staying informed protects your investment. Always verify the latest short-term rental regulations and Airbnb license requirements directly with local government authorities for Hurghada to ensure full compliance before hosting.
(Source: AirROI data, 2026, based on 0% licensed listings)
What Are the Best Neighborhoods for Airbnb in Hurghada?
Location within Hurghada matters. Even in a midsize market, the difference between neighborhoods can mean a material gap in occupancy, nightly rate, and overall Airbnb revenue. Below are 8 areas where short-term rental activity and guest interest are concentrated — along with the reasons each neighborhood appeals to travelers.
| Neighborhood / Area | Why Host Here? (Target Guests & Appeal) | Key Attractions & Landmarks |
|---|---|---|
| El Dahar | The traditional heart of Hurghada, El Dahar offers a blend of authentic Egyptian culture and modern amenities. It's popular for budget travelers and those looking for local experiences. | Hurghada Grand Aquarium, El Dahar Market, New Marina, Coptic Church, Old Town |
| Sakkala | Sakkala is the tourist district that offers a wide range of shops, restaurants, and nightlife, making it an attractive option for visitors. It's also close to the beach and many amenities. | Dolphin World, Hurghada Marina, Hurghada Museum, Local bazaars, Nightclubs and bars |
| Arabia | Known for its more relaxed vibe and family-friendly atmosphere, Arabia Beach attracts families and those looking for leisure and relaxation on the beautiful beaches. | Arabia Beach, Water sports activities, Beach clubs and cafes, Close to resorts |
| Makadi Bay | A resort area located a bit further south of Hurghada, Makadi Bay is known for its luxurious hotels and diving spots, attracting a wealthier clientele. | Makadi Water World, Diving sites, Luxury resorts, Beaches, Golf courses |
| New Hurghada | A rapidly developing area that includes modern accommodations and infrastructure. It's perfect for travelers seeking a contemporary living space with proximity to the old town. | Modern resorts, Shopping centers, Accessibility to attractions, Local eateries |
| Sharm El Naga | Located south of Hurghada, this area is popular for its snorkeling and diving spots, attracting underwater enthusiasts and nature lovers. | Coral reefs, Diving schools, Beach relaxation, Water sports |
| El Gouna | A well-planned resort town just north of Hurghada, El Gouna is known for its beautiful lagoons and luxury resorts. It's a prominent spot for tourists looking for high-end experiences. | El Gouna Marina, Kitesurfing and windsurfing, Golf courses, Art galleries, Restaurants |
| Safaga | A smaller town known for its untouched beaches and less commercialized atmosphere, perfect for eco-tourists and travelers looking for tranquil experiences. | Safaga Beach, Diving spots, Desert excursions, Relaxing atmosphere |
With 8 distinct neighborhoods showing meaningful short-term rental activity, Hurghada offers diversification within a single market. Investors can tailor their strategy — from high-turnover tourist zones to quieter residential areas that attract longer stays and remote workers.
What Types of Properties Are on Airbnb in Hurghada?
Room Type Distribution
Property Type Distribution
Market Composition Insights for Hurghada
- The Hurghada Airbnb market composition is heavily skewed towards Entire Home/Apt listings, which make up 94.4% of the 658 active rentals. This indicates strong guest preference for privacy and space.
- Looking at the property type distribution in Hurghada, Apartment/Condo properties are the most common (87.4%), reflecting the local real estate landscape.
- Smaller segments like hotel/boutique, others, unique stays (combined 3.5%) offer potential for unique stay experiences.
Hurghada Airbnb Room Capacity Analysis (2026): Bedroom Distribution
Distribution of Listings by Number of Bedrooms
Room Capacity Insights for Hurghada
- The dominant room capacity in Hurghada is 1 bedroom listings, making up 53.3% of the market. This suggests a strong demand for properties suitable for couples or solo travelers.
- Together, 1 bedroom and 2 bedrooms properties represent 81.6% of the active Airbnb listings in Hurghada, indicating a high concentration in these sizes.
- With over half the market (53.3%) consisting of studios or 1-bedroom units, Hurghada is particularly well-suited for individuals or couples.
Hurghada Vacation Rental Guest Capacity Trends (2026)
Distribution of Listings by Guest Capacity
Guest Capacity Insights for Hurghada
- The most common guest capacity trend in Hurghada vacation rentals is listings accommodating 2 guests (28%). This suggests the primary traveler segment is likely couples or solo travelers.
- Properties designed for 2 guests and 3 guests dominate the Hurghada STR market, accounting for 53.5% of listings.
- 12.8% of properties accommodate 6+ guests, serving the market segment for larger families or group travel in Hurghada.
- On average, properties in Hurghada are equipped to host 3.5 guests.
What Amenities Do Airbnb Guests Expect in Hurghada?
Amenity Prevalence
Amenity Insights for Hurghada
- Essential amenities in Hurghada that guests expect include: TV, Air conditioning, Kitchen. Lacking these (any) could significantly impact bookings.
- Popular amenities like Washer, Free parking on premises, Wifi are common but not universal. Offering these can provide a competitive edge.
- A pool is a highly desired but not standard amenity, making it a key feature for attracting guests seeking leisure in Hurghada.
- Warning: Wifi is not universally provided but is considered essential globally. Ensure reliable Wifi is offered.
Recommendations for Hosts
- Ensure your listing includes all essential amenities for Hurghada: TV, Air conditioning, Kitchen.
- Prioritize adding missing essentials: TV, Air conditioning, Kitchen.
- Consider adding popular differentiators like Washer or Free parking on premises to increase appeal.
- Highlight unique or less common amenities you offer (e.g., hot tub, dedicated workspace, EV charger) in your listing description and photos.
- Regularly check competitor amenities in Hurghada to stay competitive.
Dive Deeper: Advanced Hurghada STR Market Data (2026)
Ready to unlock more insights? AirROI provides access to advanced metrics and comprehensive Airbnb data for Hurghada. Explore detailed analytics beyond this report to refine your investment strategy, optimize pricing, and maximize your vacation rental profits.
Explore Advanced MetricsHurghada Airbnb Guest Demographics & Profile Analysis (2026)
Guest Profile Summary for Hurghada
- The typical guest profile for Airbnb in Hurghada consists of predominantly international visitors (92%), with top international origins including Germany, typically belonging to the Post-2000s (Gen Z/Alpha) group (50%), primarily speaking English or French.
- Domestic travelers account for 8.2% of guests.
- Key international markets include France (21.4%) and Germany (14.3%).
- Top languages spoken are English (38.7%) followed by French (13.9%).
- A significant demographic segment is the Post-2000s (Gen Z/Alpha) group, representing 50% of guests.
Recommendations for Hosts
- Focus marketing internationally, particularly towards travelers from Germany.
- Tailor amenities and listing descriptions to appeal to the dominant Post-2000s (Gen Z/Alpha) demographic (e.g., highlight fast WiFi, smart home features, local guides).
- Highlight unique local experiences or amenities relevant to the primary guest profile.
- Consider seasonal promotions aligned with peak travel times for key origin markets.
Hurghada Airbnb Booking Patterns (2026): Available vs. Booked Days
Available Days Distribution
Booked Days Distribution
Booking Pattern Insights for Hurghada
- The most common availability pattern in Hurghada falls within the 271-366 days range, representing 66.3% of listings. This suggests many properties have significant open periods on their calendars.
- Approximately 86.5% of listings show high availability (181+ days open annually), indicating potential for increased bookings or specific owner usage patterns.
- For booked days, the 31-90 days range is most frequent in Hurghada (34.2%), reflecting common guest stay durations or potential owner blocking patterns.
- A notable 14.3% of properties secure long booking periods (181+ days booked per year), highlighting successful long-term rental strategies or significant owner usage.
How Far in Advance Do Guests Book Airbnb in Hurghada?
Average Booking Lead Time by Month
Booking Lead Time Insights for Hurghada
- The overall average booking lead time for vacation rentals in Hurghada is 28 days.
- Guests book furthest in advance for stays during November (average 40 days), likely coinciding with peak travel demand or local events.
- The shortest booking windows occur for stays in June (average 22 days), indicating more last-minute travel plans during this time.
- Seasonally, Fall (37 days avg.) sees the longest lead times, while Winter (27 days avg.) has the shortest, reflecting typical travel planning cycles.
Recommendations for Hosts
- Use the overall average lead time (28 days) as a baseline for your pricing and availability strategy in Hurghada.
- For November stays, consider implementing length-of-stay discounts or slightly higher rates for bookings made less than 40 days out to capitalize on advance planning.
- Target marketing efforts for the Fall season well in advance (at least 37 days) to capture early planners.
- Monitor your own booking lead times against these Hurghada averages to identify opportunities for dynamic pricing adjustments.
Hurghada Airbnb Minimum Stay Requirements Analysis
Distribution of Listings by Minimum Night Requirement
1 Night
203 listings
30.9% of total
2 Nights
101 listings
15.3% of total
3 Nights
127 listings
19.3% of total
4-6 Nights
54 listings
8.2% of total
7-29 Nights
36 listings
5.5% of total
30+ Nights
137 listings
20.8% of total
Key Insights
- The most prevalent minimum stay requirement in Hurghada is 1 Night, adopted by 30.9% of listings. This highlights the market's preference for shorter, flexible bookings.
- A significant segment (20.8%) caters to monthly stays (30+ nights) in Hurghada, pointing to opportunities in the extended-stay market.
Recommendations
- Align with the market by considering a 1 Night minimum stay, as 30.9% of Hurghada hosts use this setting.
- Explore offering discounts for stays of 30+ nights to attract the 20.8% of the market seeking extended stays.
- Adjust minimum nights based on seasonality – potentially shorter during low season and longer during peak demand periods in Hurghada.
Hurghada Airbnb Cancellation Policy Trends Analysis (2026)
Super Strict 30 Days
1 listings
0.2% of total
Limited
2 listings
0.3% of total
Flexible
239 listings
36.7% of total
Moderate
154 listings
23.6% of total
Firm
168 listings
25.8% of total
Strict
88 listings
13.5% of total
Cancellation Policy Insights for Hurghada
- The prevailing Airbnb cancellation policy trend in Hurghada is Flexible, used by 36.7% of listings.
- There's a relatively balanced mix between guest-friendly (60.3%) and stricter (39.3%) policies, offering choices for different guest needs.
Recommendations for Hosts
- Consider adopting a Flexible policy to align with the 36.7% market standard in Hurghada.
- Using a Strict policy might deter some guests, as only 13.5% of listings use it. Evaluate if potential revenue protection outweighs possible lower booking rates.
- Regularly review your cancellation policy against competitors and market demand shifts in Hurghada.
What Do the Top Airbnb Listings in Hurghada Look Like?
Benchmark your potential! Explore examples of top-performing Airbnb properties in Hurghadabased on Trailing Twelve Month (TTM) revenue. Analyze their characteristics, revenue, occupancy rate, and ADR to understand what drives success in this market.

8 BRs Luxury Villa in Hurghada, Sahl Hasheesh
Entire Place • 8 bedrooms
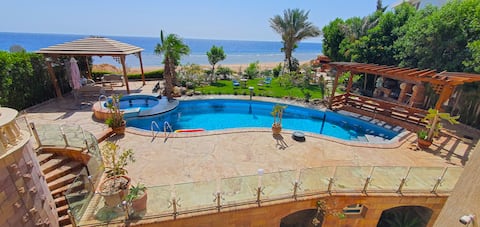
Luxury Seafront Pool Villa - 4 Stories - All M.BDR
Entire Place • 6 bedrooms

Luxurious Villa in Sahl Hasheesh
Entire Place • 8 bedrooms
Greece villa 1
Entire Place • 3 bedrooms
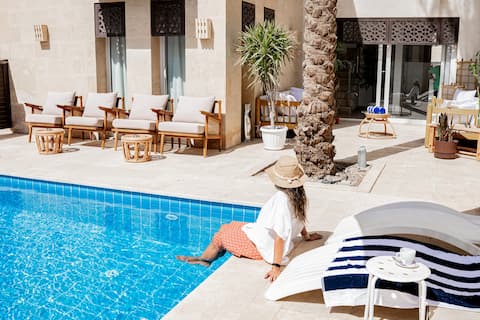
Nayah Boutique Stays exclusive six-Ensuite villa
Entire Place • 6 bedrooms
Greece villa 2
Entire Place • 3 bedrooms
Note: Performance varies based on location, size, amenities, seasonality, and management quality. Data reflects the past 12 months.
Who Are the Top Airbnb Hosts in Hurghada?
Learn from the best! This table showcases top-performing Airbnb hosts in Hurghada based on the number of properties managed and estimated total revenue over the past year. Analyze their scale and performance metrics.
| Host Name | Properties | Grossing Revenue | Stay Reviews | Avg Rating |
|---|---|---|---|---|
| Ahmed | 4 | $111,367 | 40 | 4.98/5.0 |
| Cello | 10 | $91,310 | 455 | 4.87/5.0 |
| Mahmoud | 4 | $89,155 | 104 | 4.93/5.0 |
| Omar | 3 | $88,036 | 97 | 4.77/5.0 |
| Stiletto Hospitality | 4 | $70,531 | 84 | 4.57/5.0 |
| Alisra | 1 | $51,589 | 8 | 4.38/5.0 |
| Mahmoud | 1 | $49,460 | 5 | 5.00/5.0 |
| Antje & Team | 6 | $45,508 | 271 | 4.84/5.0 |
| Nayah Boutique Stays LLC | 1 | $42,179 | 5 | 5.00/5.0 |
| Ольга | 2 | $41,849 | 12 | 4.46/5.0 |
Analyzing the strategies of top hosts, such as their property selection, pricing, and guest communication, can offer valuable lessons for optimizing your own Airbnb operations in Hurghada.
How Does Hurghada's Airbnb Market Compare to Nearby Cities?
How does the Hurghada Airbnb market stack up against its neighbors? Compare key performance metrics like average monthly revenue, ADR, and occupancy rates in surrounding areas to understand the broader regional STR landscape.
Compared with El Gouna, Hurghada has 14 percentage points lower occupancy and about $158 lower ADR. That helps frame whether this market is winning more on demand, pricing, or both.
| Market | Active Properties | Monthly Revenue | Daily Rate | Avg. Occupancy |
|---|---|---|---|---|
| El Gouna | 11 | $2,129 | $209.12 | 49% |
| Gamsha | 1,165 | $1,206 | $144.21 | 35% |
| Ras Abu Soma | 55 | $899 | $160.32 | 30% |
| Hurghada 2 | 90 | $770 | $130.64 | 34% |
| Sharm Ash Sheikh | 267 | $622 | $82.37 | 38% |
| Safaga | 41 | $549 | $77.82 | 34% |
| الغردقة | 22 | $515 | $70.08 | 36% |
| Sharm Al Shiekh | 14 | $506 | $62.03 | 39% |
| Touristic Villages | 14 | $454 | $45.24 | 41% |
| قسم أول الغردقة | 39 | $435 | $73.54 | 38% |
Frequently Asked Questions About Airbnb in Hurghada
These quick answers summarize the most common investor and operator questions using AirROI's latest market data for Hurghada.
How much do Airbnb hosts make in Hurghada?
Hurghada hosts earn about $4,103 per year on average, with an average nightly rate of $51 and RevPAR of N/A. Those figures describe the typical revenue environment for active listings in Hurghada, Red Sea, not the ceiling for the best operators. Source: AirROI 2026 data, Hurghada market, January 2025 to December 2025.
What is the average Airbnb occupancy rate in Hurghada?
The average Airbnb occupancy rate in Hurghada is 35.2%. October is the strongest month and March is the softest, so hosts should expect demand to move meaningfully throughout the year rather than stay flat.
What is the average Airbnb daily rate in Hurghada?
Listings in Hurghada average $51 per night. The broader pricing spread also matters: lower-performing listings cluster closer to the lower quartiles, while premium homes can price materially above the city average when demand spikes or listing quality stands out.
How many Airbnb listings are active in Hurghada?
Hurghada currently has about 658 active Airbnb listings in AirROI's market dataset. That supply count helps explain how competitive the market is, how much depth there is for benchmarking, and whether the market behaves like a niche destination or a scaled urban market.
How strict are short-term rental regulations in Hurghada?
AirROI currently classifies the short-term rental regulation level in Hurghada as Low. The dataset also shows about 0.2% of listings with registration evidence. That is a market signal, not legal advice, so hosts should still confirm current licensing and compliance rules locally before listing.
What is the RevPAR for Airbnb in Hurghada?
RevPAR in Hurghada is about N/A. That metric combines pricing and occupancy into one efficiency number, so it is often a better quick benchmark than ADR alone when investors want to compare how well listings convert nightly rates into realized revenue.
Is Airbnb profitable in Hurghada?
Occupancy of 35.2% means Hurghada is a more selective market. Profitability is achievable but requires careful cost management, premium positioning, or targeting longer stays to reduce turnover. Average annual revenue is $4,103, but individual returns depend on property type, location within the city, and the host's operating efficiency.
How far in advance do guests book Airbnb in Hurghada?
The average booking lead time in Hurghada is about 28 days — a moderate lead time that gives hosts planning visibility while still benefiting from last-minute bookings. Hosts who understand their market's booking cadence can adjust minimum stays and pricing windows accordingly.
What are the best neighborhoods for Airbnb in Hurghada?
Based on AirROI's analysis, some of the top neighborhoods for short-term rentals in Hurghada include El Dahar, Sakkala, Arabia. Each area attracts different guest profiles — from business travelers to leisure visitors — so the best location depends on the property type and target audience a host is aiming for. See the full neighborhood breakdown above.
What type of property performs best on Airbnb in Hurghada?
entire_home listings make up 94.4% of the active supply in Hurghada. The most common configuration does not always mean the most profitable — operators who identify underserved property types or bedroom counts can sometimes outperform the market average by filling a gap in local supply.
How does Hurghada compare to nearby Airbnb markets?
Among neighboring markets, El Gouna posts $25,550 in average annual revenue with 48.8% occupancy, compared to Hurghada's $4,103 and 35.2%. Comparing nearby markets helps investors understand whether a destination's performance reflects local demand or broader regional trends.
When is the peak season for Airbnb in Hurghada?
October is the highest-revenue month in Hurghada, while March is the softest. The revenue spread between them indicates moderate seasonality with a clear peak period, giving hosts opportunities to maximize rates during high demand without facing dramatic off-season drops.
About AirROI Market Data
AirROI tracks over 20 million properties across 190+ countries and maintains 15+ years of historical performance data, making it one of the deepest Airbnb and STR intelligence platforms available. The analytics pipeline aggregates listing-level data monthly — revenue, occupancy, nightly rates, RevPAR, guest demographics, booking patterns, and competitive supply — so investors and operators can benchmark any market against its own history and against neighboring destinations.
Real estate investors, property managers, financial institutions, hedge funds, tourism boards, hospitality consultants, tech platforms, and academic researchers rely on AirROI data to underwrite acquisitions, optimize pricing, model macro trends, and conduct peer-reviewed research. Data is available through in-depth market reports like this one and the Airbnb API with 22 endpoints and an Airbnb MCP Server for AI agents.
AirROI proprietary analytics as of 2025-12-31. Metrics reflect trailing twelve-month aggregates from active listings. Revenue figures are market averages, not projections. Neighborhood descriptions are AI-generated and reviewed for accuracy. For full methodology, see the data methodology page.