Nantes, Pays de la Loire Airbnb Market Data 2026: STR Report & Statistics
How much can you earn on Airbnb in Nantes, Pays de la Loire? Based on AirROI's 2026 dataset (July 2025 – June 2026), the short answer is $10,648 per year — at a $102 nightly rate, 41.1% occupancy, and a $42 RevPAR that reflects moderate rate-to-revenue efficiency with room to optimize.
Nantes's 2,161 active listings and moderate demand with room for well-positioned listings to outperform make it a major short-term rental market. Supply has held steady while nightly rates moved higher — a market where hosts who optimize for bookability can unlock the full value of rising rates. Balancing rate strategy with occupancy is the key lever, and hosts who get it right will outperform.
Regulation is high and 79% of listings show active registration — compliance is the cost of entry. For data-driven hosts, the opportunity lies in reading these signals and positioning accordingly.

Table of Contents [hide] [show]
What Are the Key Airbnb Metrics in Nantes?
In Nantes, the headline Airbnb metrics are $10,648 in average annual revenue,41.1% occupancy, $102 ADR, and $42 in RevPAR, and guests book about 40 days in advance.
How Much Do Airbnb Hosts Earn Monthly in Nantes?
Understanding the monthly revenue variations for Airbnb listings in Nantes is key to maximizing your short term rental income potential. Seasonality significantly impacts earnings. Our analysis, based on data from the past 12 months, shows that the peak revenue month for STRs in Nantes is typically August, while January often presents the lowest earnings, highlighting opportunities for strategic pricing adjustments during shoulder and low seasons. Explore the typical Airbnb income in Nantes across different performance tiers:
- Best-in-class properties (Top 10%) achieve $2,671+ monthly, often utilizing dynamic pricing and superior guest experiences.
- Strong performing properties (Top 25%) earn $1,776 or more, indicating effective management and desirable locations/amenities.
- Typical properties (Median) generate around $1,066 per month, representing the average market performance.
- Entry-level properties (Bottom 25%) see earnings around $518, often with potential for optimization.
Average Monthly Airbnb Earnings Trend in Nantes
What Is the Monthly Airbnb Occupancy Rate in Nantes?
Maximize your bookings by understanding the Nantes STR occupancy trends. Seasonal demand shifts significantly influence how often properties are booked. Typically, Septembersees the highest demand (peak season occupancy), while June experiences the lowest (low season). Effective strategies, like adjusting minimum stays or offering promotions, can boost occupancy during slower periods. Here's how different property tiers perform in Nantes:
- Best-in-class properties (Top 10%) achieve 82%+ occupancy, indicating high desirability and potentially optimized availability.
- Strong performing properties (Top 25%) maintain 66% or higher occupancy, suggesting good market fit and guest satisfaction.
- Typical properties (Median) have an occupancy rate around 43%.
- Entry-level properties (Bottom 25%) average 21% occupancy, potentially facing higher vacancy.
Average Monthly Occupancy Rate Trend in Nantes
What Is the Average Airbnb Nightly Rate in Nantes?
Effective short term rental pricing strategy in Nantes involves understanding monthly ADR fluctuations. The Average Daily Rate (ADR) for Airbnb in Nantes typically peaks in June and dips lowest during November. Leveraging Airbnb dynamic pricing tools or strategies based on this seasonality can significantly boost revenue. Here's a look at the typical nightly rates achieved:
- Best-in-class properties (Top 10%) command rates of $168+ per night, often due to premium features or locations.
- Strong performing properties (Top 25%) achieve nightly rates of $113 or more.
- Typical properties (Median) charge around $81 per night.
- Entry-level properties (Bottom 25%) earn around $60 per night.
Average Daily Rate (ADR) Trend by Month in Nantes
What Is the RevPAR for Airbnb in Nantes?
RevPAR in Nantes is currently $42. Because RevPAR combines nightly rates with realized occupancy, it is one of the cleanest ways to compare how efficiently listings turn demand into revenue across the market.
- Entry-level properties (Bottom 25%) see $19 RevPAR.
- Typical properties (Median) generate $33 RevPAR.
- Strong performers (Top 25%) earn $51 RevPAR.
- Best-in-class (Top 10%) achieve $77 RevPAR.
Average Monthly RevPAR Trend in Nantes
RevPAR Insights for Nantes
- The average RevPAR in Nantes is $42. This metric combines nightly rates with realized occupancy, making it one of the best single-number indicators of market efficiency.
- The gap between the top 10% ($77) and bottom 25% ($19) is $58, suggesting a relatively compressed market where operational differences yield moderate returns.
- RevPAR peaks in Sep and bottoms out in Jan, mirroring the broader seasonal demand pattern and suggesting opportunities for dynamic pricing.
Recommendations for Hosts
- Track your own RevPAR monthly against these Nantes benchmarks. If your RevPAR falls below the median of $33, examine whether low occupancy or low ADR is the primary drag.
- Top-quartile listings achieve $51+ RevPAR through a combination of competitive pricing, strong reviews, and strategic amenities. Target this tier through incremental improvements.
- Use RevPAR rather than revenue alone when comparing properties of different sizes — it normalizes for available nights and gives a more accurate picture of performance.
Get Live Nantes Market Intelligence 👇
Explore Real-time Analytics
When Is the Peak Season for Airbnb in Nantes?
Nantes's peak Airbnb season falls in August, September, October, while the softest stretch is January, February, November. Overall, the market shows relatively stable year-round demand, which should guide pricing, minimum stays, and cash-flow planning.
Peak Season (August, September, October)
- Revenue averages $1,492 per month
- Occupancy rates average 48.4%
- Daily rates average $97
Shoulder Season
- Revenue averages $1,391 per month
- Occupancy maintains around 42.7%
- Daily rates hold near $105
Low Season (January, February, November)
- Revenue drops to average $1,197 per month
- Occupancy decreases to average 42.5%
- Daily rates adjust to average $99
Seasonality Insights for Nantes
- Airbnb seasonality in Nantes is subdued — revenue stays within a narrow band throughout the year. This is advantageous for hosts who value predictable cash flow and simpler pricing management.
- During the high season, the absolute peak month showcases Nantes's highest earning potential, with monthly revenues climbing to $1,522, occupancy reaching 49.7%, and ADRs peaking at $112.
- Conversely, the slowest single month marks the market's lowest point — revenue may dip to $1,114, occupancy could drop to 38.7%, and ADRs may adjust to $96.
- Understanding both the seasonal averages and these monthly peaks and troughs in revenue, occupancy, and ADR is crucial for maximizing your Airbnb profit potential in Nantes.
Seasonal Strategies for Maximizing Profit
- Peak Season: Maximize revenue through premium pricing. In a high-regulation market like Nantes, ensure your permit covers the number of nights you plan to book — some jurisdictions cap annual rental days.
- Low Season: Offer competitive pricing, extended-stay discounts, and flexible cancellation policies. Target off-season travelers like remote workers, budget-conscious guests, and travelers with flexible schedules.
- Shoulder Seasons: Implement dynamic pricing that bridges peak and low rates. Target weekend travelers, local events, and business visitors. Slightly more flexible terms than peak season can help maintain occupancy without deep discounting.
- With stable year-round demand, Nantes hosts can focus less on seasonal pricing swings and more on incremental improvements — better photos, faster response times, and amenity upgrades that compound over time.
Do You Need a License for Airbnb in Nantes?
Yes, Nantes, Pays de la Loire, France enforces high STR regulations and 79% of active listings show registration evidence — indicating that enforcement is active and compliance is a prerequisite for operating legally. Hosts entering this market should budget for permit fees, inspections, and potential occupancy tax obligations as part of their startup costs. Always verify the latest short-term rental regulations and Airbnb license requirements directly with local government authorities for Nantes to ensure full compliance before hosting.
(Source: AirROI data, 2026, based on 79% licensed listings)
What Are the Best Neighborhoods for Airbnb in Nantes?
In a large, heavily regulated market like Nantes, neighborhood selection is one of the strongest levers for Airbnb investment performance. Zoning rules, permitting availability, and guest demand patterns can vary block by block. The 8 neighborhoods below represent areas where short-term rental activity concentrates — understanding why each one attracts guests and hosts helps investors evaluate where their property type and budget fit best.
| Neighborhood / Area | Why Host Here? (Target Guests & Appeal) | Key Attractions & Landmarks |
|---|---|---|
| Centre-Ville | The vibrant heart of Nantes, known for its historic architecture, eclectic shops, and rich cultural scene. Excellent for attracting tourists interested in exploring the city's history and entertainment. | Château des Ducs de Bretagne, Le Passage Pommeraye, Les Machines de l'île, Cathedral of Saint Peter and Saint Paul, Place Royale |
| Île de Nantes | A modern and artistic district located on an island in the Loire River, featuring innovative architecture and cultural venues. Popular among young travelers and creatives. | Les Machines de l'île, Le Lieu Unique, Hangar À Bananes, Museum of Arts of Nantes |
| Graslin | An upscale district known for its beautiful architecture and proximity to the famous Graslin Theatre. Ideal for those seeking a more refined and elegant experience. | Graslin Theatre, Place Graslin, Le Cours Cambronne, L'École de Design Nantes Atlantique |
| Boulevard de la Prairie au Duc | A budding area of Nantes that has seen recent development and revitalization, making it appealing for modern travelers and tech-savvy guests. | La Cité des Congrès, Île de Nantes Park, Les Machines de l'île, Bord de Loire |
| Nantes Nord | A diverse and vibrant neighborhood with a mix of cultures, offering a unique local experience. It is gaining popularity among visitors looking for a genuine taste of Nantes. | Parc de Procé, Les jardins des plantes, La Fleuriaye |
| Malakoff - St-Donatien | A family-friendly area known for its parks and public spaces, offering a quieter experience while still being close to the city center. | Parc de la Roche et du Lion, Église St. Donatien, Le jardin des plantes |
| Chantenay | A hilly area with stunning views of the Loire, known for its historic charm and local markets, appealing to travelers searching for a picturesque getaway. | Vue de la Loire, Eglise de Chantenay, Parc des Chantiers |
| Saint-Félix | A picturesque riverside neighborhood known for its tranquility and green spaces, perfect for travelers looking to relax away from the city hustle and bustle. | Parc de la Beaujoire, La Loire à Vélo, L'Île de Versailles |
Because Nantes has a high regulation profile, confirming that short-term rental permits are available in your target neighborhood is a critical first step before committing to a property purchase. Regulation can vary at the neighborhood or district level even within the same city.
What Types of Properties Are on Airbnb in Nantes?
Room Type Distribution
Property Type Distribution
Market Composition Insights for Nantes
- The Nantes Airbnb market composition is heavily skewed towards Entire Home/Apt listings, which make up 79.7% of the 2,161 active rentals. This indicates strong guest preference for privacy and space.
- Looking at the property type distribution in Nantes, Apartment/Condo properties are the most common (77.1%), reflecting the local real estate landscape.
- Houses represent a significant 16.7% portion, catering likely to families or larger groups.
- Smaller segments like hotel/boutique, outdoor/unique, others, unique stays (combined 6.2%) offer potential for unique stay experiences.
Nantes Airbnb Room Capacity Analysis (2026): Bedroom Distribution
Distribution of Listings by Number of Bedrooms
Room Capacity Insights for Nantes
- The dominant room capacity in Nantes is 1 bedroom listings, making up 46.1% of the market. This suggests a strong demand for properties suitable for couples or solo travelers.
- Together, 1 bedroom and 2 bedrooms properties represent 63.3% of the active Airbnb listings in Nantes, indicating a high concentration in these sizes.
Nantes Vacation Rental Guest Capacity Trends (2026)
Distribution of Listings by Guest Capacity
Guest Capacity Insights for Nantes
- The most common guest capacity trend in Nantes vacation rentals is listings accommodating 2 guests (36.4%). This suggests the primary traveler segment is likely couples or solo travelers.
- Properties designed for 2 guests and 4 guests dominate the Nantes STR market, accounting for 61.4% of listings.
- 13.3% of properties accommodate 6+ guests, serving the market segment for larger families or group travel in Nantes.
- On average, properties in Nantes are equipped to host 2.9 guests.
How Do Listings in Nantes Compare on Quality?
Listing quality in Nantes can be approximated through presentation depth, bedroom count, and how often hosts disclose exact locations. These signals show how professionally the local supply base is merchandised.
Listing Quality Insights for Nantes
- The average of 15.5 photos is adequate but leaves room for improvement. Top-performing markets typically see 20+ photos per listing.
- 35.4% of listings show their exact location. Lower disclosure rates can increase booking hesitation — guests want to know exactly where they are staying.
Recommendations for Hosts
- Aim for 20+ high-quality photos covering every room, outdoor spaces, views, and the surrounding neighborhood. Professional photography can pay for itself within a few bookings.
- Enable exact location if possible — it removes a common source of guest uncertainty and can improve your listing's position in map-based searches.
- Use these quality indicators as a self-audit checklist. Listings that exceed the Nantes averages across all three metrics are better positioned for premium pricing.
What Amenities Do Airbnb Guests Expect in Nantes?
Amenity Prevalence
Amenity Insights for Nantes
- Essential amenities in Nantes that guests expect include: Wifi. Lacking these (this) could significantly impact bookings.
- Popular amenities like Kitchen, Heating, Smoke alarm are common but not universal. Offering these can provide a competitive edge.
Recommendations for Hosts
- Ensure your listing includes all essential amenities for Nantes: Wifi.
- Prioritize adding missing essentials: Wifi.
- Consider adding popular differentiators like Kitchen or Heating to increase appeal.
- Highlight unique or less common amenities you offer (e.g., hot tub, dedicated workspace, EV charger) in your listing description and photos.
- Regularly check competitor amenities in Nantes to stay competitive.
Which Airbnb Amenities Boost Revenue in Nantes?
Not every amenity matters equally. This table focuses on the amenities most associated with higher revenue in Nantes, which makes it more useful for prioritizing upgrades than a simple popularity list alone.
| Amenity | Prevalence | Revenue With | Revenue Without | Revenue Uplift |
|---|---|---|---|---|
Heating | 91.2% | $11,339 | $3,523 | 221.9% |
SaunaHigh opportunity | 0.6% | $31,754 | $10,530 | 201.6% |
KayakHigh opportunity | 0.2% | $30,620 | $10,602 | 188.8% |
Arcade gamesHigh opportunity | 0.3% | $30,372 | $10,584 | 187.0% |
Children's playroomHigh opportunity | 1.3% | $26,027 | $10,446 | 149.2% |
PoolHigh opportunity | 2.0% | $21,770 | $10,422 | 108.9% |
Hot tubHigh opportunity | 1.8% | $21,787 | $10,443 | 108.6% |
Hair dryer | 71.6% | $12,370 | $6,309 | 96.1% |
Cooking basics | 78.8% | $11,875 | $6,096 | 94.8% |
Dishes and silverware | 81.7% | $11,655 | $6,157 | 89.3% |
Revenue Impact Insights for Nantes
- Heating tops the revenue impact list with a 221.9% uplift — listings with this amenity earn $11,339 vs. $3,523 without it.
- High-opportunity amenities — Sauna, Kayak, Arcade games — combine revenue uplift above 100% with prevalence under 10%, meaning most competitors haven't adopted them yet.
- Heating, Dishes and silverware — while widespread — still correlate with meaningful revenue gains, making them table stakes rather than true differentiators.
Recommendations for Hosts
- Prioritize adding Sauna — it has the best combination of high revenue impact and low market saturation in Nantes.
- Focus your upgrade budget on amenities in the top half of this table. Below-median amenities may improve guest experience but contribute less to revenue growth.
- Highlight revenue-impacting amenities prominently in your listing title, photos, and description — guests can't value what they don't notice.
Dive Deeper: Advanced Nantes STR Market Data (2026)
Ready to unlock more insights? AirROI provides access to advanced metrics and comprehensive Airbnb data for Nantes. Explore detailed analytics beyond this report to refine your investment strategy, optimize pricing, and maximize your vacation rental profits.
Explore Advanced MetricsNantes Airbnb Guest Demographics & Profile Analysis (2026)
Guest Profile Summary for Nantes
- The typical guest profile for Airbnb in Nantes consists of primarily domestic travelers (79%), often arriving from nearby Paris, typically belonging to the Post-2000s (Gen Z/Alpha) group (50%), primarily speaking French or English.
- Domestic travelers account for 79.3% of guests.
- Key international markets include France (79.3%) and United Kingdom (3.8%).
- Top languages spoken are French (39.2%) followed by English (35.6%).
- A significant demographic segment is the Post-2000s (Gen Z/Alpha) group, representing 50% of guests.
Recommendations for Hosts
- Target domestic marketing efforts towards travelers from Paris and Nantes.
- Tailor amenities and listing descriptions to appeal to the dominant Post-2000s (Gen Z/Alpha) demographic (e.g., highlight fast WiFi, smart home features, local guides).
- Highlight unique local experiences or amenities relevant to the primary guest profile.
- Consider seasonal promotions aligned with peak travel times for key origin markets.
What Are Airbnb Guest Ratings in Nantes?
Listings in Nantes average 4.79 out of 5 overall, with about 79.5 reviews per active listing and 38.5% of listings carrying the Guest Favorite badge.
Rating Breakdown by Category
Guest Rating Insights for Nantes
- An average rating of 4.79 places Nantes in solid territory. Most guests leave satisfied, though there is room for hosts to push toward the top tier.
- The strongest subcategory is Communication (4.88), while Value (4.72) trails behind — a useful signal for hosts looking to prioritize upgrades.
- 38.5% of listings carry the Guest Favorite badge, a strong trust signal that can meaningfully lift click-through and booking rates.
Recommendations for Hosts
- Focus improvement efforts on Value — even small gains in the weakest subcategory can lift overall ratings and search ranking.
- Encourage guests to leave reviews after checkout. Listings with more reviews rank higher in search results and convert browsers into bookers more effectively.
Nantes Airbnb Booking Patterns (2026): Available vs. Booked Days
Available Days Distribution
Booked Days Distribution
Booking Pattern Insights for Nantes
- The most common availability pattern in Nantes falls within the 271-366 days range, representing 50.3% of listings. This suggests many properties have significant open periods on their calendars.
- Approximately 80.1% of listings show high availability (181+ days open annually), indicating potential for increased bookings or specific owner usage patterns.
- For booked days, the 91-180 days range is most frequent in Nantes (29.6%), reflecting common guest stay durations or potential owner blocking patterns.
- A notable 20.8% of properties secure long booking periods (181+ days booked per year), highlighting successful long-term rental strategies or significant owner usage.
How Far in Advance Do Guests Book Airbnb in Nantes?
Average Booking Lead Time by Month
Booking Lead Time Insights for Nantes
- The overall average booking lead time for vacation rentals in Nantes is 40 days.
- Guests book furthest in advance for stays during June (average 52 days), likely coinciding with peak travel demand or local events.
- The shortest booking windows occur for stays in February (average 30 days), indicating more last-minute travel plans during this time.
- Seasonally, Summer (45 days avg.) sees the longest lead times, while Winter (32 days avg.) has the shortest, reflecting typical travel planning cycles.
Recommendations for Hosts
- Use the overall average lead time (40 days) as a baseline for your pricing and availability strategy in Nantes.
- For June stays, consider implementing length-of-stay discounts or slightly higher rates for bookings made less than 52 days out to capitalize on advance planning.
- Target marketing efforts for the Summer season well in advance (at least 45 days) to capture early planners.
- Monitor your own booking lead times against these Nantes averages to identify opportunities for dynamic pricing adjustments.
What Is the Average Length of Stay for Airbnb in Nantes?
Guests in Nantes stay about 5.4 nights on average, generating roughly 46,819 reservations and 21.8 bookings per listing in the latest AirROI dataset. The most common check-in time is 4:00 PM and check-out is 11:00 AM.
Monthly Length of Stay in Nantes
Check-in Time Distribution
Check-out Time Distribution
Stay Pattern Insights for Nantes
- A mid-range stay length points to leisure-driven demand — weekend getaways and short vacations. Hosts should optimize for quick turnover efficiency while keeping the guest experience smooth.
- At 21.8 bookings per listing, the turnover rate is high. Hosts with streamlined operations (self-check-in, automated messaging, reliable cleaners) have a structural advantage.
- Stay lengths peak in Sep (5.2 nights) and shorten in Apr (4 nights). Adjust minimum-night requirements seasonally to match.
Recommendations for Hosts
- Leverage the longer-stay pattern by offering weekly discounts — even 5-10% off can convert browsing into bookings for guests considering an extended stay.
- Set your check-in time to match or beat the market standard of 4:00 PM. Offering early check-in flexibility can be a low-cost differentiator.
- Monitor length-of-stay seasonality to adjust minimum-night requirements — longer minimums during peak periods maximize revenue while shorter minimums fill gaps in shoulder seasons.
Nantes Airbnb Minimum Stay Requirements Analysis
Distribution of Listings by Minimum Night Requirement
1 Night
562 listings
26% of total
2 Nights
575 listings
26.6% of total
3 Nights
146 listings
6.8% of total
4-6 Nights
128 listings
5.9% of total
7-29 Nights
73 listings
3.4% of total
30+ Nights
677 listings
31.3% of total
Key Insights
- The most prevalent minimum stay requirement in Nantes is 30+ Nights, adopted by 31.3% of listings. This highlights the market's preference for longer commitments.
- A significant segment (31.3%) caters to monthly stays (30+ nights) in Nantes, pointing to opportunities in the extended-stay market.
Recommendations
- Align with the market by considering a 30+ Nights minimum stay, as 31.3% of Nantes hosts use this setting.
- If feasible, allowing 1-night stays, especially midweek or during low season, could capture last-minute bookings, as only 26% currently do.
- Explore offering discounts for stays of 30+ nights to attract the 31.3% of the market seeking extended stays.
- Adjust minimum nights based on seasonality – potentially shorter during low season and longer during peak demand periods in Nantes.
Nantes Airbnb Cancellation Policy Trends Analysis (2026)
Super Strict 30 Days
3 listings
0.1% of total
Super Strict 60 Days
1 listings
0% of total
Limited
73 listings
3.4% of total
Flexible
722 listings
33.4% of total
Moderate
885 listings
41% of total
Firm
416 listings
19.3% of total
Strict
61 listings
2.8% of total
Cancellation Policy Insights for Nantes
- The prevailing Airbnb cancellation policy trend in Nantes is Moderate, used by 41% of listings.
- The market strongly favors guest-friendly terms, with 74.4% of listings offering Flexible or Moderate policies. This suggests guests in Nantes may expect booking flexibility.
- Strict cancellation policies are quite rare (2.8%), potentially making listings with this policy less competitive unless justified by high demand or property type.
Recommendations for Hosts
- Consider adopting a Moderate policy to align with the 41% market standard in Nantes.
- Using a Strict policy might deter some guests, as only 2.8% of listings use it. Evaluate if potential revenue protection outweighs possible lower booking rates.
- Regularly review your cancellation policy against competitors and market demand shifts in Nantes.
How Much Are Airbnb Cleaning Fees in Nantes?
Cleaning fees in Nantes are meaningful operating levers, not just pass-through charges. What matters most is how often hosts charge them, how high they run relative to market norms, and how large a share of gross revenue they consume.
Cleaning Fee Insights for Nantes
- About 69.1% of Nantes listings charge a cleaning fee — a mixed market where some hosts absorb the cost into nightly rates while others break it out.
- The gap between the average ($87) and median ($35) cleaning fee indicates some high-end properties are pulling the average up considerably.
- Cleaning fees represent 7.8% of gross revenue on average — a modest component of the overall booking price.
Recommendations for Hosts
- Price your cleaning fee competitively against the Nantes median of $35. Fees significantly above market norms can deter bookings, especially for shorter stays.
- Monitor competitor cleaning fees regularly. Airbnb's search algorithm factors in total price, so a well-calibrated cleaning fee can improve your listing's ranking.
What Do the Top Airbnb Listings in Nantes Look Like?
Benchmark your potential! Explore examples of top-performing Airbnb properties in Nantesbased on Trailing Twelve Month (TTM) revenue. Analyze their characteristics, revenue, occupancy rate, and ADR to understand what drives success in this market.

Beautiful house/loft with jacuzzi and billiards
Entire Place • 6 bedrooms

Villa de La Plume
Entire Place • 8 bedrooms
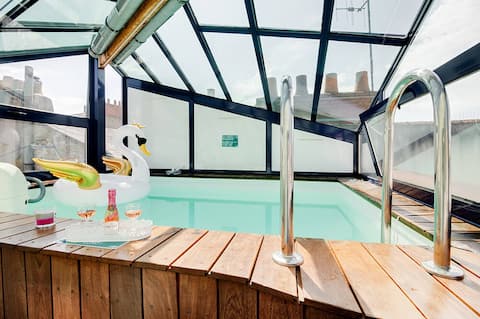
Villa Paradis - Pool & Rooftop in Nantes
Entire Place • 6 bedrooms
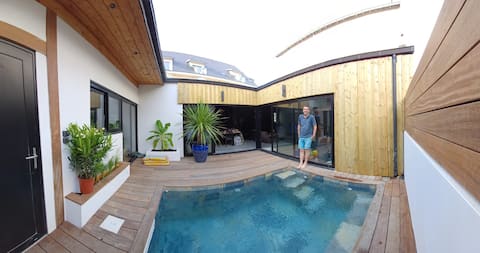
Contemporary home - Atypical - Swimming pool
Entire Place • 1 bedroom

NOCNOC Loft L'atypique - 185m2 heart of Nantes
Entire Place • 6 bedrooms

Charming House | Erdre Riverbank | Garden & BBQ
Entire Place • 5 bedrooms
Note: Performance varies based on location, size, amenities, seasonality, and management quality. Data reflects the past 12 months.
Who Are the Top Airbnb Hosts in Nantes?
Learn from the best! This table showcases top-performing Airbnb hosts in Nantes based on the number of properties managed and estimated total revenue over the past year. Analyze their scale and performance metrics.
| Host Name | Properties | Grossing Revenue | Stay Reviews | Avg Rating |
|---|---|---|---|---|
| Agence Cocoonr Nantes | 59 | $946,276 | 2259 | 4.63/5.0 |
| Elodie | 30 | $597,326 | 1483 | 4.81/5.0 |
| Mickael | 43 | $576,254 | 1098 | 4.67/5.0 |
| Hugo | 18 | $246,145 | 1318 | 4.76/5.0 |
| Élise | 3 | $245,211 | 330 | 4.76/5.0 |
| Elise | 14 | $231,330 | 1595 | 4.81/5.0 |
| Astrid | 15 | $229,321 | 2332 | 4.81/5.0 |
| La Reception | 10 | $215,104 | 274 | 4.70/5.0 |
| Thierry | 16 | $180,087 | 315 | 4.69/5.0 |
| Graziella | 4 | $170,044 | 161 | 4.98/5.0 |
Analyzing the strategies of top hosts, such as their property selection, pricing, and guest communication, can offer valuable lessons for optimizing your own Airbnb operations in Nantes.
Who Are the Airbnb Hosts in Nantes?
Nantes has a relatively balanced host base.
Host Profile Insights for Nantes
- A 42.0% Superhost share is healthy — enough experienced operators to anchor quality without making the market impenetrable for newcomers.
- 4.2% of listings are professionally managed, reflecting a market still dominated by individual hosts.
- 7.1% of listings have Instant Book enabled. Lower Instant Book adoption means many guests must request approval, which can slow conversions.
- 71.1% of listings use Airbnb's simplified pricing (host-only fee), where the host pays the entire platform service fee and the guest sees one all-in price with no separate Airbnb service charge. High adoption signals a professional, PMS-connected host base — Airbnb mandates simplified pricing for software-connected listings.
Recommendations for Hosts
- Earning Superhost status can significantly improve search ranking and guest trust. Focus on maintaining high response rates, low cancellations, and strong reviews.
- Consider enabling Instant Book — it reduces booking friction and Airbnb's algorithm tends to favor Instant Book listings in search results.
- With 32.5% cohosted listings, there may be a growing local market for property management services.
- Benchmark your host metrics against these Nantes averages regularly and adjust your hosting strategy based on what top performers do differently.
Top Professional Management Companies in Nantes
These are the highest-grossing professional property management operations in Nantes, ranked by total revenue across their portfolio. Their performance metrics offer a benchmark for what institutional-level hosting looks like in this market.
| Company | Listings | Revenue | ADR | Occ. | Rating |
|---|---|---|---|---|---|
| Agence Cocoonr Nantes | 59 | $946,276 | $125 | 43.7% | 4.63/5 |
| Mickael | 43 | $576,254 | $97 | 48.8% | 4.67/5 |
| Élise | 3 | $245,211 | $726 | 44.0% | 4.76/5 |
| La Reception | 10 | $215,104 | $213 | 30.6% | 4.70/5 |
| Thierry | 16 | $180,087 | $187 | 40.2% | 4.69/5 |
| Lulu | 11 | $107,942 | $142 | 29.0% | 4.57/5 |
| WeHost | 5 | $73,491 | $96 | 47.2% | 4.50/5 |
| La Rivière House | 5 | $58,255 | $166 | 27.1% | 4.97/5 |
| François | 4 | $37,338 | $114 | 33.7% | 4.55/5 |
| Agence Cocoonr | 1 | $17,284 | $89 | 54.0% | 4.88/5 |
Management Company Insights for Nantes
- The leading management company, Agence Cocoonr Nantes, operates 59 listings with $946,276 in gross revenue — a useful benchmark for what scale looks like in Nantes.
- Top managers average 16 properties each, suggesting professional management in Nantes still operates at a relatively boutique scale.
- Professionally managed listings in the top tier average 4.69/5 in guest ratings — suggesting room for quality improvement even among larger operators.
Recommendations
- With only 4.2% of listings professionally managed, there may be an opportunity to differentiate through more structured operations and consistent guest experiences.
- Study how top management companies price, position, and maintain their portfolios — their ADR and occupancy rates reflect strategies refined across dozens of listings.
- If you're considering hiring a property manager, compare their portfolio performance against these benchmarks before committing.
How Does Nantes's Airbnb Market Compare to Nearby Cities?
How does the Nantes Airbnb market stack up against its neighbors? Compare key performance metrics like average monthly revenue, ADR, and occupancy rates in surrounding areas to understand the broader regional STR landscape.
Compared with Croix-Chapeau, Nantes has 5 percentage points lower occupancy and about $128 lower ADR. That helps frame whether this market is winning more on demand, pricing, or both.
| Market | Active Properties | Monthly Revenue | Daily Rate | Avg. Occupancy |
|---|---|---|---|---|
| Briollay | 17 | $3,059 | $215.05 | 41% |
| Donges | 14 | $3,007 | $302.57 | 41% |
| Saint-Philbert-de-Bouaine | 10 | $2,606 | $235.26 | 31% |
| Croix-Chapeau | 13 | $2,434 | $230.01 | 46% |
| Le Parc | 13 | $2,391 | $260.91 | 35% |
| Le Bois-Plage-en-Ré | 321 | $2,350 | $332.23 | 41% |
| Bourneau | 14 | $2,311 | $363.94 | 31% |
| Le May-sur-Èvre | 11 | $2,300 | $208.07 | 41% |
| Bécon-les-Granits | 10 | $2,296 | $224.99 | 37% |
| Nuaillé-d'Aunis | 12 | $2,248 | $356.45 | 34% |
Frequently Asked Questions About Airbnb in Nantes
These quick answers summarize the most common investor and operator questions using AirROI's latest market data for Nantes.
How much do Airbnb hosts make in Nantes?
Nantes hosts earn about $10,648 per year on average, with an average nightly rate of $102 and RevPAR of $42. Those figures describe the typical revenue environment for active listings in Nantes, Pays de la Loire, not the ceiling for the best operators. Source: AirROI 2026 data, Nantes market, July 2025 to June 2026.
What is the average Airbnb occupancy rate in Nantes?
The average Airbnb occupancy rate in Nantes is 41.1%. August is the strongest month and January is the softest, so hosts should expect demand to move meaningfully throughout the year rather than stay flat.
What is the average Airbnb daily rate in Nantes?
Listings in Nantes average $102 per night. The broader pricing spread also matters: lower-performing listings cluster closer to the lower quartiles, while premium homes can price materially above the city average when demand spikes or listing quality stands out.
How many Airbnb listings are active in Nantes?
Nantes currently has about 2,161 active Airbnb listings in AirROI's market dataset. That supply count helps explain how competitive the market is, how much depth there is for benchmarking, and whether the market behaves like a niche destination or a scaled urban market.
How strict are short-term rental regulations in Nantes?
AirROI currently classifies the short-term rental regulation level in Nantes as High. The dataset also shows about 78.6% of listings with registration evidence. That is a market signal, not legal advice, so hosts should still confirm current licensing and compliance rules locally before listing.
What is the RevPAR for Airbnb in Nantes?
RevPAR in Nantes is about $42. That metric combines pricing and occupancy into one efficiency number, so it is often a better quick benchmark than ADR alone when investors want to compare how well listings convert nightly rates into realized revenue.
Is Airbnb profitable in Nantes?
At 41.1% occupancy, Nantes can be profitable — but margins depend heavily on operating costs, property acquisition price, and how well hosts optimize pricing across seasons. Average annual revenue is $10,648, but individual returns depend on property type, location within the city, and the host's operating efficiency.
How far in advance do guests book Airbnb in Nantes?
The average booking lead time in Nantes is about 40 days — a moderate lead time that gives hosts planning visibility while still benefiting from last-minute bookings. Hosts who understand their market's booking cadence can adjust minimum stays and pricing windows accordingly.
What are the best neighborhoods for Airbnb in Nantes?
Based on AirROI's analysis, some of the top neighborhoods for short-term rentals in Nantes include Centre-Ville, Île de Nantes, Graslin. Each area attracts different guest profiles — from business travelers to leisure visitors — so the best location depends on the property type and target audience a host is aiming for. See the full neighborhood breakdown above.
What type of property performs best on Airbnb in Nantes?
entire_home listings make up 79.7% of the active supply in Nantes. The most common configuration does not always mean the most profitable — operators who identify underserved property types or bedroom counts can sometimes outperform the market average by filling a gap in local supply.
How does Nantes compare to nearby Airbnb markets?
Among neighboring markets, Briollay posts $36,704 in average annual revenue with 40.8% occupancy, compared to Nantes's $10,648 and 41.1%. Comparing nearby markets helps investors understand whether a destination's performance reflects local demand or broader regional trends.
What is the average length of stay in Nantes?
The average Airbnb stay length in Nantes is about 5.4 nights. That matters for turnover, cleaning operations, and pricing strategy because shorter stays increase changeovers while longer stays can smooth occupancy and reduce operational friction.
What is the average Airbnb guest rating in Nantes?
Airbnb listings in Nantes average 4.79 out of 5 overall. About 38.5% of listings carry the guest favorite badge, which suggests a meaningful share of inventory is competing on review quality rather than price alone.
Which amenities boost Airbnb revenue in Nantes?
Heating and Sauna are among the strongest revenue-linked amenities in Nantes. In AirROI's latest dataset, listings with these amenities outperform those without on average revenue, which makes amenities analysis useful for prioritizing investment and listing upgrades.
Do Airbnb hosts charge cleaning fees in Nantes?
Yes. About 69.1% of active Airbnb listings in Nantes charge a cleaning fee, and the average fee is $87. The more important operating benchmark is how much of gross revenue that fee consumes, not just the absolute dollar amount.
What percentage of Airbnb hosts are Superhosts in Nantes?
A 42.0% Superhost rate signals a highly competitive market where review quality and responsiveness are table stakes, not differentiators.
About AirROI Market Data
AirROI tracks over 20 million properties across 190+ countries and maintains 15+ years of historical performance data, making it one of the deepest Airbnb and STR intelligence platforms available. The analytics pipeline aggregates listing-level data monthly — revenue, occupancy, nightly rates, RevPAR, guest demographics, booking patterns, and competitive supply — so investors and operators can benchmark any market against its own history and against neighboring destinations.
Real estate investors, property managers, financial institutions, hedge funds, tourism boards, hospitality consultants, tech platforms, and academic researchers rely on AirROI data to underwrite acquisitions, optimize pricing, model macro trends, and conduct peer-reviewed research. Data is available through in-depth market reports like this one and the Airbnb API with 22 endpoints and an Airbnb MCP Server for AI agents.
AirROI proprietary analytics as of 2026-06-30. Metrics reflect trailing twelve-month aggregates from active listings. Revenue figures are market averages, not projections. Neighborhood descriptions are AI-generated and reviewed for accuracy. For full methodology, see the data methodology page.