New Delhi, DL Airbnb Market Data 2025: STR Report & Statistics
How much can you earn on Airbnb in New Delhi, DL? Based on AirROI's 2025 dataset (June 2024 – May 2025), the short answer is $4,579 per year — at a $42 nightly rate, 37.2% occupancy, and a N/A RevPAR.
With just 20 active listings, New Delhi is a micro-market where moderate demand with room for well-positioned listings to outperform. The market trimmed 42.9% of its supply as weaker listings exited. For hosts in New Delhi, fewer competitors means an opportunity to capture share through operational excellence, smart pricing, and tapping underserved guest segments before the next growth cycle.
Regulation is low with minimal registration requirements, pointing to an operator-friendly environment. In a market this size, differentiated listings with strong reviews can capture outsized returns relative to the competition.

Table of Contents [hide] [show]
What Are the Key Airbnb Metrics in New Delhi?
In New Delhi, the headline Airbnb metrics are $4,579 in average annual revenue,37.2% occupancy, $42 ADR, and $0 in RevPAR, and guests book about 25 days in advance.
How Much Do Airbnb Hosts Earn Monthly in New Delhi?
Understanding the monthly revenue variations for Airbnb listings in New Delhi is key to maximizing your short term rental income potential. Seasonality significantly impacts earnings. Our analysis, based on data from the past 12 months, shows that the peak revenue month for STRs in New Delhi is typically November, while May often presents the lowest earnings, highlighting opportunities for strategic pricing adjustments during shoulder and low seasons. Explore the typical Airbnb income in New Delhi across different performance tiers:
- Best-in-class properties (Top 10%) achieve $1,254+ monthly, often utilizing dynamic pricing and superior guest experiences.
- Strong performing properties (Top 25%) earn $714 or more, indicating effective management and desirable locations/amenities.
- Typical properties (Median) generate around $454 per month, representing the average market performance.
- Entry-level properties (Bottom 25%) see earnings around $197, often with potential for optimization.
Average Monthly Airbnb Earnings Trend in New Delhi
What Is the Monthly Airbnb Occupancy Rate in New Delhi?
Maximize your bookings by understanding the New Delhi STR occupancy trends. Seasonal demand shifts significantly influence how often properties are booked. Typically, Novembersees the highest demand (peak season occupancy), while June experiences the lowest (low season). Effective strategies, like adjusting minimum stays or offering promotions, can boost occupancy during slower periods. Here's how different property tiers perform in New Delhi:
- Best-in-class properties (Top 10%) achieve 76%+ occupancy, indicating high desirability and potentially optimized availability.
- Strong performing properties (Top 25%) maintain 62% or higher occupancy, suggesting good market fit and guest satisfaction.
- Typical properties (Median) have an occupancy rate around 42%.
- Entry-level properties (Bottom 25%) average 23% occupancy, potentially facing higher vacancy.
Average Monthly Occupancy Rate Trend in New Delhi
What Is the Average Airbnb Nightly Rate in New Delhi?
Effective short term rental pricing strategy in New Delhi involves understanding monthly ADR fluctuations. The Average Daily Rate (ADR) for Airbnb in New Delhi typically peaks in August and dips lowest during April. Leveraging Airbnb dynamic pricing tools or strategies based on this seasonality can significantly boost revenue. Here's a look at the typical nightly rates achieved:
- Best-in-class properties (Top 10%) command rates of $128+ per night, often due to premium features or locations.
- Strong performing properties (Top 25%) achieve nightly rates of $64 or more.
- Typical properties (Median) charge around $34 per night.
- Entry-level properties (Bottom 25%) earn around $21 per night.
Average Daily Rate (ADR) Trend by Month in New Delhi
What Is the RevPAR for Airbnb in New Delhi?
RevPAR in New Delhi is currently N/A. Because RevPAR combines nightly rates with realized occupancy, it is one of the cleanest ways to compare how efficiently listings turn demand into revenue across the market.
- Entry-level properties (Bottom 25%) see N/A RevPAR.
- Typical properties (Median) generate N/A RevPAR.
- Strong performers (Top 25%) earn N/A RevPAR.
- Best-in-class (Top 10%) achieve N/A RevPAR.
Average Monthly RevPAR Trend in New Delhi
RevPAR Insights for New Delhi
- RevPAR peaks in Jan and bottoms out in Jan, mirroring the broader seasonal demand pattern and suggesting opportunities for dynamic pricing.
Recommendations for Hosts
- Track your own RevPAR monthly against these New Delhi benchmarks. If your RevPAR falls below the median of N/A, examine whether low occupancy or low ADR is the primary drag.
- Use RevPAR rather than revenue alone when comparing properties of different sizes — it normalizes for available nights and gives a more accurate picture of performance.
Get Live New Delhi Market Intelligence 👇
Explore Real-time Analytics
When Is the Peak Season for Airbnb in New Delhi?
New Delhi's peak Airbnb season falls in November, March, January, while the softest stretch is May, June, August. Overall, the market shows highly seasonal trends requiring careful strategy, which should guide pricing, minimum stays, and cash-flow planning.
Peak Season (November, March, January)
- Revenue averages $856 per month
- Occupancy rates average 59.2%
- Daily rates average $52
Shoulder Season
- Revenue averages $587 per month
- Occupancy maintains around 46.0%
- Daily rates hold near $55
Low Season (May, June, August)
- Revenue drops to average $295 per month
- Occupancy decreases to average 23.4%
- Daily rates adjust to average $55
Seasonality Insights for New Delhi
- Airbnb seasonality in New Delhi is pronounced. Revenue swings sharply between peak and low months, which means pricing strategy, minimum-stay settings, and cash reserves all need to account for extended slower periods.
- During the high season, the absolute peak month showcases New Delhi's highest earning potential, with monthly revenues climbing to $964, occupancy reaching 65.6%, and ADRs peaking at $58.
- Conversely, the slowest single month marks the market's lowest point — revenue may dip to $253, occupancy could drop to 20.6%, and ADRs may adjust to $49.
- Lower occupancy paired with meaningful seasonality means hosts in New Delhi need to maximize every peak-season booking and seriously consider whether off-season pricing adjustments or minimum-stay changes can capture incremental revenue.
Seasonal Strategies for Maximizing Profit
- Peak Season: Maximize revenue through premium pricing and potentially longer minimum stays. Ensure high availability and consider tightening cancellation policies to reduce last-minute gaps.
- Low Season: Offer competitive pricing, extended-stay discounts, and flexible cancellation policies. Target off-season travelers like remote workers, budget-conscious guests, and travelers with flexible schedules.
- Shoulder Seasons: Implement dynamic pricing that bridges peak and low rates. Target weekend travelers, local events, and business visitors. Slightly more flexible terms than peak season can help maintain occupancy without deep discounting.
- In a highly seasonal market like New Delhi, building a cash reserve during the top months is essential for covering fixed costs during the slow period. Automated pricing tools can help capture demand shifts in real time.
Do You Need a License for Airbnb in New Delhi?
Low regulation and minimal registration activity in New Delhi, DL, India point to an operator-friendly environment. That said, even low-regulation markets may have tax collection requirements, safety standards, or HOA rules that affect short-term rental operations. Always verify the latest short-term rental regulations and Airbnb license requirements directly with local government authorities for New Delhi to ensure full compliance before hosting.
(Source: AirROI data, 2026, finding no licensed listings among those analyzed)
What Are the Best Neighborhoods for Airbnb in New Delhi?
With a compact short-term rental market, New Delhi gives early-mover hosts an advantage in the right neighborhoods. The areas listed below are where guest demand and local attractions converge — a useful lens for investors evaluating whether to enter this market and where to position their listing.
| Neighborhood / Area | Why Host Here? (Target Guests & Appeal) | Key Attractions & Landmarks |
|---|---|---|
| Connaught Place | The central business district of Delhi, known for its colonial architecture, luxurious shopping, and vibrant nightlife. A prime spot for tourists and business travelers alike, offering easy access to major attractions. | India Gate, Jantar Mantar, Rajiv Chowk, Connaught Place Market, National Museum, Cultural venues |
| South Delhi | A lush and upscale area known for its parks and affluent neighborhoods. Popular among families and long-term travelers, it offers a quieter atmosphere while being close to many attractions. | Qutub Minar, Lotus Temple, Hauz Khas Village, Saket malls, Garden of Five Senses, Dhaula Kuan |
| Paharganj | Famous for its budget accommodations and backpacker vibe. This area attracts budget travelers and tourists, offering a unique cultural experience and proximity to Delhi's railway station. | New Delhi Railway Station, Ramakrishna Ashram Marg, Thamel restaurant area, Street markets, Central Delhi |
| Karol Bagh | A historic area known for its bustling markets and traditional shopping experiences. It's popular among tourists looking for local goods and an authentic experience of Delhi. | Karol Bagh Market, Ajmal Khan Road, Heritage sites, Local street food, Jain Temple |
| Chandni Chowk | One of the oldest and busiest markets in Old Delhi, known for its historic significance and crowded bazaars. Ideal for travelers wanting to experience the rich culture and historical sites of Delhi. | Red Fort, Jama Masjid, Chandni Chowk Market, Gurudwara Sis Ganj Sahib, Street food stalls |
| Greater Noida | An emerging suburb of Delhi known for its modern infrastructure and planned city features. It appeals to business travelers and families seeking spacious accommodations. | Buddh International Circuit, Noida Golf Course, Shopping malls, City Park, Formula 1 track |
| Dwarka | A well-planned residential area that boasts wide roads and modern amenities. It is popular among families and long-term travelers, providing a suburban feel close to the city. | Dwarka Sector 21 Metro Station, ISKCON Temple, Dwarka malls, Sai Baba Temple, Numerous parks |
| Aerocity | A modern, upscale area that is home to many hotels and restaurants catering to business travelers and tourists. It offers proximity to the airport and recent development projects. | Indira Gandhi International Airport, Worldmark, Corporate offices, Luxury hotels, Dining options |
With 8 distinct neighborhoods showing meaningful short-term rental activity, New Delhi offers diversification within a single market. Investors can tailor their strategy — from high-turnover tourist zones to quieter residential areas that attract longer stays and remote workers.
What Types of Properties Are on Airbnb in New Delhi?
Room Type Distribution
Property Type Distribution
Market Composition Insights for New Delhi
- The New Delhi Airbnb market composition is heavily skewed towards Entire Home/Apt listings, which make up 60% of the 20 active rentals. This indicates strong guest preference for privacy and space.
- However, a notable 35% share for Private Rooms suggests opportunities for budget-conscious travelers or hosts renting out spare rooms.
- Looking at the property type distribution in New Delhi, Apartment/Condo properties are the most common (90%), reflecting the local real estate landscape.
New Delhi Airbnb Room Capacity Analysis (2026): Bedroom Distribution
Distribution of Listings by Number of Bedrooms
Room Capacity Insights for New Delhi
- The dominant room capacity in New Delhi is 1 bedroom listings, making up 25% of the market. This suggests a strong demand for properties suitable for couples or solo travelers.
- Together, 1 bedroom and 3 bedrooms properties represent 40.0% of the active Airbnb listings in New Delhi, indicating a high concentration in these sizes.
- A significant 25.0% of listings offer 3+ bedrooms, catering to larger groups and families seeking more space in New Delhi.
New Delhi Vacation Rental Guest Capacity Trends (2026)
Distribution of Listings by Guest Capacity
Guest Capacity Insights for New Delhi
- The most common guest capacity trend in New Delhi vacation rentals is listings accommodating 8+ guests (15%). This suggests the primary traveler segment is likely larger groups.
- Properties designed for 8+ guests and 2 guests dominate the New Delhi STR market, accounting for 25.0% of listings.
- 25.0% of properties accommodate 6+ guests, serving the market segment for larger families or group travel in New Delhi.
- On average, properties in New Delhi are equipped to host 3.0 guests.
What Amenities Do Airbnb Guests Expect in New Delhi?
Amenity Prevalence
Amenity Insights for New Delhi
- Essential amenities in New Delhi that guests expect include: Essentials, Hair dryer, Air conditioning, Wifi, Hangers, Iron, Refrigerator. Lacking these (any) could significantly impact bookings.
- Popular amenities like Hot water, TV, Shampoo are common but not universal. Offering these can provide a competitive edge.
Recommendations for Hosts
- Ensure your listing includes all essential amenities for New Delhi: Essentials, Hair dryer, Air conditioning, Wifi, Hangers, Iron, Refrigerator.
- Prioritize adding missing essentials: Iron, Refrigerator.
- Consider adding popular differentiators like Hot water or TV to increase appeal.
- Highlight unique or less common amenities you offer (e.g., hot tub, dedicated workspace, EV charger) in your listing description and photos.
- Regularly check competitor amenities in New Delhi to stay competitive.
Dive Deeper: Advanced New Delhi STR Market Data (2026)
Ready to unlock more insights? AirROI provides access to advanced metrics and comprehensive Airbnb data for New Delhi. Explore detailed analytics beyond this report to refine your investment strategy, optimize pricing, and maximize your vacation rental profits.
Explore Advanced MetricsNew Delhi Airbnb Guest Demographics & Profile Analysis (2026)
Guest Profile Summary for New Delhi
- The typical guest profile for Airbnb in New Delhi consists of a mix of domestic (58%) and international guests, often arriving from nearby Bengaluru, typically belonging to the Post-2000s (Gen Z/Alpha) group (50%), primarily speaking English or Hindi.
- Domestic travelers account for 58.4% of guests.
- Key international markets include India (58.4%) and United States (12.4%).
- Top languages spoken are English (42.9%) followed by Hindi (30.5%).
- A significant demographic segment is the Post-2000s (Gen Z/Alpha) group, representing 50% of guests.
Recommendations for Hosts
- Balance marketing efforts between domestic and international channels based on the guest mix.
- Tailor amenities and listing descriptions to appeal to the dominant Post-2000s (Gen Z/Alpha) demographic (e.g., highlight fast WiFi, smart home features, local guides).
- Highlight unique local experiences or amenities relevant to the primary guest profile.
- Consider seasonal promotions aligned with peak travel times for key origin markets.
New Delhi Airbnb Booking Patterns (2026): Available vs. Booked Days
Available Days Distribution
Booked Days Distribution
Booking Pattern Insights for New Delhi
- The most common availability pattern in New Delhi falls within the 271-366 days range, representing 45% of listings. This suggests many properties have significant open periods on their calendars.
- Approximately 85.0% of listings show high availability (181+ days open annually), indicating potential for increased bookings or specific owner usage patterns.
- For booked days, the 91-180 days range is most frequent in New Delhi (40%), reflecting common guest stay durations or potential owner blocking patterns.
- A notable 15.0% of properties secure long booking periods (181+ days booked per year), highlighting successful long-term rental strategies or significant owner usage.
How Far in Advance Do Guests Book Airbnb in New Delhi?
Average Booking Lead Time by Month
Booking Lead Time Insights for New Delhi
- The overall average booking lead time for vacation rentals in New Delhi is 25 days.
- Guests book furthest in advance for stays during March (average 53 days), likely coinciding with peak travel demand or local events.
- The shortest booking windows occur for stays in June (average 11 days), indicating more last-minute travel plans during this time.
- Seasonally, Winter (28 days avg.) sees the longest lead times, while Summer (20 days avg.) has the shortest, reflecting typical travel planning cycles.
Recommendations for Hosts
- Use the overall average lead time (25 days) as a baseline for your pricing and availability strategy in New Delhi.
- For March stays, consider implementing length-of-stay discounts or slightly higher rates for bookings made less than 53 days out to capitalize on advance planning.
- During June, focus on last-minute booking availability and promotions, as guests book with very short notice (11 days avg.).
- Target marketing efforts for the Winter season well in advance (at least 28 days) to capture early planners.
- Monitor your own booking lead times against these New Delhi averages to identify opportunities for dynamic pricing adjustments.
New Delhi Airbnb Minimum Stay Requirements Analysis
Distribution of Listings by Minimum Night Requirement
1 Night
11 listings
57.9% of total
2 Nights
7 listings
36.8% of total
4-6 Nights
1 listings
5.3% of total
Key Insights
- The most prevalent minimum stay requirement in New Delhi is 1 Night, adopted by 57.9% of listings. This highlights the market's preference for shorter, flexible bookings.
- A strong majority (94.7%) of the New Delhi Airbnb data shows acceptance of very short stays (1-2 nights), indicating a dynamic, high-turnover market.
Recommendations
- Align with the market by considering a 1 Night minimum stay, as 57.9% of New Delhi hosts use this setting.
- Adjust minimum nights based on seasonality – potentially shorter during low season and longer during peak demand periods in New Delhi.
New Delhi Airbnb Cancellation Policy Trends Analysis (2026)
Flexible
1 listings
5% of total
Moderate
10 listings
50% of total
Firm
4 listings
20% of total
Strict
5 listings
25% of total
Cancellation Policy Insights for New Delhi
- The prevailing Airbnb cancellation policy trend in New Delhi is Moderate, used by 50% of listings.
- There's a relatively balanced mix between guest-friendly (55.0%) and stricter (45.0%) policies, offering choices for different guest needs.
Recommendations for Hosts
- Consider adopting a Moderate policy to align with the 50% market standard in New Delhi.
- Regularly review your cancellation policy against competitors and market demand shifts in New Delhi.
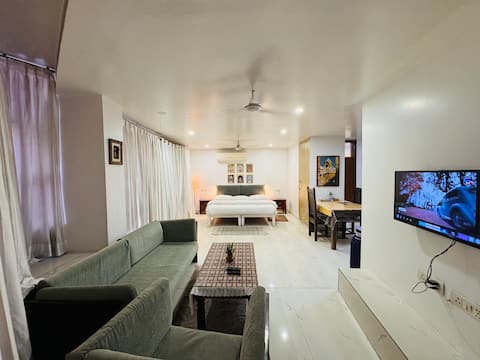
What Do the Top Airbnb Listings in New Delhi Look Like?
Benchmark your potential! Explore examples of top-performing Airbnb properties in New Delhibased on Trailing Twelve Month (TTM) revenue. Analyze their characteristics, revenue, occupancy rate, and ADR to understand what drives success in this market.

4 BHK private apartment in GK2 | Harmony Suites
Entire Place • 4 bedrooms

GK2 |South Delhi |Charming 3 BHK private apartment
Entire Place • 3 bedrooms

Charming 2 BHK private apartment, GK2 -South Delhi
Entire Place • 2 bedrooms
Studio 37 Juliet Balcony spacious 800 sq ft apt
Entire Place • 1 bedroom

Living By The Greens (Ground Floor)
Entire Place • 3 bedrooms
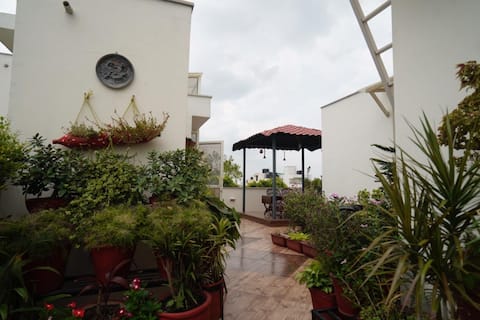
Terrace Room wt Gazebo @ Green Park Hauz Khaz Vill
Entire Place • 1 bedroom
Note: Performance varies based on location, size, amenities, seasonality, and management quality. Data reflects the past 12 months.
Who Are the Top Airbnb Hosts in New Delhi?
Learn from the best! This table showcases top-performing Airbnb hosts in New Delhi based on the number of properties managed and estimated total revenue over the past year. Analyze their scale and performance metrics.
| Host Name | Properties | Grossing Revenue | Stay Reviews | Avg Rating |
|---|---|---|---|---|
| Priya | 3 | $38,747 | 85 | 4.78/5.0 |
| Aman | 2 | $14,612 | 207 | 4.80/5.0 |
| Prakash | 1 | $7,827 | 193 | 4.42/5.0 |
| Mani | 1 | $7,781 | 435 | 4.79/5.0 |
| Rohit | 2 | $6,381 | 101 | 4.67/5.0 |
| Host #162925338 | 1 | $3,833 | 197 | 4.63/5.0 |
| Sushmita | 1 | $3,134 | 121 | 4.93/5.0 |
| Amrit | 2 | $2,963 | 21 | 5.00/5.0 |
| Shehla | 1 | $2,249 | 69 | 4.64/5.0 |
| Woren And Irina Airbnb | 1 | $1,653 | 156 | 4.78/5.0 |
Analyzing the strategies of top hosts, such as their property selection, pricing, and guest communication, can offer valuable lessons for optimizing your own Airbnb operations in New Delhi.
How Does New Delhi's Airbnb Market Compare to Nearby Cities?
How does the New Delhi Airbnb market stack up against its neighbors? Compare key performance metrics like average monthly revenue, ADR, and occupancy rates in surrounding areas to understand the broader regional STR landscape.
Compared with New Delhi, New Delhi has 4 percentage points higher occupancy and about $18 lower ADR. That helps frame whether this market is winning more on demand, pricing, or both.
| Market | Active Properties | Monthly Revenue | Daily Rate | Avg. Occupancy |
|---|---|---|---|---|
| Bissar Akbarpur | 14 | $2,350 | $426.16 | 24% |
| libiza town | 11 | $425 | $138.93 | 20% |
| New Delhi | 2,094 | $383 | $59.87 | 33% |
| Noida | 28 | $376 | $169.61 | 17% |
| Gurugram District | 512 | $344 | $77.37 | 25% |
| Gurugram | 1,294 | $328 | $82.71 | 24% |
| Deri | 14 | $322 | $171.55 | 17% |
| Dwarka | 66 | $280 | $45.87 | 32% |
| Bajidpur | 25 | $249 | $108.09 | 20% |
| Nagli Sakpur | 25 | $249 | $69.43 | 22% |
Frequently Asked Questions About Airbnb in New Delhi
These quick answers summarize the most common investor and operator questions using AirROI's latest market data for New Delhi.
How much do Airbnb hosts make in New Delhi?
New Delhi hosts earn about $4,579 per year on average, with an average nightly rate of $42 and RevPAR of N/A. Those figures describe the typical revenue environment for active listings in New Delhi, DL, not the ceiling for the best operators. Source: AirROI 2025 data, New Delhi market, June 2024 to May 2025.
What is the average Airbnb occupancy rate in New Delhi?
The average Airbnb occupancy rate in New Delhi is 37.2%. November is the strongest month and May is the softest, so hosts should expect demand to move meaningfully throughout the year rather than stay flat.
What is the average Airbnb daily rate in New Delhi?
Listings in New Delhi average $42 per night. The broader pricing spread also matters: lower-performing listings cluster closer to the lower quartiles, while premium homes can price materially above the city average when demand spikes or listing quality stands out.
How many Airbnb listings are active in New Delhi?
New Delhi currently has about 20 active Airbnb listings in AirROI's market dataset. That supply count helps explain how competitive the market is, how much depth there is for benchmarking, and whether the market behaves like a niche destination or a scaled urban market.
How strict are short-term rental regulations in New Delhi?
AirROI currently classifies the short-term rental regulation level in New Delhi as Low. The dataset also shows about 0.0% of listings with registration evidence. That is a market signal, not legal advice, so hosts should still confirm current licensing and compliance rules locally before listing.
What is the RevPAR for Airbnb in New Delhi?
RevPAR in New Delhi is about N/A. That metric combines pricing and occupancy into one efficiency number, so it is often a better quick benchmark than ADR alone when investors want to compare how well listings convert nightly rates into realized revenue.
Is Airbnb profitable in New Delhi?
Occupancy of 37.2% means New Delhi is a more selective market. Profitability is achievable but requires careful cost management, premium positioning, or targeting longer stays to reduce turnover. Average annual revenue is $4,579, but individual returns depend on property type, location within the city, and the host's operating efficiency.
How far in advance do guests book Airbnb in New Delhi?
The average booking lead time in New Delhi is about 25 days — a moderate lead time that gives hosts planning visibility while still benefiting from last-minute bookings. Hosts who understand their market's booking cadence can adjust minimum stays and pricing windows accordingly.
What are the best neighborhoods for Airbnb in New Delhi?
Based on AirROI's analysis, some of the top neighborhoods for short-term rentals in New Delhi include Connaught Place, South Delhi, Paharganj. Each area attracts different guest profiles — from business travelers to leisure visitors — so the best location depends on the property type and target audience a host is aiming for. See the full neighborhood breakdown above.
What type of property performs best on Airbnb in New Delhi?
entire_home listings make up 60.0% of the active supply in New Delhi. The most common configuration does not always mean the most profitable — operators who identify underserved property types or bedroom counts can sometimes outperform the market average by filling a gap in local supply.
How does New Delhi compare to nearby Airbnb markets?
Among neighboring markets, Bissar Akbarpur posts $28,199 in average annual revenue with 23.5% occupancy, compared to New Delhi's $4,579 and 37.2%. Comparing nearby markets helps investors understand whether a destination's performance reflects local demand or broader regional trends.
When is the peak season for Airbnb in New Delhi?
November is the highest-revenue month in New Delhi, while May is the softest. The revenue spread between them indicates a highly seasonal market — revenue in the peak month is more than double the low month, so cash-flow planning and pricing automation are critical.
About AirROI Market Data
AirROI tracks over 20 million properties across 190+ countries and maintains 15+ years of historical performance data, making it one of the deepest Airbnb and STR intelligence platforms available. The analytics pipeline aggregates listing-level data monthly — revenue, occupancy, nightly rates, RevPAR, guest demographics, booking patterns, and competitive supply — so investors and operators can benchmark any market against its own history and against neighboring destinations.
Real estate investors, property managers, financial institutions, hedge funds, tourism boards, hospitality consultants, tech platforms, and academic researchers rely on AirROI data to underwrite acquisitions, optimize pricing, model macro trends, and conduct peer-reviewed research. Data is available through in-depth market reports like this one and the Airbnb API with 22 endpoints and an Airbnb MCP Server for AI agents.
AirROI proprietary analytics as of 2025-05-31. Metrics reflect trailing twelve-month aggregates from active listings. Revenue figures are market averages, not projections. Neighborhood descriptions are AI-generated and reviewed for accuracy. For full methodology, see the data methodology page.