Mayrouba, Keserwan-Jbeil Governorate Airbnb Market Data 2025: STR Report & Statistics
How much can you earn on Airbnb in Mayrouba, Keserwan-Jbeil Governorate? Based on AirROI's 2025 dataset (May 2024 – April 2025), the short answer is $12,340 per year — at a $187 nightly rate, 25.2% occupancy, and a N/A RevPAR.
With just 18 active listings, Mayrouba is a micro-market where selective demand that rewards strong listing quality and pricing strategy. Supply grew 260.0% and nightly rates have risen, creating an environment where the most bookable listings stand to capture outsized share. Hosts who pair competitive pricing with strong guest experience are well-positioned to convert the growing traveler base into consistent bookings.
Regulation is low with minimal registration requirements, pointing to an operator-friendly environment. In a market this size, differentiated listings with strong reviews can capture outsized returns relative to the competition.

Table of Contents [hide] [show]
What Are the Key Airbnb Metrics in Mayrouba?
In Mayrouba, the headline Airbnb metrics are $12,340 in average annual revenue,25.2% occupancy, $187 ADR, and $0 in RevPAR, and guests book about 13 days in advance.
How Much Do Airbnb Hosts Earn Monthly in Mayrouba?
Understanding the monthly revenue variations for Airbnb listings in Mayrouba is key to maximizing your short term rental income potential. Seasonality significantly impacts earnings. Our analysis, based on data from the past 12 months, shows that the peak revenue month for STRs in Mayrouba is typically April, while December often presents the lowest earnings, highlighting opportunities for strategic pricing adjustments during shoulder and low seasons. Explore the typical Airbnb income in Mayrouba across different performance tiers:
- Best-in-class properties (Top 10%) achieve $5,739+ monthly, often utilizing dynamic pricing and superior guest experiences.
- Strong performing properties (Top 25%) earn $3,358 or more, indicating effective management and desirable locations/amenities.
- Typical properties (Median) generate around $1,476 per month, representing the average market performance.
- Entry-level properties (Bottom 25%) see earnings around $838, often with potential for optimization.
Average Monthly Airbnb Earnings Trend in Mayrouba
What Is the Monthly Airbnb Occupancy Rate in Mayrouba?
Maximize your bookings by understanding the Mayrouba STR occupancy trends. Seasonal demand shifts significantly influence how often properties are booked. Typically, Aprilsees the highest demand (peak season occupancy), while January experiences the lowest (low season). Effective strategies, like adjusting minimum stays or offering promotions, can boost occupancy during slower periods. Here's how different property tiers perform in Mayrouba:
- Best-in-class properties (Top 10%) achieve 58%+ occupancy, indicating high desirability and potentially optimized availability.
- Strong performing properties (Top 25%) maintain 41% or higher occupancy, suggesting good market fit and guest satisfaction.
- Typical properties (Median) have an occupancy rate around 20%.
- Entry-level properties (Bottom 25%) average 13% occupancy, potentially facing higher vacancy.
Average Monthly Occupancy Rate Trend in Mayrouba
What Is the Average Airbnb Nightly Rate in Mayrouba?
Effective short term rental pricing strategy in Mayrouba involves understanding monthly ADR fluctuations. The Average Daily Rate (ADR) for Airbnb in Mayrouba typically peaks in January and dips lowest during October. Leveraging Airbnb dynamic pricing tools or strategies based on this seasonality can significantly boost revenue. Here's a look at the typical nightly rates achieved:
- Best-in-class properties (Top 10%) command rates of $291+ per night, often due to premium features or locations.
- Strong performing properties (Top 25%) achieve nightly rates of $208 or more.
- Typical properties (Median) charge around $131 per night.
- Entry-level properties (Bottom 25%) earn around $100 per night.
Average Daily Rate (ADR) Trend by Month in Mayrouba
What Is the RevPAR for Airbnb in Mayrouba?
RevPAR in Mayrouba is currently N/A. Because RevPAR combines nightly rates with realized occupancy, it is one of the cleanest ways to compare how efficiently listings turn demand into revenue across the market.
- Entry-level properties (Bottom 25%) see N/A RevPAR.
- Typical properties (Median) generate N/A RevPAR.
- Strong performers (Top 25%) earn N/A RevPAR.
- Best-in-class (Top 10%) achieve N/A RevPAR.
Average Monthly RevPAR Trend in Mayrouba
RevPAR Insights for Mayrouba
- RevPAR peaks in Jan and bottoms out in Jan, mirroring the broader seasonal demand pattern and suggesting opportunities for dynamic pricing.
Recommendations for Hosts
- Track your own RevPAR monthly against these Mayrouba benchmarks. If your RevPAR falls below the median of N/A, examine whether low occupancy or low ADR is the primary drag.
- Use RevPAR rather than revenue alone when comparing properties of different sizes — it normalizes for available nights and gives a more accurate picture of performance.
Get Live Mayrouba Market Intelligence 👇
Explore Real-time Analytics
When Is the Peak Season for Airbnb in Mayrouba?
Mayrouba's peak Airbnb season falls in April, March, February, while the softest stretch is January, June, December. Overall, the market shows highly seasonal trends requiring careful strategy, which should guide pricing, minimum stays, and cash-flow planning.
Peak Season (April, March, February)
- Revenue averages $3,677 per month
- Occupancy rates average 40.1%
- Daily rates average $177
Shoulder Season
- Revenue averages $2,074 per month
- Occupancy maintains around 26.7%
- Daily rates hold near $159
Low Season (January, June, December)
- Revenue drops to average $1,466 per month
- Occupancy decreases to average 15.7%
- Daily rates adjust to average $178
Seasonality Insights for Mayrouba
- Airbnb seasonality in Mayrouba is pronounced. Revenue swings sharply between peak and low months, which means pricing strategy, minimum-stay settings, and cash reserves all need to account for extended slower periods.
- During the high season, the absolute peak month showcases Mayrouba's highest earning potential, with monthly revenues climbing to $4,086, occupancy reaching 44.0%, and ADRs peaking at $187.
- Conversely, the slowest single month marks the market's lowest point — revenue may dip to $1,250, occupancy could drop to 14.0%, and ADRs may adjust to $157.
- Lower occupancy paired with meaningful seasonality means hosts in Mayrouba need to maximize every peak-season booking and seriously consider whether off-season pricing adjustments or minimum-stay changes can capture incremental revenue.
Seasonal Strategies for Maximizing Profit
- Peak Season: Maximize revenue through premium pricing and potentially longer minimum stays. Ensure high availability and consider tightening cancellation policies to reduce last-minute gaps.
- Low Season: Offer competitive pricing, extended-stay discounts, and flexible cancellation policies. Target off-season travelers like remote workers, budget-conscious guests, and travelers with flexible schedules.
- Shoulder Seasons: Implement dynamic pricing that bridges peak and low rates. Target weekend travelers, local events, and business visitors. Slightly more flexible terms than peak season can help maintain occupancy without deep discounting.
- In a highly seasonal market like Mayrouba, building a cash reserve during the top months is essential for covering fixed costs during the slow period. Automated pricing tools can help capture demand shifts in real time.
Do You Need a License for Airbnb in Mayrouba?
Low regulation and minimal registration activity in Mayrouba, Keserwan-Jbeil Governorate, Lebanon point to an operator-friendly environment. That said, even low-regulation markets may have tax collection requirements, safety standards, or HOA rules that affect short-term rental operations. Always verify the latest short-term rental regulations and Airbnb license requirements directly with local government authorities for Mayrouba to ensure full compliance before hosting.
(Source: AirROI data, 2026, finding no licensed listings among those analyzed)
What Are the Best Neighborhoods for Airbnb in Mayrouba?
With a compact short-term rental market, Mayrouba gives early-mover hosts an advantage in the right neighborhoods. The areas listed below are where guest demand and local attractions converge — a useful lens for investors evaluating whether to enter this market and where to position their listing.
| Neighborhood / Area | Why Host Here? (Target Guests & Appeal) | Key Attractions & Landmarks |
|---|---|---|
| Lebanon's Mountain Resorts | Ideal for summer getaways and winter sports, attracting both local and international tourists. The beautiful scenery and outdoor activities make it a prime location for Airbnb hosting. | Faraya Mzaar Ski Resort, Faqra Ruins, Kfardebian, Mzaar Ski Resort, Hiking trails in the mountains |
| Jounieh Bay | A picturesque coastal area with stunning views and a vibrant nightlife. It's a favorite among tourists looking for beachside fun and cultural experiences. | St. George Bay, Teleferique, Holly Spirit University, Old Souk Jounieh, Fesik Bay, beach clubs |
| Byblos | One of the oldest cities in the world, rich in history and culture. Attracts tourists interested in history, archaeology, and Lebanese cuisine. | Byblos Castle, Ancient Port of Byblos, Saint John-Marc Church, Byblos Fossil Museum, Byblos Souk |
| Zahle | Offers beautiful landscapes and is known for its famous wine production. Attracts wine lovers and those seeking a picturesque retreat. | Chateau Ksara, Wine tours, Baqaa River, Shahrour Lake, Lebanese cuisine restaurants |
| Baabdat | A charming village close to Beirut, known for its beautiful mountain views and cultural spots. It attracts those looking for a quiet escape from the city. | Our Lady of the Mountain, Baabdat Village History, Hiking trails, Local craft shops, Traditional Lebanese restaurants |
| Kfardebian | A gateway to skiing in winter and hiking in summer, appealing to both adventure seekers and families. | Kfardebian Ski Resort, Hiking in the summer, Chalet-style accommodations, Scenic views, Local cuisine |
| Aley | A highly sought-after destination for people wanting to escape the summer heat of the city, known for its cool climate and greenery. | Aley Waterfall, Al Hossain Park, Local markets, Scenic walks, Restaurants with a view |
| Mar Mikhayel | A trendy neighborhood in Beirut known for its nightlife and artistic vibe, popular among younger tourists and locals alike. | Bars and nightclubs, Art galleries, Street art, Cafés, Cultural festivals |
With 8 distinct neighborhoods showing meaningful short-term rental activity, Mayrouba offers diversification within a single market. Investors can tailor their strategy — from high-turnover tourist zones to quieter residential areas that attract longer stays and remote workers.
What Types of Properties Are on Airbnb in Mayrouba?
Room Type Distribution
Property Type Distribution
Market Composition Insights for Mayrouba
- The Mayrouba Airbnb market composition is heavily skewed towards Entire Home/Apt listings, which make up 100% of the 18 active rentals. This indicates strong guest preference for privacy and space.
- Looking at the property type distribution in Mayrouba, House properties are the most common (94.4%), reflecting the local real estate landscape.
- Houses represent a significant 94.4% portion, catering likely to families or larger groups.
Mayrouba Airbnb Room Capacity Analysis (2026): Bedroom Distribution
Distribution of Listings by Number of Bedrooms
Room Capacity Insights for Mayrouba
- The dominant room capacity in Mayrouba is 1 bedroom listings, making up 61.1% of the market. This suggests a strong demand for properties suitable for couples or solo travelers.
- Together, 1 bedroom and 2 bedrooms properties represent 83.3% of the active Airbnb listings in Mayrouba, indicating a high concentration in these sizes.
- With over half the market (61.1%) consisting of studios or 1-bedroom units, Mayrouba is particularly well-suited for individuals or couples.
Mayrouba Vacation Rental Guest Capacity Trends (2026)
Distribution of Listings by Guest Capacity
Guest Capacity Insights for Mayrouba
- The most common guest capacity trend in Mayrouba vacation rentals is listings accommodating 2 guests (50%). This suggests the primary traveler segment is likely couples or solo travelers.
- Properties designed for 2 guests and 6 guests dominate the Mayrouba STR market, accounting for 66.7% of listings.
- A significant 50.0% of listings cater specifically to 1-2 guests, highlighting strong demand from couples and solo travelers in Mayrouba.
- 27.8% of properties accommodate 6+ guests, serving the market segment for larger families or group travel in Mayrouba.
- On average, properties in Mayrouba are equipped to host 3.8 guests.
What Amenities Do Airbnb Guests Expect in Mayrouba?
Amenity Prevalence
Amenity Insights for Mayrouba
- Essential amenities in Mayrouba that guests expect include: Wifi, Hot water, Essentials, Free parking on premises, BBQ grill. Lacking these (any) could significantly impact bookings.
- Popular amenities like Heating, TV, Outdoor dining area are common but not universal. Offering these can provide a competitive edge.
Recommendations for Hosts
- Ensure your listing includes all essential amenities for Mayrouba: Wifi, Hot water, Essentials, Free parking on premises, BBQ grill.
- Consider adding popular differentiators like Heating or TV to increase appeal.
- Highlight unique or less common amenities you offer (e.g., hot tub, dedicated workspace, EV charger) in your listing description and photos.
- Regularly check competitor amenities in Mayrouba to stay competitive.
Dive Deeper: Advanced Mayrouba STR Market Data (2026)
Ready to unlock more insights? AirROI provides access to advanced metrics and comprehensive Airbnb data for Mayrouba. Explore detailed analytics beyond this report to refine your investment strategy, optimize pricing, and maximize your vacation rental profits.
Explore Advanced MetricsMayrouba Airbnb Guest Demographics & Profile Analysis (2026)
Guest Profile Summary for Mayrouba
- The typical guest profile for Airbnb in Mayrouba consists of a mix of domestic (44%) and international guests, with top international origins including United Arab Emirates, typically belonging to the Post-2000s (Gen Z/Alpha) group (50%), primarily speaking English or Arabic.
- Domestic travelers account for 43.5% of guests.
- Key international markets include Lebanon (43.5%) and United Arab Emirates (13%).
- Top languages spoken are English (39%) followed by Arabic (30.5%).
- A significant demographic segment is the Post-2000s (Gen Z/Alpha) group, representing 50% of guests.
Recommendations for Hosts
- Balance marketing efforts between domestic and international channels based on the guest mix.
- Tailor amenities and listing descriptions to appeal to the dominant Post-2000s (Gen Z/Alpha) demographic (e.g., highlight fast WiFi, smart home features, local guides).
- Highlight unique local experiences or amenities relevant to the primary guest profile.
- Consider seasonal promotions aligned with peak travel times for key origin markets.
Mayrouba Airbnb Booking Patterns (2026): Available vs. Booked Days
Available Days Distribution
Booked Days Distribution
Booking Pattern Insights for Mayrouba
- The most common availability pattern in Mayrouba falls within the 271-366 days range, representing 88.9% of listings. This suggests many properties have significant open periods on their calendars.
- Approximately 94.5% of listings show high availability (181+ days open annually), indicating potential for increased bookings or specific owner usage patterns.
- For booked days, the 1-30 days range is most frequent in Mayrouba (55.6%), reflecting common guest stay durations or potential owner blocking patterns.
- A notable 5.6% of properties secure long booking periods (181+ days booked per year), highlighting successful long-term rental strategies or significant owner usage.
How Far in Advance Do Guests Book Airbnb in Mayrouba?
Average Booking Lead Time by Month
Booking Lead Time Insights for Mayrouba
- The overall average booking lead time for vacation rentals in Mayrouba is 13 days.
- Guests book furthest in advance for stays during September (average 25 days), likely coinciding with peak travel demand or local events.
- The shortest booking windows occur for stays in November (average 4 days), indicating more last-minute travel plans during this time.
- Seasonally, Winter (15 days avg.) sees the longest lead times, while Spring (10 days avg.) has the shortest, reflecting typical travel planning cycles.
Recommendations for Hosts
- Use the overall average lead time (13 days) as a baseline for your pricing and availability strategy in Mayrouba.
- For September stays, consider implementing length-of-stay discounts or slightly higher rates for bookings made less than 25 days out to capitalize on advance planning.
- During November, focus on last-minute booking availability and promotions, as guests book with very short notice (4 days avg.).
- Target marketing efforts for the Winter season well in advance (at least 15 days) to capture early planners.
- Monitor your own booking lead times against these Mayrouba averages to identify opportunities for dynamic pricing adjustments.
Mayrouba Airbnb Minimum Stay Requirements Analysis
Distribution of Listings by Minimum Night Requirement
1 Night
18 listings
100% of total
Key Insights
- The most prevalent minimum stay requirement in Mayrouba is 1 Night, adopted by 100% of listings. This highlights the market's preference for shorter, flexible bookings.
- A strong majority (100.0%) of the Mayrouba Airbnb data shows acceptance of very short stays (1-2 nights), indicating a dynamic, high-turnover market.
Recommendations
- Align with the market by considering a 1 Night minimum stay, as 100% of Mayrouba hosts use this setting.
- Adjust minimum nights based on seasonality – potentially shorter during low season and longer during peak demand periods in Mayrouba.
Mayrouba Airbnb Cancellation Policy Trends Analysis (2026)
Flexible
2 listings
33.3% of total
Moderate
1 listings
16.7% of total
Firm
3 listings
50% of total
Cancellation Policy Insights for Mayrouba
- The prevailing Airbnb cancellation policy trend in Mayrouba is Firm, used by 50% of listings.
- There's a relatively balanced mix between guest-friendly (50.0%) and stricter (50.0%) policies, offering choices for different guest needs.
Recommendations for Hosts
- Consider adopting a Firm policy to align with the 50% market standard in Mayrouba.
- Regularly review your cancellation policy against competitors and market demand shifts in Mayrouba.
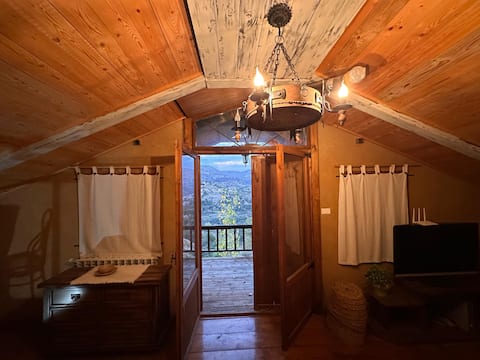
What Do the Top Airbnb Listings in Mayrouba Look Like?
Benchmark your potential! Explore examples of top-performing Airbnb properties in Mayroubabased on Trailing Twelve Month (TTM) revenue. Analyze their characteristics, revenue, occupancy rate, and ADR to understand what drives success in this market.
The Balance Villa - Caim Mountain Retreat
Entire Place • 1 bedroom
The Harmony Villa - Caim Mountain Retreat
Entire Place • 1 bedroom
lovely moments in lebanon
Entire Place • 4 bedrooms
The Energy Villa - Caim Mountain Retreat
Entire Place • 1 bedroom
Mountain Bliss
Entire Place • 3 bedrooms
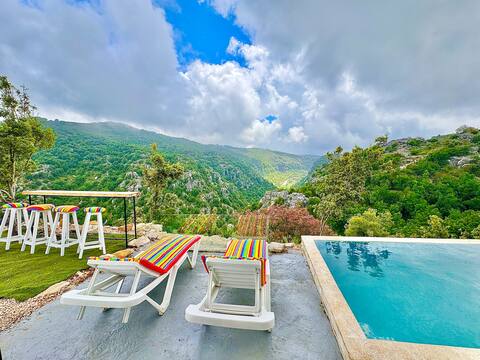
Poolside Paradise - K1
Entire Place • 1 bedroom
Note: Performance varies based on location, size, amenities, seasonality, and management quality. Data reflects the past 12 months.
Who Are the Top Airbnb Hosts in Mayrouba?
Learn from the best! This table showcases top-performing Airbnb hosts in Mayrouba based on the number of properties managed and estimated total revenue over the past year. Analyze their scale and performance metrics.
| Host Name | Properties | Grossing Revenue | Stay Reviews | Avg Rating |
|---|---|---|---|---|
| Maryline | 3 | $126,334 | 43 | 4.94/5.0 |
| Host #206462835 | 1 | $44,726 | 0 | 0.00/5.0 |
| Léa | 10 | $30,978 | 8 | 0.95/5.0 |
| Host #481743133 | 1 | $12,267 | 0 | 0.00/5.0 |
| Host #468469145 | 2 | $5,255 | 1 | 0.00/5.0 |
| Chris | 1 | $2,557 | 4 | 4.75/5.0 |
Analyzing the strategies of top hosts, such as their property selection, pricing, and guest communication, can offer valuable lessons for optimizing your own Airbnb operations in Mayrouba.
How Does Mayrouba's Airbnb Market Compare to Nearby Cities?
How does the Mayrouba Airbnb market stack up against its neighbors? Compare key performance metrics like average monthly revenue, ADR, and occupancy rates in surrounding areas to understand the broader regional STR landscape.
Compared with Dbayeh, Mayrouba has 20 percentage points lower occupancy and about $45 higher ADR. That helps frame whether this market is winning more on demand, pricing, or both.
| Market | Active Properties | Monthly Revenue | Daily Rate | Avg. Occupancy |
|---|---|---|---|---|
| Aannaya | 10 | $2,308 | $559.40 | 20% |
| Paralimni | 1,152 | $1,557 | $228.97 | 40% |
| Dbayeh | 25 | $1,070 | $142.19 | 45% |
| Mar Maroun | 27 | $1,056 | $173.37 | 31% |
| Maale Yosef Regional Council | 64 | $962 | $361.40 | 21% |
| Jumayza | 30 | $917 | $103.12 | 41% |
| Mevoot HaHermon Regional Council | 79 | $759 | $273.11 | 22% |
| Nasrah | 16 | $749 | $118.76 | 42% |
| Kfaraabida | 23 | $717 | $163.50 | 25% |
| Galil Elyon Regional Council | 79 | $713 | $288.93 | 25% |
Frequently Asked Questions About Airbnb in Mayrouba
These quick answers summarize the most common investor and operator questions using AirROI's latest market data for Mayrouba.
How much do Airbnb hosts make in Mayrouba?
Mayrouba hosts earn about $12,340 per year on average, with an average nightly rate of $187 and RevPAR of N/A. Those figures describe the typical revenue environment for active listings in Mayrouba, Keserwan-Jbeil Governorate, not the ceiling for the best operators. Source: AirROI 2025 data, Mayrouba market, May 2024 to April 2025.
What is the average Airbnb occupancy rate in Mayrouba?
The average Airbnb occupancy rate in Mayrouba is 25.2%. April is the strongest month and December is the softest, so hosts should expect demand to move meaningfully throughout the year rather than stay flat.
What is the average Airbnb daily rate in Mayrouba?
Listings in Mayrouba average $187 per night. The broader pricing spread also matters: lower-performing listings cluster closer to the lower quartiles, while premium homes can price materially above the city average when demand spikes or listing quality stands out.
How many Airbnb listings are active in Mayrouba?
Mayrouba currently has about 18 active Airbnb listings in AirROI's market dataset. That supply count helps explain how competitive the market is, how much depth there is for benchmarking, and whether the market behaves like a niche destination or a scaled urban market.
How strict are short-term rental regulations in Mayrouba?
AirROI currently classifies the short-term rental regulation level in Mayrouba as Low. The dataset also shows about 0.0% of listings with registration evidence. That is a market signal, not legal advice, so hosts should still confirm current licensing and compliance rules locally before listing.
What is the RevPAR for Airbnb in Mayrouba?
RevPAR in Mayrouba is about N/A. That metric combines pricing and occupancy into one efficiency number, so it is often a better quick benchmark than ADR alone when investors want to compare how well listings convert nightly rates into realized revenue.
Is Airbnb profitable in Mayrouba?
Occupancy of 25.2% means Mayrouba is a more selective market. Profitability is achievable but requires careful cost management, premium positioning, or targeting longer stays to reduce turnover. Average annual revenue is $12,340, but individual returns depend on property type, location within the city, and the host's operating efficiency.
How far in advance do guests book Airbnb in Mayrouba?
The average booking lead time in Mayrouba is about 13 days — a relatively short booking window, meaning most guests decide within a few weeks of their trip — dynamic pricing can capture late demand. Hosts who understand their market's booking cadence can adjust minimum stays and pricing windows accordingly.
What are the best neighborhoods for Airbnb in Mayrouba?
Based on AirROI's analysis, some of the top neighborhoods for short-term rentals in Mayrouba include Lebanon's Mountain Resorts, Jounieh Bay, Byblos. Each area attracts different guest profiles — from business travelers to leisure visitors — so the best location depends on the property type and target audience a host is aiming for. See the full neighborhood breakdown above.
What type of property performs best on Airbnb in Mayrouba?
entire_home listings make up 100.0% of the active supply in Mayrouba. The most common configuration does not always mean the most profitable — operators who identify underserved property types or bedroom counts can sometimes outperform the market average by filling a gap in local supply.
How does Mayrouba compare to nearby Airbnb markets?
Among neighboring markets, Aannaya posts $27,701 in average annual revenue with 20.2% occupancy, compared to Mayrouba's $12,340 and 25.2%. Comparing nearby markets helps investors understand whether a destination's performance reflects local demand or broader regional trends.
When is the peak season for Airbnb in Mayrouba?
April is the highest-revenue month in Mayrouba, while December is the softest. The revenue spread between them indicates a highly seasonal market — revenue in the peak month is more than double the low month, so cash-flow planning and pricing automation are critical.
About AirROI Market Data
AirROI tracks over 20 million properties across 190+ countries and maintains 15+ years of historical performance data, making it one of the deepest Airbnb and STR intelligence platforms available. The analytics pipeline aggregates listing-level data monthly — revenue, occupancy, nightly rates, RevPAR, guest demographics, booking patterns, and competitive supply — so investors and operators can benchmark any market against its own history and against neighboring destinations.
Real estate investors, property managers, financial institutions, hedge funds, tourism boards, hospitality consultants, tech platforms, and academic researchers rely on AirROI data to underwrite acquisitions, optimize pricing, model macro trends, and conduct peer-reviewed research. Data is available through in-depth market reports like this one and the Airbnb API with 22 endpoints and an Airbnb MCP Server for AI agents.
AirROI proprietary analytics as of 2025-04-30. Metrics reflect trailing twelve-month aggregates from active listings. Revenue figures are market averages, not projections. Neighborhood descriptions are AI-generated and reviewed for accuracy. For full methodology, see the data methodology page.