Naega-myeon, Ganghwa-gun Airbnb Market Data 2025: STR Report & Statistics
How much can you earn on Airbnb in Naega-myeon, Ganghwa-gun? Based on AirROI's 2025 dataset (June 2024 – May 2025), the short answer is $5,787 per year — at a $146 nightly rate, 20.8% occupancy, and a N/A RevPAR.
With just 26 active listings, Naega-myeon is a micro-market where selective demand that rewards strong listing quality and pricing strategy.
Regulation is high, and hosts should factor licensing costs and compliance timelines into their launch plan. In a market this size, differentiated listings with strong reviews can capture outsized returns relative to the competition.

Table of Contents [hide] [show]
What Are the Key Airbnb Metrics in Naega-myeon?
In Naega-myeon, the headline Airbnb metrics are $5,787 in average annual revenue,20.8% occupancy, $146 ADR, and $0 in RevPAR, and guests book about 14 days in advance.
How Much Do Airbnb Hosts Earn Monthly in Naega-myeon?
Understanding the monthly revenue variations for Airbnb listings in Naega-myeon is key to maximizing your short term rental income potential. Seasonality significantly impacts earnings. Our analysis, based on data from the past 12 months, shows that the peak revenue month for STRs in Naega-myeon is typically March, while November often presents the lowest earnings, highlighting opportunities for strategic pricing adjustments during shoulder and low seasons. Explore the typical Airbnb income in Naega-myeon across different performance tiers:
- Best-in-class properties (Top 10%) achieve $1,864+ monthly, often utilizing dynamic pricing and superior guest experiences.
- Strong performing properties (Top 25%) earn $1,337 or more, indicating effective management and desirable locations/amenities.
- Typical properties (Median) generate around $1,023 per month, representing the average market performance.
- Entry-level properties (Bottom 25%) see earnings around $625, often with potential for optimization.
Average Monthly Airbnb Earnings Trend in Naega-myeon
What Is the Monthly Airbnb Occupancy Rate in Naega-myeon?
Maximize your bookings by understanding the Naega-myeon STR occupancy trends. Seasonal demand shifts significantly influence how often properties are booked. Typically, Decembersees the highest demand (peak season occupancy), while November experiences the lowest (low season). Effective strategies, like adjusting minimum stays or offering promotions, can boost occupancy during slower periods. Here's how different property tiers perform in Naega-myeon:
- Best-in-class properties (Top 10%) achieve 35%+ occupancy, indicating high desirability and potentially optimized availability.
- Strong performing properties (Top 25%) maintain 28% or higher occupancy, suggesting good market fit and guest satisfaction.
- Typical properties (Median) have an occupancy rate around 20%.
- Entry-level properties (Bottom 25%) average 13% occupancy, potentially facing higher vacancy.
Average Monthly Occupancy Rate Trend in Naega-myeon
What Is the Average Airbnb Nightly Rate in Naega-myeon?
Effective short term rental pricing strategy in Naega-myeon involves understanding monthly ADR fluctuations. The Average Daily Rate (ADR) for Airbnb in Naega-myeon typically peaks in March and dips lowest during August. Leveraging Airbnb dynamic pricing tools or strategies based on this seasonality can significantly boost revenue. Here's a look at the typical nightly rates achieved:
- Best-in-class properties (Top 10%) command rates of $246+ per night, often due to premium features or locations.
- Strong performing properties (Top 25%) achieve nightly rates of $165 or more.
- Typical properties (Median) charge around $138 per night.
- Entry-level properties (Bottom 25%) earn around $111 per night.
Average Daily Rate (ADR) Trend by Month in Naega-myeon
What Is the RevPAR for Airbnb in Naega-myeon?
RevPAR in Naega-myeon is currently N/A. Because RevPAR combines nightly rates with realized occupancy, it is one of the cleanest ways to compare how efficiently listings turn demand into revenue across the market.
- Entry-level properties (Bottom 25%) see N/A RevPAR.
- Typical properties (Median) generate N/A RevPAR.
- Strong performers (Top 25%) earn N/A RevPAR.
- Best-in-class (Top 10%) achieve N/A RevPAR.
Average Monthly RevPAR Trend in Naega-myeon
RevPAR Insights for Naega-myeon
- RevPAR peaks in Jan and bottoms out in Jan, mirroring the broader seasonal demand pattern and suggesting opportunities for dynamic pricing.
Recommendations for Hosts
- Track your own RevPAR monthly against these Naega-myeon benchmarks. If your RevPAR falls below the median of N/A, examine whether low occupancy or low ADR is the primary drag.
- Use RevPAR rather than revenue alone when comparing properties of different sizes — it normalizes for available nights and gives a more accurate picture of performance.
Get Live Naega-myeon Market Intelligence 👇
Explore Real-time Analytics
When Is the Peak Season for Airbnb in Naega-myeon?
Naega-myeon's peak Airbnb season falls in March, April, May, while the softest stretch is August, September, October. Overall, the market shows highly seasonal trends requiring careful strategy, which should guide pricing, minimum stays, and cash-flow planning.
Peak Season (March, April, May)
- Revenue averages $1,323 per month
- Occupancy rates average 24.2%
- Daily rates average $172
Shoulder Season
- Revenue averages $618 per month
- Occupancy maintains around 13.4%
- Daily rates hold near $150
Low Season (August, September, October)
- Revenue drops to average $0 per month
- Occupancy decreases to average 0.0%
- Daily rates adjust to average $137
Seasonality Insights for Naega-myeon
- Airbnb seasonality in Naega-myeon is pronounced. Revenue swings sharply between peak and low months, which means pricing strategy, minimum-stay settings, and cash reserves all need to account for extended slower periods.
- During the high season, the absolute peak month showcases Naega-myeon's highest earning potential, with monthly revenues climbing to $1,390, occupancy reaching 27.4%, and ADRs peaking at $177.
- Conversely, the slowest single month marks the market's lowest point — revenue may dip to $0, occupancy could drop to 0.0%, and ADRs may adjust to $136.
- Lower occupancy paired with meaningful seasonality means hosts in Naega-myeon need to maximize every peak-season booking and seriously consider whether off-season pricing adjustments or minimum-stay changes can capture incremental revenue.
Seasonal Strategies for Maximizing Profit
- Peak Season: Maximize revenue through premium pricing. In a high-regulation market like Naega-myeon, ensure your permit covers the number of nights you plan to book — some jurisdictions cap annual rental days.
- Low Season: Offer competitive pricing, extended-stay discounts, and flexible cancellation policies. Target off-season travelers like remote workers, budget-conscious guests, and travelers with flexible schedules.
- Shoulder Seasons: Implement dynamic pricing that bridges peak and low rates. Target weekend travelers, local events, and business visitors. Slightly more flexible terms than peak season can help maintain occupancy without deep discounting.
- In a highly seasonal market like Naega-myeon, building a cash reserve during the top months is essential for covering fixed costs during the slow period. Automated pricing tools can help capture demand shifts in real time.
Do You Need a License for Airbnb in Naega-myeon?
Naega-myeon, Ganghwa-gun, South Korea has a high regulation classification, yet only 58% of listings show registration evidence. That gap between regulation on the books and compliance on the ground can shift quickly — municipalities often tighten enforcement in waves, putting unregistered operators at risk of fines or delisting. Always verify the latest short-term rental regulations and Airbnb license requirements directly with local government authorities for Naega-myeon to ensure full compliance before hosting.
(Source: AirROI data, 2026, based on 58% licensed listings)
What Are the Best Neighborhoods for Airbnb in Naega-myeon?
With a compact short-term rental market, Naega-myeon gives early-mover hosts an advantage in the right neighborhoods. The areas listed below are where guest demand and local attractions converge — a useful lens for investors evaluating whether to enter this market and where to position their listing.
| Neighborhood / Area | Why Host Here? (Target Guests & Appeal) | Key Attractions & Landmarks |
|---|---|---|
| Ganghwa Island | Beautiful and scenic island known for its natural beauty, cultural heritage, and historical sites. Attracts tourists looking for a getaway from the city with a blend of nature and history. | Ganghwa Peace Observatory, Gwangseongbo Fortress, Ganghwa Martyrs Shrine, Chamseongdan, Eunyulbong Peak, Dolmen Sites |
| Sindu-ri Beach | A popular beach destination on Ganghwa Island offering sandy shores and clear waters, perfect for family vacations and water activities. | Sindu-ri Beach, water sports activities, beachfront restaurants, sunset views |
| Haeinsa Temple | Famous for its historic Buddhist temple, attracting visitors interested in spirituality and culture. Haeinsa is a UNESCO World Heritage site that gives insight into Korean history. | Haeinsa Temple, Tripitaka Koreana, Mount Gaya, temple stay programs |
| Dongmak Beach | A serene beach known for its beautiful sunrises and quiet atmosphere, ideal for tourists seeking relaxation and nature. | Dongmak Beach, scenic walking trails, local seafood restaurants, fishing experiences |
| Ganghwa Herbal Village | A unique village focusing on health and wellness through traditional Korean herbs, attracting tourists interested in wellness tourism. | herbal medicine shops, traditional wellness programs, nature walks, local markets |
| Ganghwa Seonwon Temple | A historic temple that serves as a cultural landmark, drawing visitors interested in Korean Buddhism and serene environments. | Seonwon Temple, meditation programs, cultural festivals, peaceful gardens |
| Naegeumgang Island | A lesser-known island that offers stunning coastal views and outdoor activities, appealing to adventurous tourists. | hiking trails, coastal views, fishing spots, picnic areas |
| Ganghwa Grapes Festival | An annual event celebrating local agriculture, especially grapes, attracting families and tourists looking for unique local experiences. | grape vineyards, local food stalls, cultural performances, family activities |
Because Naega-myeon has a high regulation profile, confirming that short-term rental permits are available in your target neighborhood is a critical first step before committing to a property purchase. Regulation can vary at the neighborhood or district level even within the same city.
What Types of Properties Are on Airbnb in Naega-myeon?
Room Type Distribution
Property Type Distribution
Market Composition Insights for Naega-myeon
- The Naega-myeon Airbnb market composition is heavily skewed towards Entire Home/Apt listings, which make up 96.2% of the 26 active rentals. This indicates strong guest preference for privacy and space.
- Looking at the property type distribution in Naega-myeon, Outdoor/Unique properties are the most common (69.2%), reflecting the local real estate landscape.
- The presence of 7.7% Hotel/Boutique listings indicates integration with traditional hospitality.
- Smaller segments like house (combined 3.8%) offer potential for unique stay experiences.
Naega-myeon Airbnb Room Capacity Analysis (2026): Bedroom Distribution
Distribution of Listings by Number of Bedrooms
Room Capacity Insights for Naega-myeon
- The dominant room capacity in Naega-myeon is 1 bedroom listings, making up 96.2% of the market. This suggests a strong demand for properties suitable for couples or solo travelers.
- Together, 1 bedroom and 2 bedrooms properties represent 100.0% of the active Airbnb listings in Naega-myeon, indicating a high concentration in these sizes.
- With over half the market (96.2%) consisting of studios or 1-bedroom units, Naega-myeon is particularly well-suited for individuals or couples.
Naega-myeon Vacation Rental Guest Capacity Trends (2026)
Distribution of Listings by Guest Capacity
Guest Capacity Insights for Naega-myeon
- The most common guest capacity trend in Naega-myeon vacation rentals is listings accommodating 2 guests (65.4%). This suggests the primary traveler segment is likely couples or solo travelers.
- Properties designed for 2 guests and 4 guests dominate the Naega-myeon STR market, accounting for 92.3% of listings.
- A significant 65.4% of listings cater specifically to 1-2 guests, highlighting strong demand from couples and solo travelers in Naega-myeon.
- On average, properties in Naega-myeon are equipped to host 2.9 guests.
What Amenities Do Airbnb Guests Expect in Naega-myeon?
Amenity Prevalence
Amenity Insights for Naega-myeon
- Essential amenities in Naega-myeon that guests expect include: Smoke alarm, Fire extinguisher, Wifi, Air conditioning, Free parking on premises, Outdoor dining area, BBQ grill, Kitchen, Carbon monoxide alarm. Lacking these (any) could significantly impact bookings.
- Popular amenities like Fire pit are common but not universal. Offering these can provide a competitive edge.
Recommendations for Hosts
- Ensure your listing includes all essential amenities for Naega-myeon: Smoke alarm, Fire extinguisher, Wifi, Air conditioning, Free parking on premises, Outdoor dining area, BBQ grill, Kitchen, Carbon monoxide alarm.
- Prioritize adding missing essentials: BBQ grill, Kitchen, Carbon monoxide alarm.
- Consider adding popular differentiators like Fire pit to increase appeal.
- Highlight unique or less common amenities you offer (e.g., hot tub, dedicated workspace, EV charger) in your listing description and photos.
- Regularly check competitor amenities in Naega-myeon to stay competitive.
Dive Deeper: Advanced Naega-myeon STR Market Data (2026)
Ready to unlock more insights? AirROI provides access to advanced metrics and comprehensive Airbnb data for Naega-myeon. Explore detailed analytics beyond this report to refine your investment strategy, optimize pricing, and maximize your vacation rental profits.
Explore Advanced MetricsNaega-myeon Airbnb Guest Demographics & Profile Analysis (2026)
Guest Profile Summary for Naega-myeon
- The typical guest profile for Airbnb in Naega-myeon consists of primarily domestic travelers (100%), often arriving from nearby Suwon-si, typically belonging to the 1980s (Millennials) group (50%), primarily speaking Korean.
- Domestic travelers account for 100.0% of guests.
- A significant demographic segment is the Post-2000s (Gen Z/Alpha) group, representing 50% of guests.
Recommendations for Hosts
- Target domestic marketing efforts towards travelers from Suwon-si.
- Tailor amenities and listing descriptions to appeal to the dominant 1980s (Millennials) demographic (e.g., highlight fast WiFi, smart home features, local guides).
- Highlight unique local experiences or amenities relevant to the primary guest profile.
- Consider seasonal promotions aligned with peak travel times for key origin markets.
Naega-myeon Airbnb Booking Patterns (2026): Available vs. Booked Days
Available Days Distribution
Booked Days Distribution
Booking Pattern Insights for Naega-myeon
- The most common availability pattern in Naega-myeon falls within the 271-366 days range, representing 100% of listings. This suggests many properties have significant open periods on their calendars.
- Approximately 100.0% of listings show high availability (181+ days open annually), indicating potential for increased bookings or specific owner usage patterns.
- For booked days, the 31-90 days range is most frequent in Naega-myeon (57.7%), reflecting common guest stay durations or potential owner blocking patterns.
How Far in Advance Do Guests Book Airbnb in Naega-myeon?
Average Booking Lead Time by Month
Booking Lead Time Insights for Naega-myeon
- The overall average booking lead time for vacation rentals in Naega-myeon is 14 days.
- Guests book furthest in advance for stays during May (average 26 days), likely coinciding with peak travel demand or local events.
- The shortest booking windows occur for stays in October (average 0 days), indicating more last-minute travel plans during this time.
- Seasonally, Spring (18 days avg.) sees the longest lead times, while Summer (0 days avg.) has the shortest, reflecting typical travel planning cycles.
Recommendations for Hosts
- Use the overall average lead time (14 days) as a baseline for your pricing and availability strategy in Naega-myeon.
- For May stays, consider implementing length-of-stay discounts or slightly higher rates for bookings made less than 26 days out to capitalize on advance planning.
- During October, focus on last-minute booking availability and promotions, as guests book with very short notice (0 days avg.).
- Target marketing efforts for the Spring season well in advance (at least 18 days) to capture early planners.
- Monitor your own booking lead times against these Naega-myeon averages to identify opportunities for dynamic pricing adjustments.
Naega-myeon Airbnb Minimum Stay Requirements Analysis
Distribution of Listings by Minimum Night Requirement
1 Night
26 listings
100% of total
Key Insights
- The most prevalent minimum stay requirement in Naega-myeon is 1 Night, adopted by 100% of listings. This highlights the market's preference for shorter, flexible bookings.
- A strong majority (100.0%) of the Naega-myeon Airbnb data shows acceptance of very short stays (1-2 nights), indicating a dynamic, high-turnover market.
Recommendations
- Align with the market by considering a 1 Night minimum stay, as 100% of Naega-myeon hosts use this setting.
- Adjust minimum nights based on seasonality – potentially shorter during low season and longer during peak demand periods in Naega-myeon.
Naega-myeon Airbnb Cancellation Policy Trends Analysis (2026)
Flexible
24 listings
92.3% of total
Strict
2 listings
7.7% of total
Cancellation Policy Insights for Naega-myeon
- The prevailing Airbnb cancellation policy trend in Naega-myeon is Flexible, used by 92.3% of listings.
- The market strongly favors guest-friendly terms, with 92.3% of listings offering Flexible or Moderate policies. This suggests guests in Naega-myeon may expect booking flexibility.
- Strict cancellation policies are quite rare (7.7%), potentially making listings with this policy less competitive unless justified by high demand or property type.
Recommendations for Hosts
- Consider adopting a Flexible policy to align with the 92.3% market standard in Naega-myeon.
- Given the high prevalence of Flexible policies (92.3%), offering this can enhance booking appeal, especially during shoulder seasons.
- Using a Strict policy might deter some guests, as only 7.7% of listings use it. Evaluate if potential revenue protection outweighs possible lower booking rates.
- Regularly review your cancellation policy against competitors and market demand shifts in Naega-myeon.
What Do the Top Airbnb Listings in Naega-myeon Look Like?
Benchmark your potential! Explore examples of top-performing Airbnb properties in Naega-myeonbased on Trailing Twelve Month (TTM) revenue. Analyze their characteristics, revenue, occupancy rate, and ADR to understand what drives success in this market.

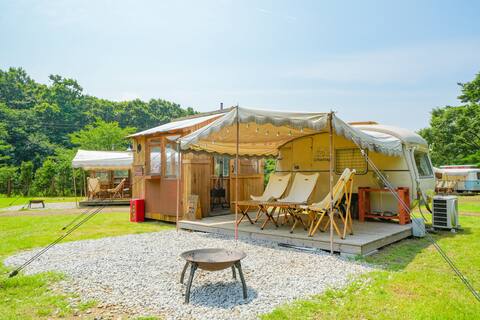
동화감성 독채숙소 in 멜로우멘션
Entire Place • 1 bedroom
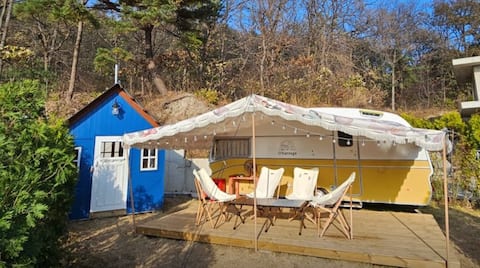
F. 감성글램핑 Urbantage 첼튼햄 /오두막/냉난방완비
Entire Place • 1 bedroom

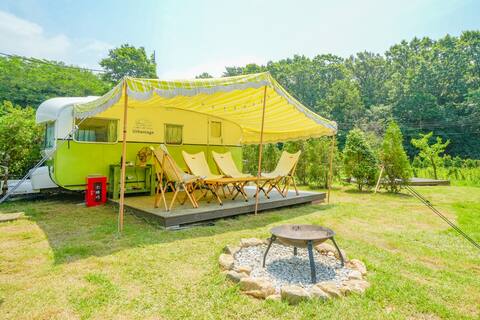
T. 감성글램핑 Urbantage 알루엣 /오두막/냉난방완비
Entire Place • 1 bedroom
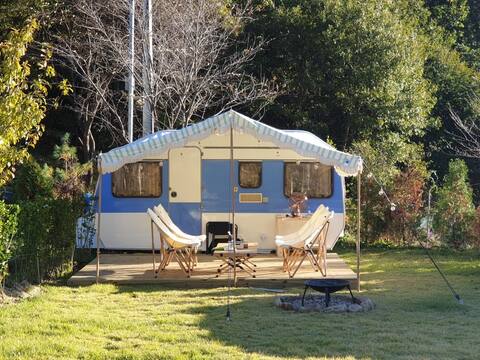
U. 감성글램핑 Urbantage 사파리 엠버 /오두막/냉난방완비
Entire Place • 1 bedroom
S. 감성글램핑 Urbantage 올리브 /오두막/냉난방완비
Entire Place • 1 bedroom
R. 감성글램핑 Urbantage 머스킷티어 /오두막/냉난방완비
Entire Place • 1 bedroom
Note: Performance varies based on location, size, amenities, seasonality, and management quality. Data reflects the past 12 months.
Who Are the Top Airbnb Hosts in Naega-myeon?
Learn from the best! This table showcases top-performing Airbnb hosts in Naega-myeon based on the number of properties managed and estimated total revenue over the past year. Analyze their scale and performance metrics.
| Host Name | Properties | Grossing Revenue | Stay Reviews | Avg Rating |
|---|---|---|---|---|
| UrbantageCamp | 23 | $128,069 | 2 | Not Rated |
| Host #449483324 | 1 | $15,349 | 0 | Not Rated |
| Host #315751385 | 1 | $4,549 | 0 | Not Rated |
| Host #545556867 | 1 | $2,507 | 1 | Not Rated |
Analyzing the strategies of top hosts, such as their property selection, pricing, and guest communication, can offer valuable lessons for optimizing your own Airbnb operations in Naega-myeon.
How Does Naega-myeon's Airbnb Market Compare to Nearby Cities?
How does the Naega-myeon Airbnb market stack up against its neighbors? Compare key performance metrics like average monthly revenue, ADR, and occupancy rates in surrounding areas to understand the broader regional STR landscape.
Compared with Wondeok-ri, Naega-myeon has 17 percentage points lower occupancy and about $56 lower ADR. That helps frame whether this market is winning more on demand, pricing, or both.
| Market | Active Properties | Monthly Revenue | Daily Rate | Avg. Occupancy |
|---|---|---|---|---|
| Wondeok-ri | 13 | $2,237 | $202.05 | 38% |
| Seorak-myeon | 11 | $1,842 | $185.73 | 34% |
| Homyeong-ri | 32 | $1,832 | $286.02 | 25% |
| Dojang-ri | 12 | $1,785 | $194.17 | 31% |
| Mugan-ri | 15 | $1,749 | $217.46 | 24% |
| Seorak | 11 | $1,669 | $205.64 | 29% |
| Yangpyeong-gun | 14 | $1,360 | $246.73 | 27% |
| Seojong | 19 | $1,350 | $193.83 | 25% |
| Yangju | 36 | $1,333 | $214.64 | 25% |
| Bokjang-ri | 40 | $1,236 | $218.28 | 19% |
Frequently Asked Questions About Airbnb in Naega-myeon
These quick answers summarize the most common investor and operator questions using AirROI's latest market data for Naega-myeon.
How much do Airbnb hosts make in Naega-myeon?
Naega-myeon hosts earn about $5,787 per year on average, with an average nightly rate of $146 and RevPAR of N/A. Those figures describe the typical revenue environment for active listings in Naega-myeon, Ganghwa-gun, not the ceiling for the best operators. Source: AirROI 2025 data, Naega-myeon market, June 2024 to May 2025.
What is the average Airbnb occupancy rate in Naega-myeon?
The average Airbnb occupancy rate in Naega-myeon is 20.8%. March is the strongest month and November is the softest, so hosts should expect demand to move meaningfully throughout the year rather than stay flat.
What is the average Airbnb daily rate in Naega-myeon?
Listings in Naega-myeon average $146 per night. The broader pricing spread also matters: lower-performing listings cluster closer to the lower quartiles, while premium homes can price materially above the city average when demand spikes or listing quality stands out.
How many Airbnb listings are active in Naega-myeon?
Naega-myeon currently has about 26 active Airbnb listings in AirROI's market dataset. That supply count helps explain how competitive the market is, how much depth there is for benchmarking, and whether the market behaves like a niche destination or a scaled urban market.
How strict are short-term rental regulations in Naega-myeon?
AirROI currently classifies the short-term rental regulation level in Naega-myeon as High. The dataset also shows about 57.7% of listings with registration evidence. That is a market signal, not legal advice, so hosts should still confirm current licensing and compliance rules locally before listing.
What is the RevPAR for Airbnb in Naega-myeon?
RevPAR in Naega-myeon is about N/A. That metric combines pricing and occupancy into one efficiency number, so it is often a better quick benchmark than ADR alone when investors want to compare how well listings convert nightly rates into realized revenue.
Is Airbnb profitable in Naega-myeon?
Occupancy of 20.8% means Naega-myeon is a more selective market. Profitability is achievable but requires careful cost management, premium positioning, or targeting longer stays to reduce turnover. Average annual revenue is $5,787, but individual returns depend on property type, location within the city, and the host's operating efficiency.
How far in advance do guests book Airbnb in Naega-myeon?
The average booking lead time in Naega-myeon is about 14 days — a relatively short booking window, meaning most guests decide within a few weeks of their trip — dynamic pricing can capture late demand. Hosts who understand their market's booking cadence can adjust minimum stays and pricing windows accordingly.
What are the best neighborhoods for Airbnb in Naega-myeon?
Based on AirROI's analysis, some of the top neighborhoods for short-term rentals in Naega-myeon include Ganghwa Island, Sindu-ri Beach, Haeinsa Temple. Each area attracts different guest profiles — from business travelers to leisure visitors — so the best location depends on the property type and target audience a host is aiming for. See the full neighborhood breakdown above.
What type of property performs best on Airbnb in Naega-myeon?
entire_home listings make up 96.2% of the active supply in Naega-myeon. The most common configuration does not always mean the most profitable — operators who identify underserved property types or bedroom counts can sometimes outperform the market average by filling a gap in local supply.
How does Naega-myeon compare to nearby Airbnb markets?
Among neighboring markets, Wondeok-ri posts $26,841 in average annual revenue with 37.6% occupancy, compared to Naega-myeon's $5,787 and 20.8%. Comparing nearby markets helps investors understand whether a destination's performance reflects local demand or broader regional trends.
When is the peak season for Airbnb in Naega-myeon?
March is the highest-revenue month in Naega-myeon, while November is the softest. The revenue spread between them indicates a highly seasonal market — revenue in the peak month is more than double the low month, so cash-flow planning and pricing automation are critical.
About AirROI Market Data
AirROI tracks over 20 million properties across 190+ countries and maintains 15+ years of historical performance data, making it one of the deepest Airbnb and STR intelligence platforms available. The analytics pipeline aggregates listing-level data monthly — revenue, occupancy, nightly rates, RevPAR, guest demographics, booking patterns, and competitive supply — so investors and operators can benchmark any market against its own history and against neighboring destinations.
Real estate investors, property managers, financial institutions, hedge funds, tourism boards, hospitality consultants, tech platforms, and academic researchers rely on AirROI data to underwrite acquisitions, optimize pricing, model macro trends, and conduct peer-reviewed research. Data is available through in-depth market reports like this one and the Airbnb API with 22 endpoints and an Airbnb MCP Server for AI agents.
AirROI proprietary analytics as of 2025-05-31. Metrics reflect trailing twelve-month aggregates from active listings. Revenue figures are market averages, not projections. Neighborhood descriptions are AI-generated and reviewed for accuracy. For full methodology, see the data methodology page.