Bangkok, Bangkok Airbnb Market Data 2025: STR Report & Statistics
How much can you earn on Airbnb in Bangkok, Bangkok? Based on AirROI's 2025 dataset (June 2024 – May 2025), the short answer is $7,443 per year — at a $71 nightly rate, 44.2% occupancy, and a N/A RevPAR.
Bangkok's 14,461 active listings and moderate demand with room for well-positioned listings to outperform make it a major short-term rental market. Supply grew 48.3% over the past year, yet revenue and nightly rates both trended upward — a signal that traveler demand is outpacing new inventory rather than being diluted by it. For hosts, pricing power remains intact even as competition increases.
Regulation is low, reducing the compliance barrier — though local ordinances should still be verified. The data points to a market where fundamentals reward execution — the right property, priced well, in the right neighborhood still outperforms.

Table of Contents [hide] [show]
What Are the Key Airbnb Metrics in Bangkok?
In Bangkok, the headline Airbnb metrics are $7,443 in average annual revenue,44.2% occupancy, $71 ADR, and $0 in RevPAR, and guests book about 29 days in advance.
How Much Do Airbnb Hosts Earn Monthly in Bangkok?
Understanding the monthly revenue variations for Airbnb listings in Bangkok is key to maximizing your short term rental income potential. Seasonality significantly impacts earnings. Our analysis, based on data from the past 12 months, shows that the peak revenue month for STRs in Bangkok is typically January, while June often presents the lowest earnings, highlighting opportunities for strategic pricing adjustments during shoulder and low seasons. Explore the typical Airbnb income in Bangkok across different performance tiers:
- Best-in-class properties (Top 10%) achieve $2,052+ monthly, often utilizing dynamic pricing and superior guest experiences.
- Strong performing properties (Top 25%) earn $1,166 or more, indicating effective management and desirable locations/amenities.
- Typical properties (Median) generate around $636 per month, representing the average market performance.
- Entry-level properties (Bottom 25%) see earnings around $290, often with potential for optimization.
Average Monthly Airbnb Earnings Trend in Bangkok
What Is the Monthly Airbnb Occupancy Rate in Bangkok?
Maximize your bookings by understanding the Bangkok STR occupancy trends. Seasonal demand shifts significantly influence how often properties are booked. Typically, Februarysees the highest demand (peak season occupancy), while May experiences the lowest (low season). Effective strategies, like adjusting minimum stays or offering promotions, can boost occupancy during slower periods. Here's how different property tiers perform in Bangkok:
- Best-in-class properties (Top 10%) achieve 89%+ occupancy, indicating high desirability and potentially optimized availability.
- Strong performing properties (Top 25%) maintain 75% or higher occupancy, suggesting good market fit and guest satisfaction.
- Typical properties (Median) have an occupancy rate around 46%.
- Entry-level properties (Bottom 25%) average 20% occupancy, potentially facing higher vacancy.
Average Monthly Occupancy Rate Trend in Bangkok
What Is the Average Airbnb Nightly Rate in Bangkok?
Effective short term rental pricing strategy in Bangkok involves understanding monthly ADR fluctuations. The Average Daily Rate (ADR) for Airbnb in Bangkok typically peaks in January and dips lowest during August. Leveraging Airbnb dynamic pricing tools or strategies based on this seasonality can significantly boost revenue. Here's a look at the typical nightly rates achieved:
- Best-in-class properties (Top 10%) command rates of $129+ per night, often due to premium features or locations.
- Strong performing properties (Top 25%) achieve nightly rates of $72 or more.
- Typical properties (Median) charge around $43 per night.
- Entry-level properties (Bottom 25%) earn around $28 per night.
Average Daily Rate (ADR) Trend by Month in Bangkok
What Is the RevPAR for Airbnb in Bangkok?
RevPAR in Bangkok is currently N/A. Because RevPAR combines nightly rates with realized occupancy, it is one of the cleanest ways to compare how efficiently listings turn demand into revenue across the market.
- Entry-level properties (Bottom 25%) see N/A RevPAR.
- Typical properties (Median) generate N/A RevPAR.
- Strong performers (Top 25%) earn N/A RevPAR.
- Best-in-class (Top 10%) achieve N/A RevPAR.
Average Monthly RevPAR Trend in Bangkok
RevPAR Insights for Bangkok
- RevPAR peaks in Jan and bottoms out in Jan, mirroring the broader seasonal demand pattern and suggesting opportunities for dynamic pricing.
Recommendations for Hosts
- Track your own RevPAR monthly against these Bangkok benchmarks. If your RevPAR falls below the median of N/A, examine whether low occupancy or low ADR is the primary drag.
- Use RevPAR rather than revenue alone when comparing properties of different sizes — it normalizes for available nights and gives a more accurate picture of performance.
Get Live Bangkok Market Intelligence 👇
Explore Real-time Analytics
When Is the Peak Season for Airbnb in Bangkok?
Bangkok's peak Airbnb season falls in January, February, December, while the softest stretch is May, June, September. Overall, the market shows moderate seasonality with distinct peak and low periods, which should guide pricing, minimum stays, and cash-flow planning.
Peak Season (January, February, December)
- Revenue averages $1,215 per month
- Occupancy rates average 55.7%
- Daily rates average $77
Shoulder Season
- Revenue averages $956 per month
- Occupancy maintains around 47.6%
- Daily rates hold near $72
Low Season (May, June, September)
- Revenue drops to average $758 per month
- Occupancy decreases to average 39.5%
- Daily rates adjust to average $71
Seasonality Insights for Bangkok
- The Airbnb seasonality pattern in Bangkok shows moderate seasonality with distinct peak and low periods. While the sections above show seasonal averages, it is also insightful to look at the extremes:
- During the high season, the absolute peak month showcases Bangkok's highest earning potential, with monthly revenues climbing to $1,320, occupancy reaching 56.4%, and ADRs peaking at $80.
- Conversely, the slowest single month marks the market's lowest point — revenue may dip to $676, occupancy could drop to 34.8%, and ADRs may adjust to $67.
- Understanding both the seasonal averages and these monthly peaks and troughs in revenue, occupancy, and ADR is crucial for maximizing your Airbnb profit potential in Bangkok.
Seasonal Strategies for Maximizing Profit
- Peak Season: Maximize revenue through premium pricing and potentially longer minimum stays. Ensure high availability and consider tightening cancellation policies to reduce last-minute gaps.
- Low Season: Offer competitive pricing, extended-stay discounts, and flexible cancellation policies. Target off-season travelers like remote workers, budget-conscious guests, and travelers with flexible schedules.
- Shoulder Seasons: Implement dynamic pricing that bridges peak and low rates. Target weekend travelers, local events, and business visitors. Slightly more flexible terms than peak season can help maintain occupancy without deep discounting.
- Regularly analyze your own performance against these Bangkok seasonality benchmarks and adjust your pricing and availability strategy accordingly.
Do You Need a License for Airbnb in Bangkok?
Bangkok, Bangkok, Thailand currently shows a low regulation profile despite having 14,461 active listings. Larger markets with light regulation can attract new supply quickly, but that also means regulatory frameworks may evolve as local governments respond to growth — staying informed protects your investment. Always verify the latest short-term rental regulations and Airbnb license requirements directly with local government authorities for Bangkok to ensure full compliance before hosting.
(Source: AirROI data, 2026, based on 7% licensed listings)
What Are the Best Neighborhoods for Airbnb in Bangkok?
Bangkok is a large short-term rental market, and performance varies significantly by location within the city. The neighborhoods below are among the most active areas for Airbnb hosts — each with distinct guest demographics, demand drivers, and local attractions. Use this as a starting point for neighborhood-level investment analysis in Bangkok, Bangkok.
| Neighborhood / Area | Why Host Here? (Target Guests & Appeal) | Key Attractions & Landmarks |
|---|---|---|
| Sukhumvit | A bustling area known for its shopping, dining, and vibrant nightlife. It attracts both expats and tourists looking for convenience and variety. | Terminal 21, EmQuartier, Soi Cowboy, Benjasiri Park, Nana Plaza, BTS Skytrain |
| Khao San Road | Famous among backpackers and budget travelers, Khao San Road is filled with cheap accommodation, street food, and a lively atmosphere. | Khao San Road, Wat Chana Songkhram, Rambuttri Road, The National Museum, Street Food Stalls, Bars and Clubs |
| Silom | Silom is Bangkok's business district but also offers vibrant nightlife and local attractions. It's a blend of corporate and culture. | Lumpini Park, Patpong Night Market, Bangkokian Museum, Silom Complex Shopping Mall, Sky Bar, BTS Skytrain |
| Chinatown | Known for its rich history and delicious street food, Chinatown offers a unique cultural experience and attracts food enthusiasts. | Yaowarat Road, Wat Traimit, Street Food Stalls, Chao Phraya River, Night Markets, Cultural Festivals |
| Riverside | Riverside areas offer scenic views and access to historical sites. It's a peaceful alternative to the busy city life. | Grand Palace, Wat Pho, Asiatique The Riverfront, Chao Phraya River, Riverside Dining, Temple of Dawn |
| Chatuchak | Home to the famous Chatuchak Weekend Market, this area attracts both tourists and locals for shopping and food. Ideal for budget travelers. | Chatuchak Weekend Market, Chatuchak Park, Museum of Contemporary Art, Boon Rawd Brewery, Or Tor Kor Market |
| Ari | A trendy neighborhood with a youthful vibe, perfect for those who enjoy hip cafes and restaurants. It's gaining popularity among the younger crowd. | Ari Soi 1, Bangkok Cycling Club, Hip Cafes, Community Parks, Art Galleries, Local Shops |
| Thonglor | Known for its upscale dining and nightlife, Thonglor attracts affluent locals and expats looking for a high-end lifestyle. | Thonglor Soi 10, J Avenue, Ekkamai Gateway, Sofitel Bangkok, Artbox Night Market, Trendy Bars |
With 8 distinct neighborhoods showing meaningful short-term rental activity, Bangkok offers diversification within a single market. Investors can tailor their strategy — from high-turnover tourist zones to quieter residential areas that attract longer stays and remote workers.
What Types of Properties Are on Airbnb in Bangkok?
Room Type Distribution
Property Type Distribution
Market Composition Insights for Bangkok
- The Bangkok Airbnb market composition is heavily skewed towards Entire Home/Apt listings, which make up 74.4% of the 14,461 active rentals. This indicates strong guest preference for privacy and space.
- Looking at the property type distribution in Bangkok, Apartment/Condo properties are the most common (76.6%), reflecting the local real estate landscape.
- The presence of 10.4% Hotel/Boutique listings indicates integration with traditional hospitality.
- Smaller segments like others, outdoor/unique, unique stays (combined 0.5%) offer potential for unique stay experiences.
Bangkok Airbnb Room Capacity Analysis (2026): Bedroom Distribution
Distribution of Listings by Number of Bedrooms
Room Capacity Insights for Bangkok
- The dominant room capacity in Bangkok is 1 bedroom listings, making up 62.9% of the market. This suggests a strong demand for properties suitable for couples or solo travelers.
- Together, 1 bedroom and 2 bedrooms properties represent 79.6% of the active Airbnb listings in Bangkok, indicating a high concentration in these sizes.
- With over half the market (62.9%) consisting of studios or 1-bedroom units, Bangkok is particularly well-suited for individuals or couples.
- Listings with 3+ bedrooms (9.0%) represent a smaller niche, potentially indicating an underserved market for larger group accommodations in Bangkok.
Bangkok Vacation Rental Guest Capacity Trends (2026)
Distribution of Listings by Guest Capacity
Guest Capacity Insights for Bangkok
- The most common guest capacity trend in Bangkok vacation rentals is listings accommodating 2 guests (48.7%). This suggests the primary traveler segment is likely couples or solo travelers.
- Properties designed for 2 guests and 4 guests dominate the Bangkok STR market, accounting for 63.5% of listings.
- A significant 50.1% of listings cater specifically to 1-2 guests, highlighting strong demand from couples and solo travelers in Bangkok.
- 12.1% of properties accommodate 6+ guests, serving the market segment for larger families or group travel in Bangkok.
- On average, properties in Bangkok are equipped to host 2.9 guests.
What Amenities Do Airbnb Guests Expect in Bangkok?
Amenity Prevalence
Amenity Insights for Bangkok
- Essential amenities in Bangkok that guests expect include: Air conditioning, Wifi. Lacking these (any) could significantly impact bookings.
- Popular amenities like TV, Washer, Essentials are common but not universal. Offering these can provide a competitive edge.
Recommendations for Hosts
- Ensure your listing includes all essential amenities for Bangkok: Air conditioning, Wifi.
- Prioritize adding missing essentials: Air conditioning, Wifi.
- Consider adding popular differentiators like TV or Washer to increase appeal.
- Highlight unique or less common amenities you offer (e.g., hot tub, dedicated workspace, EV charger) in your listing description and photos.
- Regularly check competitor amenities in Bangkok to stay competitive.
Dive Deeper: Advanced Bangkok STR Market Data (2026)
Ready to unlock more insights? AirROI provides access to advanced metrics and comprehensive Airbnb data for Bangkok. Explore detailed analytics beyond this report to refine your investment strategy, optimize pricing, and maximize your vacation rental profits.
Explore Advanced MetricsBangkok Airbnb Guest Demographics & Profile Analysis (2026)
Guest Profile Summary for Bangkok
- The typical guest profile for Airbnb in Bangkok consists of predominantly international visitors (97%), with top international origins including United Kingdom, typically belonging to the Post-2000s (Gen Z/Alpha) group (50%), primarily speaking English or Chinese.
- Domestic travelers account for 3.5% of guests.
- Key international markets include United States (16.7%) and United Kingdom (7.3%).
- Top languages spoken are English (46.3%) followed by Chinese (8.6%).
- A significant demographic segment is the Post-2000s (Gen Z/Alpha) group, representing 50% of guests.
Recommendations for Hosts
- Focus marketing internationally, particularly towards travelers from United Kingdom.
- Tailor amenities and listing descriptions to appeal to the dominant Post-2000s (Gen Z/Alpha) demographic (e.g., highlight fast WiFi, smart home features, local guides).
- Highlight unique local experiences or amenities relevant to the primary guest profile.
- Consider seasonal promotions aligned with peak travel times for key origin markets.
Bangkok Airbnb Booking Patterns (2026): Available vs. Booked Days
Available Days Distribution
Booked Days Distribution
Booking Pattern Insights for Bangkok
- The most common availability pattern in Bangkok falls within the 271-366 days range, representing 48.6% of listings. This suggests many properties have significant open periods on their calendars.
- Approximately 74.3% of listings show high availability (181+ days open annually), indicating potential for increased bookings or specific owner usage patterns.
- For booked days, the 91-180 days range is most frequent in Bangkok (26.2%), reflecting common guest stay durations or potential owner blocking patterns.
- A notable 26.5% of properties secure long booking periods (181+ days booked per year), highlighting successful long-term rental strategies or significant owner usage.
How Far in Advance Do Guests Book Airbnb in Bangkok?
Average Booking Lead Time by Month
Booking Lead Time Insights for Bangkok
- The overall average booking lead time for vacation rentals in Bangkok is 29 days.
- Guests book furthest in advance for stays during January (average 41 days), likely coinciding with peak travel demand or local events.
- The shortest booking windows occur for stays in July (average 20 days), indicating more last-minute travel plans during this time.
- Seasonally, Winter (40 days avg.) sees the longest lead times, while Summer (26 days avg.) has the shortest, reflecting typical travel planning cycles.
Recommendations for Hosts
- Use the overall average lead time (29 days) as a baseline for your pricing and availability strategy in Bangkok.
- For January stays, consider implementing length-of-stay discounts or slightly higher rates for bookings made less than 41 days out to capitalize on advance planning.
- Target marketing efforts for the Winter season well in advance (at least 40 days) to capture early planners.
- Monitor your own booking lead times against these Bangkok averages to identify opportunities for dynamic pricing adjustments.
Bangkok Airbnb Minimum Stay Requirements Analysis
Distribution of Listings by Minimum Night Requirement
1 Night
5249 listings
37.6% of total
2 Nights
1316 listings
9.4% of total
3 Nights
540 listings
3.9% of total
4-6 Nights
950 listings
6.8% of total
7-29 Nights
3303 listings
23.7% of total
30+ Nights
2595 listings
18.6% of total
Key Insights
- The most prevalent minimum stay requirement in Bangkok is 1 Night, adopted by 37.6% of listings. This highlights the market's preference for shorter, flexible bookings.
- A significant segment (18.6%) caters to monthly stays (30+ nights) in Bangkok, pointing to opportunities in the extended-stay market.
Recommendations
- Align with the market by considering a 1 Night minimum stay, as 37.6% of Bangkok hosts use this setting.
- Explore offering discounts for stays of 30+ nights to attract the 18.6% of the market seeking extended stays.
- Adjust minimum nights based on seasonality – potentially shorter during low season and longer during peak demand periods in Bangkok.
Bangkok Airbnb Cancellation Policy Trends Analysis (2026)
Super Strict 30 Days
3 listings
0% of total
Refundable
7 listings
0.1% of total
Super Strict 60 Days
1 listings
0% of total
Non-refundable
2 listings
0% of total
Long Term
1 listings
0% of total
Flexible
2950 listings
23.9% of total
Moderate
3030 listings
24.5% of total
Firm
2312 listings
18.7% of total
Strict
4057 listings
32.8% of total
Cancellation Policy Insights for Bangkok
- The prevailing Airbnb cancellation policy trend in Bangkok is Strict, used by 32.8% of listings.
- A majority (51.5%) of hosts in Bangkok utilize Firm or Strict policies, indicating a market where hosts prioritize booking security.
Recommendations for Hosts
- Consider adopting a Strict policy to align with the 32.8% market standard in Bangkok.
- With 32.8% using Strict terms, this is a viable option in Bangkok, particularly for high-value properties or during peak demand periods.
- Regularly review your cancellation policy against competitors and market demand shifts in Bangkok.
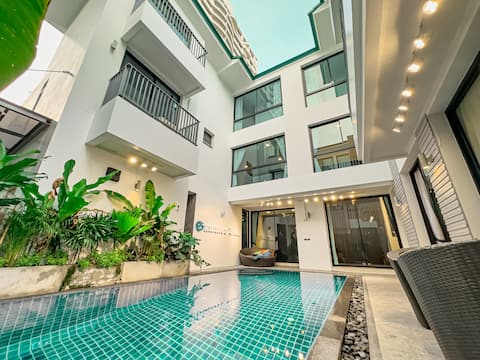
What Do the Top Airbnb Listings in Bangkok Look Like?
Benchmark your potential! Explore examples of top-performing Airbnb properties in Bangkokbased on Trailing Twelve Month (TTM) revenue. Analyze their characteristics, revenue, occupancy rate, and ADR to understand what drives success in this market.
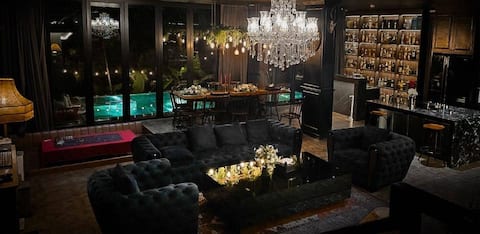
The Black Kingdom / 150m. from Mrt BangAor station
Entire Place • 4 bedrooms

4BR Bangkok Home near Siam | Free Airport Transfer
Entire Place • 4 bedrooms

11 BedRooms. Luxury Villa Bangkok City Sukumvit
Entire Place • 11 bedrooms

Benviar-Ambassador Suite(550sqm)#6BRoom@Chitlom
Entire Place • 6 bedrooms
9 Seven Bedroom Single Pool Villa in the heart of Bangkok
Entire Place • 7 bedrooms

BtsPhrom phong 7 bedroom 7 bath Emquartier
Entire Place • 7 bedrooms
Note: Performance varies based on location, size, amenities, seasonality, and management quality. Data reflects the past 12 months.
Who Are the Top Airbnb Hosts in Bangkok?
Learn from the best! This table showcases top-performing Airbnb hosts in Bangkok based on the number of properties managed and estimated total revenue over the past year. Analyze their scale and performance metrics.
| Host Name | Properties | Grossing Revenue | Stay Reviews | Avg Rating |
|---|---|---|---|---|
| LeFoyer | 113 | $1,252,878 | 1200 | 4.67/5.0 |
| Ndee | 39 | $1,084,731 | 3189 | 4.81/5.0 |
| Mike | 78 | $1,039,145 | 2547 | 4.67/5.0 |
| U Home | 72 | $934,002 | 2680 | 4.75/5.0 |
| Benjamin | 7 | $724,230 | 1692 | 4.80/5.0 |
| Mary | 26 | $714,320 | 556 | 4.95/5.0 |
| Max | 92 | $704,763 | 3397 | 4.71/5.0 |
| Dr. Supot | 22 | $675,799 | 2079 | 4.88/5.0 |
| Shin | 57 | $647,957 | 5216 | 4.84/5.0 |
| Ed | 42 | $600,363 | 3271 | 4.73/5.0 |
Analyzing the strategies of top hosts, such as their property selection, pricing, and guest communication, can offer valuable lessons for optimizing your own Airbnb operations in Bangkok.
How Does Bangkok's Airbnb Market Compare to Nearby Cities?
How does the Bangkok Airbnb market stack up against its neighbors? Compare key performance metrics like average monthly revenue, ADR, and occupancy rates in surrounding areas to understand the broader regional STR landscape.
Compared with Ban Nong Hiang, Bangkok has 6 percentage points higher occupancy and about $146 lower ADR. That helps frame whether this market is winning more on demand, pricing, or both.
| Market | Active Properties | Monthly Revenue | Daily Rate | Avg. Occupancy |
|---|---|---|---|---|
| Bang Kao | 15 | $1,904 | $345.68 | 18% |
| Hat Chao Samran | 15 | $1,642 | $497.94 | 21% |
| Erawan | 11 | $1,556 | $217.18 | 25% |
| Ban Nong Hiang | 53 | $1,445 | $217.15 | 38% |
| Huai Yai | 56 | $1,424 | $391.85 | 26% |
| Na Chom Thian | 201 | $1,384 | $256.74 | 31% |
| Pattaya | 232 | $1,272 | $266.64 | 31% |
| Ban Nong Bua | 39 | $1,166 | $199.04 | 29% |
| Tambon Hua Hin | 19 | $1,115 | $168.58 | 37% |
| Wang Sai | 13 | $1,035 | $303.71 | 20% |
Frequently Asked Questions About Airbnb in Bangkok
These quick answers summarize the most common investor and operator questions using AirROI's latest market data for Bangkok.
How much do Airbnb hosts make in Bangkok?
Bangkok hosts earn about $7,443 per year on average, with an average nightly rate of $71 and RevPAR of N/A. Those figures describe the typical revenue environment for active listings in Bangkok, Bangkok, not the ceiling for the best operators. Source: AirROI 2025 data, Bangkok market, June 2024 to May 2025.
What is the average Airbnb occupancy rate in Bangkok?
The average Airbnb occupancy rate in Bangkok is 44.2%. January is the strongest month and June is the softest, so hosts should expect demand to move meaningfully throughout the year rather than stay flat.
What is the average Airbnb daily rate in Bangkok?
Listings in Bangkok average $71 per night. The broader pricing spread also matters: lower-performing listings cluster closer to the lower quartiles, while premium homes can price materially above the city average when demand spikes or listing quality stands out.
How many Airbnb listings are active in Bangkok?
Bangkok currently has about 14,461 active Airbnb listings in AirROI's market dataset. That supply count helps explain how competitive the market is, how much depth there is for benchmarking, and whether the market behaves like a niche destination or a scaled urban market.
How strict are short-term rental regulations in Bangkok?
AirROI currently classifies the short-term rental regulation level in Bangkok as Low. The dataset also shows about 6.6% of listings with registration evidence. That is a market signal, not legal advice, so hosts should still confirm current licensing and compliance rules locally before listing.
What is the RevPAR for Airbnb in Bangkok?
RevPAR in Bangkok is about N/A. That metric combines pricing and occupancy into one efficiency number, so it is often a better quick benchmark than ADR alone when investors want to compare how well listings convert nightly rates into realized revenue.
Is Airbnb profitable in Bangkok?
At 44.2% occupancy, Bangkok can be profitable — but margins depend heavily on operating costs, property acquisition price, and how well hosts optimize pricing across seasons. Average annual revenue is $7,443, but individual returns depend on property type, location within the city, and the host's operating efficiency.
How far in advance do guests book Airbnb in Bangkok?
The average booking lead time in Bangkok is about 29 days — a moderate lead time that gives hosts planning visibility while still benefiting from last-minute bookings. Hosts who understand their market's booking cadence can adjust minimum stays and pricing windows accordingly.
What are the best neighborhoods for Airbnb in Bangkok?
Based on AirROI's analysis, some of the top neighborhoods for short-term rentals in Bangkok include Sukhumvit, Khao San Road, Silom. Each area attracts different guest profiles — from business travelers to leisure visitors — so the best location depends on the property type and target audience a host is aiming for. See the full neighborhood breakdown above.
What type of property performs best on Airbnb in Bangkok?
entire_home listings make up 74.4% of the active supply in Bangkok. The most common configuration does not always mean the most profitable — operators who identify underserved property types or bedroom counts can sometimes outperform the market average by filling a gap in local supply.
How does Bangkok compare to nearby Airbnb markets?
Among neighboring markets, Bang Kao posts $22,842 in average annual revenue with 18.1% occupancy, compared to Bangkok's $7,443 and 44.2%. Comparing nearby markets helps investors understand whether a destination's performance reflects local demand or broader regional trends.
When is the peak season for Airbnb in Bangkok?
January is the highest-revenue month in Bangkok, while June is the softest. The revenue spread between them indicates moderate seasonality with a clear peak period, giving hosts opportunities to maximize rates during high demand without facing dramatic off-season drops.
About AirROI Market Data
AirROI tracks over 20 million properties across 190+ countries and maintains 15+ years of historical performance data, making it one of the deepest Airbnb and STR intelligence platforms available. The analytics pipeline aggregates listing-level data monthly — revenue, occupancy, nightly rates, RevPAR, guest demographics, booking patterns, and competitive supply — so investors and operators can benchmark any market against its own history and against neighboring destinations.
Real estate investors, property managers, financial institutions, hedge funds, tourism boards, hospitality consultants, tech platforms, and academic researchers rely on AirROI data to underwrite acquisitions, optimize pricing, model macro trends, and conduct peer-reviewed research. Data is available through in-depth market reports like this one and the Airbnb API with 22 endpoints and an Airbnb MCP Server for AI agents.
AirROI proprietary analytics as of 2025-05-31. Metrics reflect trailing twelve-month aggregates from active listings. Revenue figures are market averages, not projections. Neighborhood descriptions are AI-generated and reviewed for accuracy. For full methodology, see the data methodology page.