Kapaʻa, Hawaii Airbnb Market Data 2026: STR Report & Statistics
How much can you earn on Airbnb in Kapaʻa, Hawaii? Based on AirROI's 2026 dataset (July 2025 – June 2026), the short answer is $63,531 per year — at a $369 nightly rate, 56.2% occupancy, and a $209 RevPAR that reflects moderate rate-to-revenue efficiency with room to optimize.
With just 49 active listings, Kapaʻa is a micro-market where solid booking activity throughout the year. Supply grew 444.4% year over year, and the market is recalibrating around a new competitive baseline. This is the stage where hosts who invest in amenities, guest experience, and dynamic pricing build durable advantages that compound as the market matures.
Regulation is high and 96% of listings show active registration — compliance is the cost of entry. In a market this size, differentiated listings with strong reviews can capture outsized returns relative to the competition.
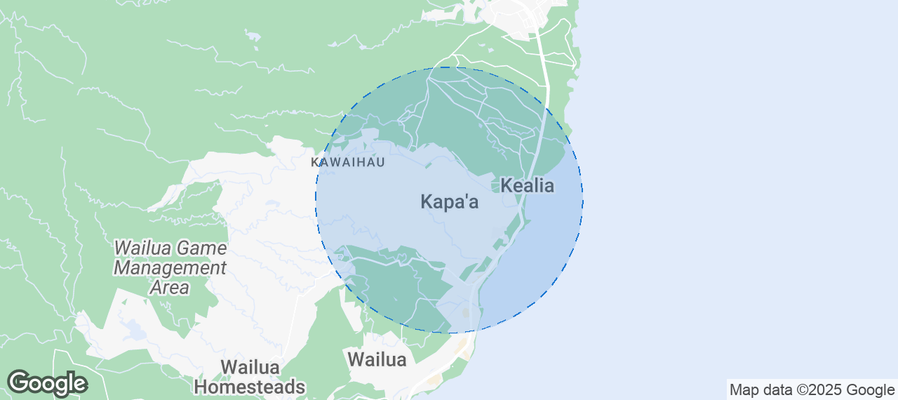
Table of Contents [hide] [show]
What Are the Key Airbnb Metrics in Kapaʻa?
In Kapaʻa, the headline Airbnb metrics are $63,531 in average annual revenue,56.2% occupancy, $369 ADR, and $209 in RevPAR, and guests book about 79 days in advance.
How Much Do Airbnb Hosts Earn Monthly in Kapaʻa?
Understanding the monthly revenue variations for Airbnb listings in Kapaʻa is key to maximizing your short term rental income potential. Seasonality significantly impacts earnings. Our analysis, based on data from the past 12 months, shows that the peak revenue month for STRs in Kapaʻa is typically March, while June often presents the lowest earnings, highlighting opportunities for strategic pricing adjustments during shoulder and low seasons. Explore the typical Airbnb income in Kapaʻa across different performance tiers:
- Best-in-class properties (Top 10%) achieve $10,887+ monthly, often utilizing dynamic pricing and superior guest experiences.
- Strong performing properties (Top 25%) earn $7,654 or more, indicating effective management and desirable locations/amenities.
- Typical properties (Median) generate around $5,435 per month, representing the average market performance.
- Entry-level properties (Bottom 25%) see earnings around $4,017, often with potential for optimization.
Average Monthly Airbnb Earnings Trend in Kapaʻa
What Is the Monthly Airbnb Occupancy Rate in Kapaʻa?
Maximize your bookings by understanding the Kapaʻa STR occupancy trends. Seasonal demand shifts significantly influence how often properties are booked. Typically, Februarysees the highest demand (peak season occupancy), while June experiences the lowest (low season). Effective strategies, like adjusting minimum stays or offering promotions, can boost occupancy during slower periods. Here's how different property tiers perform in Kapaʻa:
- Best-in-class properties (Top 10%) achieve 87%+ occupancy, indicating high desirability and potentially optimized availability.
- Strong performing properties (Top 25%) maintain 77% or higher occupancy, suggesting good market fit and guest satisfaction.
- Typical properties (Median) have an occupancy rate around 64%.
- Entry-level properties (Bottom 25%) average 45% occupancy, potentially facing higher vacancy.
Average Monthly Occupancy Rate Trend in Kapaʻa
What Is the Average Airbnb Nightly Rate in Kapaʻa?
Effective short term rental pricing strategy in Kapaʻa involves understanding monthly ADR fluctuations. The Average Daily Rate (ADR) for Airbnb in Kapaʻa typically peaks in February and dips lowest during August. Leveraging Airbnb dynamic pricing tools or strategies based on this seasonality can significantly boost revenue. Here's a look at the typical nightly rates achieved:
- Best-in-class properties (Top 10%) command rates of $624+ per night, often due to premium features or locations.
- Strong performing properties (Top 25%) achieve nightly rates of $396 or more.
- Typical properties (Median) charge around $305 per night.
- Entry-level properties (Bottom 25%) earn around $241 per night.
Average Daily Rate (ADR) Trend by Month in Kapaʻa
What Is the RevPAR for Airbnb in Kapaʻa?
RevPAR in Kapaʻa is currently $209. Because RevPAR combines nightly rates with realized occupancy, it is one of the cleanest ways to compare how efficiently listings turn demand into revenue across the market.
- Entry-level properties (Bottom 25%) see $132 RevPAR.
- Typical properties (Median) generate $166 RevPAR.
- Strong performers (Top 25%) earn $229 RevPAR.
- Best-in-class (Top 10%) achieve $348 RevPAR.
Average Monthly RevPAR Trend in Kapaʻa
RevPAR Insights for Kapaʻa
- The average RevPAR in Kapaʻa is $209. This metric combines nightly rates with realized occupancy, making it one of the best single-number indicators of market efficiency.
- The gap between the top 10% ($348) and bottom 25% ($132) is $216, indicating significant performance disparity driven by property quality, pricing strategy, and location.
- RevPAR peaks in Mar and bottoms out in Jun, mirroring the broader seasonal demand pattern and suggesting opportunities for dynamic pricing.
Recommendations for Hosts
- Track your own RevPAR monthly against these Kapaʻa benchmarks. If your RevPAR falls below the median of $166, examine whether low occupancy or low ADR is the primary drag.
- Top-quartile listings achieve $229+ RevPAR through a combination of competitive pricing, strong reviews, and strategic amenities. Target this tier through incremental improvements.
- Use RevPAR rather than revenue alone when comparing properties of different sizes — it normalizes for available nights and gives a more accurate picture of performance.
Get Live Kapaʻa Market Intelligence 👇
Explore Real-time Analytics
When Is the Peak Season for Airbnb in Kapaʻa?
Kapaʻa's peak Airbnb season falls in March, February, January, while the softest stretch is June, August, November. Overall, the market shows highly seasonal trends requiring careful strategy, which should guide pricing, minimum stays, and cash-flow planning.
Peak Season (March, February, January)
- Revenue averages $8,561 per month
- Occupancy rates average 73.1%
- Daily rates average $394
Shoulder Season
- Revenue averages $5,937 per month
- Occupancy maintains around 57.1%
- Daily rates hold near $360
Low Season (June, August, November)
- Revenue drops to average $5,121 per month
- Occupancy decreases to average 51.7%
- Daily rates adjust to average $361
Seasonality Insights for Kapaʻa
- Airbnb seasonality in Kapaʻa is pronounced. Revenue swings sharply between peak and low months, which means pricing strategy, minimum-stay settings, and cash reserves all need to account for extended slower periods.
- During the high season, the absolute peak month showcases Kapaʻa's highest earning potential, with monthly revenues climbing to $9,549, occupancy reaching 73.9%, and ADRs peaking at $409.
- Conversely, the slowest single month marks the market's lowest point — revenue may dip to $4,651, occupancy could drop to 42.4%, and ADRs may adjust to $337.
- Understanding both the seasonal averages and these monthly peaks and troughs in revenue, occupancy, and ADR is crucial for maximizing your Airbnb profit potential in Kapaʻa.
Seasonal Strategies for Maximizing Profit
- Peak Season: Maximize revenue through premium pricing. In a high-regulation market like Kapaʻa, ensure your permit covers the number of nights you plan to book — some jurisdictions cap annual rental days.
- Low Season: Even in a market with solid annual occupancy, the slower months benefit from competitive pricing and flexible check-in/check-out windows. Target remote workers and extended-stay travelers who value value over peak-season amenities.
- Shoulder Seasons: Implement dynamic pricing that bridges peak and low rates. Target weekend travelers, local events, and business visitors. Slightly more flexible terms than peak season can help maintain occupancy without deep discounting.
- In a highly seasonal market like Kapaʻa, building a cash reserve during the top months is essential for covering fixed costs during the slow period. Automated pricing tools can help capture demand shifts in real time.
Do You Need a License for Airbnb in Kapaʻa?
Yes, Kapaʻa, Hawaii, United States enforces high STR regulations and 96% of active listings show registration evidence — indicating that enforcement is active and compliance is a prerequisite for operating legally. Hosts entering this market should budget for permit fees, inspections, and potential occupancy tax obligations as part of their startup costs. Always verify the latest short-term rental regulations and Airbnb license requirements directly with local government authorities for Kapaʻa to ensure full compliance before hosting.
(Source: AirROI data, 2026, based on 96% licensed listings)
What Are the Best Neighborhoods for Airbnb in Kapaʻa?
With a compact short-term rental market, Kapaʻa gives early-mover hosts an advantage in the right neighborhoods. The areas listed below are where guest demand and local attractions converge — a useful lens for investors evaluating whether to enter this market and where to position their listing.
| Neighborhood / Area | Why Host Here? (Target Guests & Appeal) | Key Attractions & Landmarks |
|---|---|---|
| Kapa'a Beach | A beautiful coastal area with direct access to stunning beaches, making it ideal for sun-seeking tourists. The beach vibe attracts families and couples looking for relaxation and water activities. | Kapa'a Beach Park, Nulu Spa & Wellness Center, Kapaa Shopping Center, Coconut Marketplace, Wailua Falls |
| Royal Coconut Coast | This area combines lush landscapes with beachfront accommodation, making it perfect for tourists seeking adventure activities and stunning views. | Lydgate Beach Park, Kamokila Hawaiian Village, Kealia Beach, Wailua River Kayaking, Sleeping Giant Trail |
| Kapa'a Town | A charming, historic town with local shops, cafes, and a vibrant art scene that attracts visitors looking for an authentic Hawaiian experience. | Kapa'a Town Park, Kauai Village Shopping Center, Local art galleries, Food trucks and local eateries |
| Opaekaa Falls | A stunning waterfall location offering breathtaking views, a popular attraction for visitors seeking natural beauty and outdoor activities. | Opaekaa Falls, Opaekaa Falls Viewpoint, Scenic hiking trails |
| Wailua Beach | Known for its water sports and beautiful views, this beach area is popular with tourists engaged in surfing, snorkeling, and beach relaxation. | Wailua Beach, Wailua River, Kayaking and paddleboarding tours |
| Moloa'a Bay | A secluded beach with lush surroundings ideal for visitors wanting privacy and closeness to nature, making it great for romantic getaways. | Moloa'a Bay Beach, Hiking trails, Nearby cottages and local eateries |
| Anini Beach | Famous for its calm waters, this area is great for families and provides a variety of water activities, attracting tourists looking for family-friendly options. | Anini Beach, Snorkeling opportunities, Picnic areas and camping spots |
| Haena State Park | A breathtaking natural park known for its stunning scenery and hiking destinations, perfect for adventurous travelers looking to explore Hawaii's natural beauty. | Na Pali Coast, Ke'e Beach, Tunnels Beach, Hiking to Hanakapiai Falls |
Because Kapaʻa has a high regulation profile, confirming that short-term rental permits are available in your target neighborhood is a critical first step before committing to a property purchase. Regulation can vary at the neighborhood or district level even within the same city.
What Types of Properties Are on Airbnb in Kapaʻa?
Room Type Distribution
Property Type Distribution
Market Composition Insights for Kapaʻa
- The Kapaʻa Airbnb market composition is heavily skewed towards Entire Home/Apt listings, which make up 100% of the 49 active rentals. This indicates strong guest preference for privacy and space.
- Looking at the property type distribution in Kapaʻa, Apartment/Condo properties are the most common (95.9%), reflecting the local real estate landscape.
- Smaller segments like house (combined 4.1%) offer potential for unique stay experiences.
Kapaʻa Airbnb Room Capacity Analysis (2026): Bedroom Distribution
Distribution of Listings by Number of Bedrooms
Room Capacity Insights for Kapaʻa
- The dominant room capacity in Kapaʻa is 1 bedroom listings, making up 69.4% of the market. This suggests a strong demand for properties suitable for couples or solo travelers.
- Together, 1 bedroom and 2 bedrooms properties represent 89.8% of the active Airbnb listings in Kapaʻa, indicating a high concentration in these sizes.
- With over half the market (69.4%) consisting of studios or 1-bedroom units, Kapaʻa is particularly well-suited for individuals or couples.
Kapaʻa Vacation Rental Guest Capacity Trends (2026)
Distribution of Listings by Guest Capacity
Guest Capacity Insights for Kapaʻa
- The most common guest capacity trend in Kapaʻa vacation rentals is listings accommodating 4 guests (51%). This suggests the primary traveler segment is likely small families or groups.
- Properties designed for 4 guests and 2 guests dominate the Kapaʻa STR market, accounting for 73.4% of listings.
- 20.4% of properties accommodate 6+ guests, serving the market segment for larger families or group travel in Kapaʻa.
- On average, properties in Kapaʻa are equipped to host 3.9 guests.
How Do Listings in Kapaʻa Compare on Quality?
Listing quality in Kapaʻa can be approximated through presentation depth, bedroom count, and how often hosts disclose exact locations. These signals show how professionally the local supply base is merchandised.
Listing Quality Insights for Kapaʻa
- At 43 photos per listing on average, Kapaʻa hosts invest well in visual presentation. Listings with 20+ photos consistently outperform in search ranking and conversion.
- 24.5% of listings show their exact location. Lower disclosure rates can increase booking hesitation — guests want to know exactly where they are staying.
Recommendations for Hosts
- Enable exact location if possible — it removes a common source of guest uncertainty and can improve your listing's position in map-based searches.
- Use these quality indicators as a self-audit checklist. Listings that exceed the Kapaʻa averages across all three metrics are better positioned for premium pricing.
What Amenities Do Airbnb Guests Expect in Kapaʻa?
Amenity Prevalence
Amenity Insights for Kapaʻa
- Essential amenities in Kapaʻa that guests expect include: TV, Coffee maker, Wifi, Hair dryer, Smoke alarm, Microwave. Lacking these (any) could significantly impact bookings.
- Popular amenities like Bed linens, Shampoo, Iron are common but not universal. Offering these can provide a competitive edge.
Recommendations for Hosts
- Ensure your listing includes all essential amenities for Kapaʻa: TV, Coffee maker, Wifi, Hair dryer, Smoke alarm, Microwave.
- Prioritize adding missing essentials: TV, Wifi, Hair dryer, Smoke alarm, Microwave.
- Consider adding popular differentiators like Bed linens or Shampoo to increase appeal.
- Highlight unique or less common amenities you offer (e.g., hot tub, dedicated workspace, EV charger) in your listing description and photos.
- Regularly check competitor amenities in Kapaʻa to stay competitive.
Which Airbnb Amenities Boost Revenue in Kapaʻa?
Not every amenity matters equally. This table focuses on the amenities most associated with higher revenue in Kapaʻa, which makes it more useful for prioritizing upgrades than a simple popularity list alone.
| Amenity | Prevalence | Revenue With | Revenue Without | Revenue Uplift |
|---|---|---|---|---|
Pack ’n play/Travel crib | 12.2% | $117,902 | $55,944 | 110.8% |
Ethernet connection | 10.2% | $118,967 | $57,231 | 107.9% |
Patio or balcony | 44.9% | $82,149 | $48,360 | 69.9% |
Heating | 10.2% | $99,396 | $59,455 | 67.2% |
Cooking basics | 67.3% | $73,056 | $43,884 | 66.5% |
Sun loungers | 16.3% | $94,514 | $57,485 | 64.4% |
Gym | 28.6% | $85,312 | $54,818 | 55.6% |
Self check-in | 75.5% | $69,447 | $45,287 | 53.3% |
Stove | 89.8% | $65,838 | $43,228 | 52.3% |
Waterfront | 20.4% | $87,139 | $57,477 | 51.6% |
Revenue Impact Insights for Kapaʻa
- Pack ’n play/Travel crib tops the revenue impact list with a 110.8% uplift — listings with this amenity earn $117,902 vs. $55,944 without it.
- Stove — while widespread — still correlate with meaningful revenue gains, making it table stakes rather than true differentiators.
Recommendations for Hosts
- Focus your upgrade budget on amenities in the top half of this table. Below-median amenities may improve guest experience but contribute less to revenue growth.
- Highlight revenue-impacting amenities prominently in your listing title, photos, and description — guests can't value what they don't notice.
Dive Deeper: Advanced Kapaʻa STR Market Data (2026)
Ready to unlock more insights? AirROI provides access to advanced metrics and comprehensive Airbnb data for Kapaʻa. Explore detailed analytics beyond this report to refine your investment strategy, optimize pricing, and maximize your vacation rental profits.
Explore Advanced MetricsKapaʻa Airbnb Guest Demographics & Profile Analysis (2026)
Guest Profile Summary for Kapaʻa
- The typical guest profile for Airbnb in Kapaʻa consists of primarily domestic travelers (87%), often arriving from nearby Seattle, typically belonging to the Post-2000s (Gen Z/Alpha) group (50%), primarily speaking English or Spanish.
- Domestic travelers account for 87.1% of guests.
- Key international markets include United States (87.1%) and Canada (3.1%).
- Top languages spoken are English (66.3%) followed by Spanish (13%).
- A significant demographic segment is the Post-2000s (Gen Z/Alpha) group, representing 50% of guests.
Recommendations for Hosts
- Target domestic marketing efforts towards travelers from Seattle and San Francisco.
- Tailor amenities and listing descriptions to appeal to the dominant Post-2000s (Gen Z/Alpha) demographic (e.g., highlight fast WiFi, smart home features, local guides).
- Highlight unique local experiences or amenities relevant to the primary guest profile.
- Consider seasonal promotions aligned with peak travel times for key origin markets.
What Are Airbnb Guest Ratings in Kapaʻa?
Listings in Kapaʻa average 4.79 out of 5 overall, with about 44.2 reviews per active listing and 34.7% of listings carrying the Guest Favorite badge.
Rating Breakdown by Category
Guest Rating Insights for Kapaʻa
- An average rating of 4.79 places Kapaʻa in solid territory. Most guests leave satisfied, though there is room for hosts to push toward the top tier.
- The strongest subcategory is Communication (4.89), while Value (4.68) trails behind — a useful signal for hosts looking to prioritize upgrades.
- 34.7% of listings carry the Guest Favorite badge, a strong trust signal that can meaningfully lift click-through and booking rates.
Recommendations for Hosts
- Focus improvement efforts on Value — even small gains in the weakest subcategory can lift overall ratings and search ranking.
- Encourage guests to leave reviews after checkout. Listings with more reviews rank higher in search results and convert browsers into bookers more effectively.
Kapaʻa Airbnb Booking Patterns (2026): Available vs. Booked Days
Available Days Distribution
Booked Days Distribution
Booking Pattern Insights for Kapaʻa
- The most common availability pattern in Kapaʻa falls within the 91-180 days range, representing 40.8% of listings. This suggests many properties have significant open periods on their calendars.
- Approximately 44.8% of listings show high availability (181+ days open annually), indicating potential for increased bookings or specific owner usage patterns.
- For booked days, the 181-270 days range is most frequent in Kapaʻa (40.8%), reflecting common guest stay durations or potential owner blocking patterns.
- A notable 55.1% of properties secure long booking periods (181+ days booked per year), highlighting successful long-term rental strategies or significant owner usage.
How Far in Advance Do Guests Book Airbnb in Kapaʻa?
Average Booking Lead Time by Month
Booking Lead Time Insights for Kapaʻa
- The overall average booking lead time for vacation rentals in Kapaʻa is 79 days.
- Guests book furthest in advance for stays during February (average 104 days), likely coinciding with peak travel demand or local events.
- The shortest booking windows occur for stays in July (average 47 days), indicating more last-minute travel plans during this time.
- Seasonally, Winter (92 days avg.) sees the longest lead times, while Summer (64 days avg.) has the shortest, reflecting typical travel planning cycles.
Recommendations for Hosts
- Use the overall average lead time (79 days) as a baseline for your pricing and availability strategy in Kapaʻa.
- For February stays, consider implementing length-of-stay discounts or slightly higher rates for bookings made less than 104 days out to capitalize on advance planning.
- Target marketing efforts for the Winter season well in advance (at least 92 days) to capture early planners.
- Monitor your own booking lead times against these Kapaʻa averages to identify opportunities for dynamic pricing adjustments.
What Is the Average Length of Stay for Airbnb in Kapaʻa?
Guests in Kapaʻa stay about 6.4 nights on average, generating roughly 1,431 reservations and 29.2 bookings per listing in the latest AirROI dataset. The most common check-in time is 3:00 PM and check-out is 10:00 AM.
Monthly Length of Stay in Kapaʻa
Check-in Time Distribution
Check-out Time Distribution
Stay Pattern Insights for Kapaʻa
- A mid-range stay length points to leisure-driven demand — weekend getaways and short vacations. Hosts should optimize for quick turnover efficiency while keeping the guest experience smooth.
- At 29.2 bookings per listing, the turnover rate is high. Hosts with streamlined operations (self-check-in, automated messaging, reliable cleaners) have a structural advantage.
- Stay lengths peak in Feb (7.8 nights) and shorten in Dec (5.4 nights). Adjust minimum-night requirements seasonally to match.
Recommendations for Hosts
- Leverage the longer-stay pattern by offering weekly discounts — even 5-10% off can convert browsing into bookings for guests considering an extended stay.
- Set your check-in time to match or beat the market standard of 3:00 PM. Offering early check-in flexibility can be a low-cost differentiator.
- Monitor length-of-stay seasonality to adjust minimum-night requirements — longer minimums during peak periods maximize revenue while shorter minimums fill gaps in shoulder seasons.
Kapaʻa Airbnb Minimum Stay Requirements Analysis
Distribution of Listings by Minimum Night Requirement
1 Night
4 listings
8.2% of total
2 Nights
13 listings
26.5% of total
3 Nights
5 listings
10.2% of total
4-6 Nights
4 listings
8.2% of total
7-29 Nights
1 listings
2% of total
30+ Nights
22 listings
44.9% of total
Key Insights
- The most prevalent minimum stay requirement in Kapaʻa is 30+ Nights, adopted by 44.9% of listings. This highlights the market's preference for longer commitments.
- A significant segment (44.9%) caters to monthly stays (30+ nights) in Kapaʻa, pointing to opportunities in the extended-stay market.
Recommendations
- Align with the market by considering a 30+ Nights minimum stay, as 44.9% of Kapaʻa hosts use this setting.
- If feasible, allowing 1-night stays, especially midweek or during low season, could capture last-minute bookings, as only 8.2% currently do.
- Explore offering discounts for stays of 30+ nights to attract the 44.9% of the market seeking extended stays.
- Adjust minimum nights based on seasonality – potentially shorter during low season and longer during peak demand periods in Kapaʻa.
Kapaʻa Airbnb Cancellation Policy Trends Analysis (2026)
Super Strict 60 Days
8 listings
16.3% of total
Super Strict 30 Days
1 listings
2% of total
Flexible
8 listings
16.3% of total
Moderate
9 listings
18.4% of total
Firm
21 listings
42.9% of total
Strict
2 listings
4.1% of total
Cancellation Policy Insights for Kapaʻa
- The prevailing Airbnb cancellation policy trend in Kapaʻa is Firm, used by 42.9% of listings.
- There's a relatively balanced mix between guest-friendly (34.7%) and stricter (47.0%) policies, offering choices for different guest needs.
- Strict cancellation policies are quite rare (4.1%), potentially making listings with this policy less competitive unless justified by high demand or property type.
Recommendations for Hosts
- Consider adopting a Firm policy to align with the 42.9% market standard in Kapaʻa.
- Using a Strict policy might deter some guests, as only 4.1% of listings use it. Evaluate if potential revenue protection outweighs possible lower booking rates.
- Regularly review your cancellation policy against competitors and market demand shifts in Kapaʻa.
How Much Are Airbnb Cleaning Fees in Kapaʻa?
Cleaning fees in Kapaʻa are meaningful operating levers, not just pass-through charges. What matters most is how often hosts charge them, how high they run relative to market norms, and how large a share of gross revenue they consume.
Cleaning Fee Insights for Kapaʻa
- 100.0% of listings charge a cleaning fee, making it standard practice in Kapaʻa. Guests expect it and factor it into their booking decisions.
- The gap between the average ($276) and median ($250) cleaning fee indicates some high-end properties are pulling the average up considerably.
- Cleaning fees represent 12.6% of gross revenue on average — a significant line item that impacts total guest cost and competitiveness.
Recommendations for Hosts
- Price your cleaning fee competitively against the Kapaʻa median of $250. Fees significantly above market norms can deter bookings, especially for shorter stays.
- Consider whether bundling the cleaning fee into a slightly higher nightly rate might improve conversion, since many guests filter by total price and separate fees can feel punitive.
- Monitor competitor cleaning fees regularly. Airbnb's search algorithm factors in total price, so a well-calibrated cleaning fee can improve your listing's ranking.
What Do the Top Airbnb Listings in Kapaʻa Look Like?
Benchmark your potential! Explore examples of top-performing Airbnb properties in Kapaʻabased on Trailing Twelve Month (TTM) revenue. Analyze their characteristics, revenue, occupancy rate, and ADR to understand what drives success in this market.
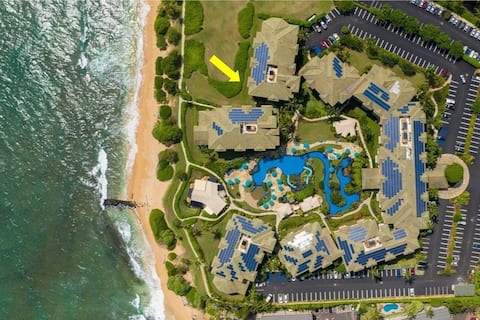
G106 Oceanfront Luxury Steps to the Beach with AC!
Entire Place • 2 bedrooms
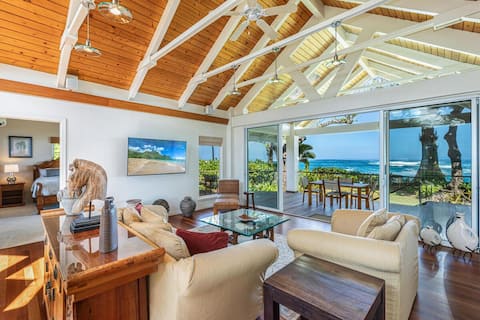
Luxury Beachfront Home in Haena
Entire Place • 2 bedrooms
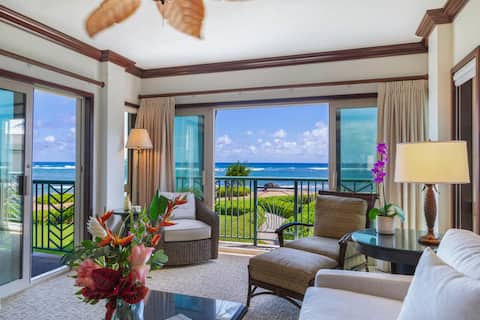
Oceanside Luxury at the Resort
Entire Place • 2 bedrooms

Lae Nani 123 Oceanfront & Pool
Entire Place • 1 bedroom
Waipouli Beach Resort Unit A106 Oceanfront 2BD/3BA
Entire Place • 2 bedrooms
Sleeping Giant Cottage with Plunge Pool TNVC 1244
Entire Place • 1 bedroom
Note: Performance varies based on location, size, amenities, seasonality, and management quality. Data reflects the past 12 months.
Who Are the Top Airbnb Hosts in Kapaʻa?
Learn from the best! This table showcases top-performing Airbnb hosts in Kapaʻa based on the number of properties managed and estimated total revenue over the past year. Analyze their scale and performance metrics.
| Host Name | Properties | Grossing Revenue | Stay Reviews | Avg Rating |
|---|---|---|---|---|
| Kauai Calls | 11 | $534,824 | 28 | 4.89/5.0 |
| Kauai Seaside Properties | 4 | $365,815 | 111 | 4.88/5.0 |
| Pohaku Vacation Rentals | 6 | $329,679 | 112 | 4.82/5.0 |
| Kaua’i | 2 | $315,530 | 60 | 5.00/5.0 |
| Margaret | 5 | $274,632 | 1251 | 4.85/5.0 |
| Hawaii Life Rentals | 1 | $167,709 | 0 | Not Rated |
| Tina | 1 | $133,934 | 9 | 4.78/5.0 |
| Hawaii Vacation Condos By OUTR | 1 | $124,378 | 3 | 5.00/5.0 |
| Rohin & Michelle | 1 | $115,163 | 217 | 4.92/5.0 |
| Enas | 1 | $85,413 | 47 | 4.94/5.0 |
Analyzing the strategies of top hosts, such as their property selection, pricing, and guest communication, can offer valuable lessons for optimizing your own Airbnb operations in Kapaʻa.
Who Are the Airbnb Hosts in Kapaʻa?
Kapaʻa is a quality-focused market, with a high Superhost share and fairly mature operating standards.
Host Profile Insights for Kapaʻa
- With 69.4% Superhosts, Kapaʻa has an experienced host base that sets high guest expectations. New entrants should plan for competitive quality standards.
- 51.0% of listings are professionally managed, indicating a mature, competitive market with institutional players.
- 26.5% of listings have Instant Book enabled. Lower Instant Book adoption means many guests must request approval, which can slow conversions.
- 91.8% of listings use Airbnb's simplified pricing (host-only fee), where the host pays the entire platform service fee and the guest sees one all-in price with no separate Airbnb service charge. High adoption signals a professional, PMS-connected host base — Airbnb mandates simplified pricing for software-connected listings.
Recommendations for Hosts
- Consider enabling Instant Book — it reduces booking friction and Airbnb's algorithm tends to favor Instant Book listings in search results.
- With 20.4% cohosted listings, there may be a growing local market for property management services.
- Benchmark your host metrics against these Kapaʻa averages regularly and adjust your hosting strategy based on what top performers do differently.
Top Professional Management Companies in Kapaʻa
These are the highest-grossing professional property management operations in Kapaʻa, ranked by total revenue across their portfolio. Their performance metrics offer a benchmark for what institutional-level hosting looks like in this market.
| Company | Listings | Revenue | ADR | Occ. | Rating |
|---|---|---|---|---|---|
| Kauai Calls | 11 | $534,824 | $425 | 42.7% | 4.89/5 |
| Pohaku Vacation Rentals | 6 | $329,679 | $232 | 64.2% | 4.82/5 |
| Kaua’i | 2 | $315,530 | $600 | 68.6% | 5.00/5 |
| Hawaii Life Rentals | 1 | $167,709 | $1,531 | 56.5% | N/A |
| Tina | 1 | $133,934 | $647 | 57.3% | 4.78/5 |
| Sarah | 1 | $84,680 | $322 | 70.8% | 4.70/5 |
| Kathy McCartney | 1 | $76,127 | $277 | 74.1% | 4.84/5 |
| Premier Kauai Ohana | 2 | $59,781 | $287 | 42.2% | 4.75/5 |
| Kanani | 1 | $56,744 | $275 | 55.9% | 4.94/5 |
| Coldwell Banker Island Vacatio | 1 | $24,256 | $258 | 58.4% | 5.00/5 |
Management Company Insights for Kapaʻa
- The leading management company, Kauai Calls, operates 11 listings with $534,824 in gross revenue — a useful benchmark for what scale looks like in Kapaʻa.
- Top managers average 3 properties each, suggesting professional management in Kapaʻa still operates at a relatively boutique scale.
- Professionally managed listings in the top tier average 4.86/5 in guest ratings — demonstrating that scale and quality can coexist.
Recommendations
- Study how top management companies price, position, and maintain their portfolios — their ADR and occupancy rates reflect strategies refined across dozens of listings.
- If you're considering hiring a property manager, compare their portfolio performance against these benchmarks before committing.
How Does Kapaʻa's Airbnb Market Compare to Nearby Cities?
How does the Kapaʻa Airbnb market stack up against its neighbors? Compare key performance metrics like average monthly revenue, ADR, and occupancy rates in surrounding areas to understand the broader regional STR landscape.
Compared with Mākaha Valley, Kapaʻa has 10 percentage points lower occupancy and about $365 lower ADR. That helps frame whether this market is winning more on demand, pricing, or both.
| Market | Active Properties | Monthly Revenue | Daily Rate | Avg. Occupancy |
|---|---|---|---|---|
| Mākaha Valley | 92 | $13,929 | $733.99 | 66% |
| Haena | 12 | $13,102 | $1224.48 | 47% |
| Kilauea | 47 | $10,618 | $1160.39 | 47% |
| Anahola | 34 | $9,186 | $695.73 | 44% |
| Kekaha | 14 | $8,870 | $551.94 | 62% |
| Koloa | 363 | $8,700 | $903.59 | 50% |
| Waianae | 36 | $7,619 | $554.72 | 50% |
| Hanalei | 422 | $7,184 | $618.04 | 47% |
| Poipu | 1,119 | $6,807 | $633.27 | 47% |
| Kapolei | 538 | $6,026 | $724.64 | 41% |
Frequently Asked Questions About Airbnb in Kapaʻa
These quick answers summarize the most common investor and operator questions using AirROI's latest market data for Kapaʻa.
How much do Airbnb hosts make in Kapaʻa?
Kapaʻa hosts earn about $63,531 per year on average, with an average nightly rate of $369 and RevPAR of $209. Those figures describe the typical revenue environment for active listings in Kapaʻa, Hawaii, not the ceiling for the best operators. Source: AirROI 2026 data, Kapaʻa market, July 2025 to June 2026.
What is the average Airbnb occupancy rate in Kapaʻa?
The average Airbnb occupancy rate in Kapaʻa is 56.2%. March is the strongest month and June is the softest, so hosts should expect demand to move meaningfully throughout the year rather than stay flat.
What is the average Airbnb daily rate in Kapaʻa?
Listings in Kapaʻa average $369 per night. The broader pricing spread also matters: lower-performing listings cluster closer to the lower quartiles, while premium homes can price materially above the city average when demand spikes or listing quality stands out.
How many Airbnb listings are active in Kapaʻa?
Kapaʻa currently has about 49 active Airbnb listings in AirROI's market dataset. That supply count helps explain how competitive the market is, how much depth there is for benchmarking, and whether the market behaves like a niche destination or a scaled urban market.
How strict are short-term rental regulations in Kapaʻa?
AirROI currently classifies the short-term rental regulation level in Kapaʻa as High. The dataset also shows about 95.9% of listings with registration evidence. That is a market signal, not legal advice, so hosts should still confirm current licensing and compliance rules locally before listing.
What is the RevPAR for Airbnb in Kapaʻa?
RevPAR in Kapaʻa is about $209. That metric combines pricing and occupancy into one efficiency number, so it is often a better quick benchmark than ADR alone when investors want to compare how well listings convert nightly rates into realized revenue.
Is Airbnb profitable in Kapaʻa?
At 56.2% occupancy, Kapaʻa can be profitable — but margins depend heavily on operating costs, property acquisition price, and how well hosts optimize pricing across seasons. Average annual revenue is $63,531, but individual returns depend on property type, location within the city, and the host's operating efficiency.
How far in advance do guests book Airbnb in Kapaʻa?
The average booking lead time in Kapaʻa is about 79 days — a longer planning horizon typical of destination or vacation markets where travelers book well in advance. Hosts who understand their market's booking cadence can adjust minimum stays and pricing windows accordingly.
What are the best neighborhoods for Airbnb in Kapaʻa?
Based on AirROI's analysis, some of the top neighborhoods for short-term rentals in Kapaʻa include Kapa'a Beach, Royal Coconut Coast, Kapa'a Town. Each area attracts different guest profiles — from business travelers to leisure visitors — so the best location depends on the property type and target audience a host is aiming for. See the full neighborhood breakdown above.
What type of property performs best on Airbnb in Kapaʻa?
entire_home listings make up 100.0% of the active supply in Kapaʻa. The most common configuration does not always mean the most profitable — operators who identify underserved property types or bedroom counts can sometimes outperform the market average by filling a gap in local supply.
How does Kapaʻa compare to nearby Airbnb markets?
Among neighboring markets, Mākaha Valley posts $167,152 in average annual revenue with 65.9% occupancy, compared to Kapaʻa's $63,531 and 56.2%. Comparing nearby markets helps investors understand whether a destination's performance reflects local demand or broader regional trends.
What is the average length of stay in Kapaʻa?
The average Airbnb stay length in Kapaʻa is about 6.4 nights. That matters for turnover, cleaning operations, and pricing strategy because shorter stays increase changeovers while longer stays can smooth occupancy and reduce operational friction.
What is the average Airbnb guest rating in Kapaʻa?
Airbnb listings in Kapaʻa average 4.79 out of 5 overall. About 34.7% of listings carry the guest favorite badge, which suggests a meaningful share of inventory is competing on review quality rather than price alone.
Which amenities boost Airbnb revenue in Kapaʻa?
Pack ’n play/Travel crib and Ethernet connection are among the strongest revenue-linked amenities in Kapaʻa. In AirROI's latest dataset, listings with these amenities outperform those without on average revenue, which makes amenities analysis useful for prioritizing investment and listing upgrades.
Do Airbnb hosts charge cleaning fees in Kapaʻa?
Yes. About 100.0% of active Airbnb listings in Kapaʻa charge a cleaning fee, and the average fee is $276. The more important operating benchmark is how much of gross revenue that fee consumes, not just the absolute dollar amount.
What percentage of Airbnb hosts are Superhosts in Kapaʻa?
A 69.4% Superhost rate signals a highly competitive market where review quality and responsiveness are table stakes, not differentiators.
About AirROI Market Data
AirROI tracks over 20 million properties across 190+ countries and maintains 15+ years of historical performance data, making it one of the deepest Airbnb and STR intelligence platforms available. The analytics pipeline aggregates listing-level data monthly — revenue, occupancy, nightly rates, RevPAR, guest demographics, booking patterns, and competitive supply — so investors and operators can benchmark any market against its own history and against neighboring destinations.
Real estate investors, property managers, financial institutions, hedge funds, tourism boards, hospitality consultants, tech platforms, and academic researchers rely on AirROI data to underwrite acquisitions, optimize pricing, model macro trends, and conduct peer-reviewed research. Data is available through in-depth market reports like this one and the Airbnb API with 22 endpoints and an Airbnb MCP Server for AI agents.
AirROI proprietary analytics as of 2026-06-30. Metrics reflect trailing twelve-month aggregates from active listings. Revenue figures are market averages, not projections. Neighborhood descriptions are AI-generated and reviewed for accuracy. For full methodology, see the data methodology page.