
Absorption Rate
Key Takeaways
- Absorption rate equals the share of new listings that reach target occupancy within a fixed window — above 65% is healthy, below 50% is a warning
- It is a leading indicator: while occupancy rate reflects the present, absorption rate predicts where occupancy is heading for all hosts
- Markets with median occupancy above 53% (San Francisco, San Diego) absorb new supply rapidly; markets at 44-47% (Austin, Nashville) are absorbing far more slowly
- A declining absorption rate signals that supply growth is outpacing demand, compressing rates and lengthening ramp-up periods for new listings
- Investors should segment absorption by property type and submarket — city-level rates mask sharp neighborhood-to-neighborhood variation
How Absorption Rate Is Calculated
Formula: Absorption Rate = (New Listings Reaching Target Occupancy ÷ Total New Listings) × 100
Example — four-quarter trend:
| Period | New Listings | Reached 50% Occupancy in 90 Days | Absorption Rate |
|---|---|---|---|
| Q1 | 120 | 96 | 80% |
| Q2 | 150 | 105 | 70% |
| Q3 | 200 | 110 | 55% |
| Q4 | 180 | 81 | 45% |
This pattern — supply accelerating while fewer new listings find traction — is exactly what preceded occupancy compression in multiple US markets through 2024–2025. The drop from 80% to 45% in a single year is a structural shift, not seasonal noise.
Occupancy Rate as an Absorption Proxy
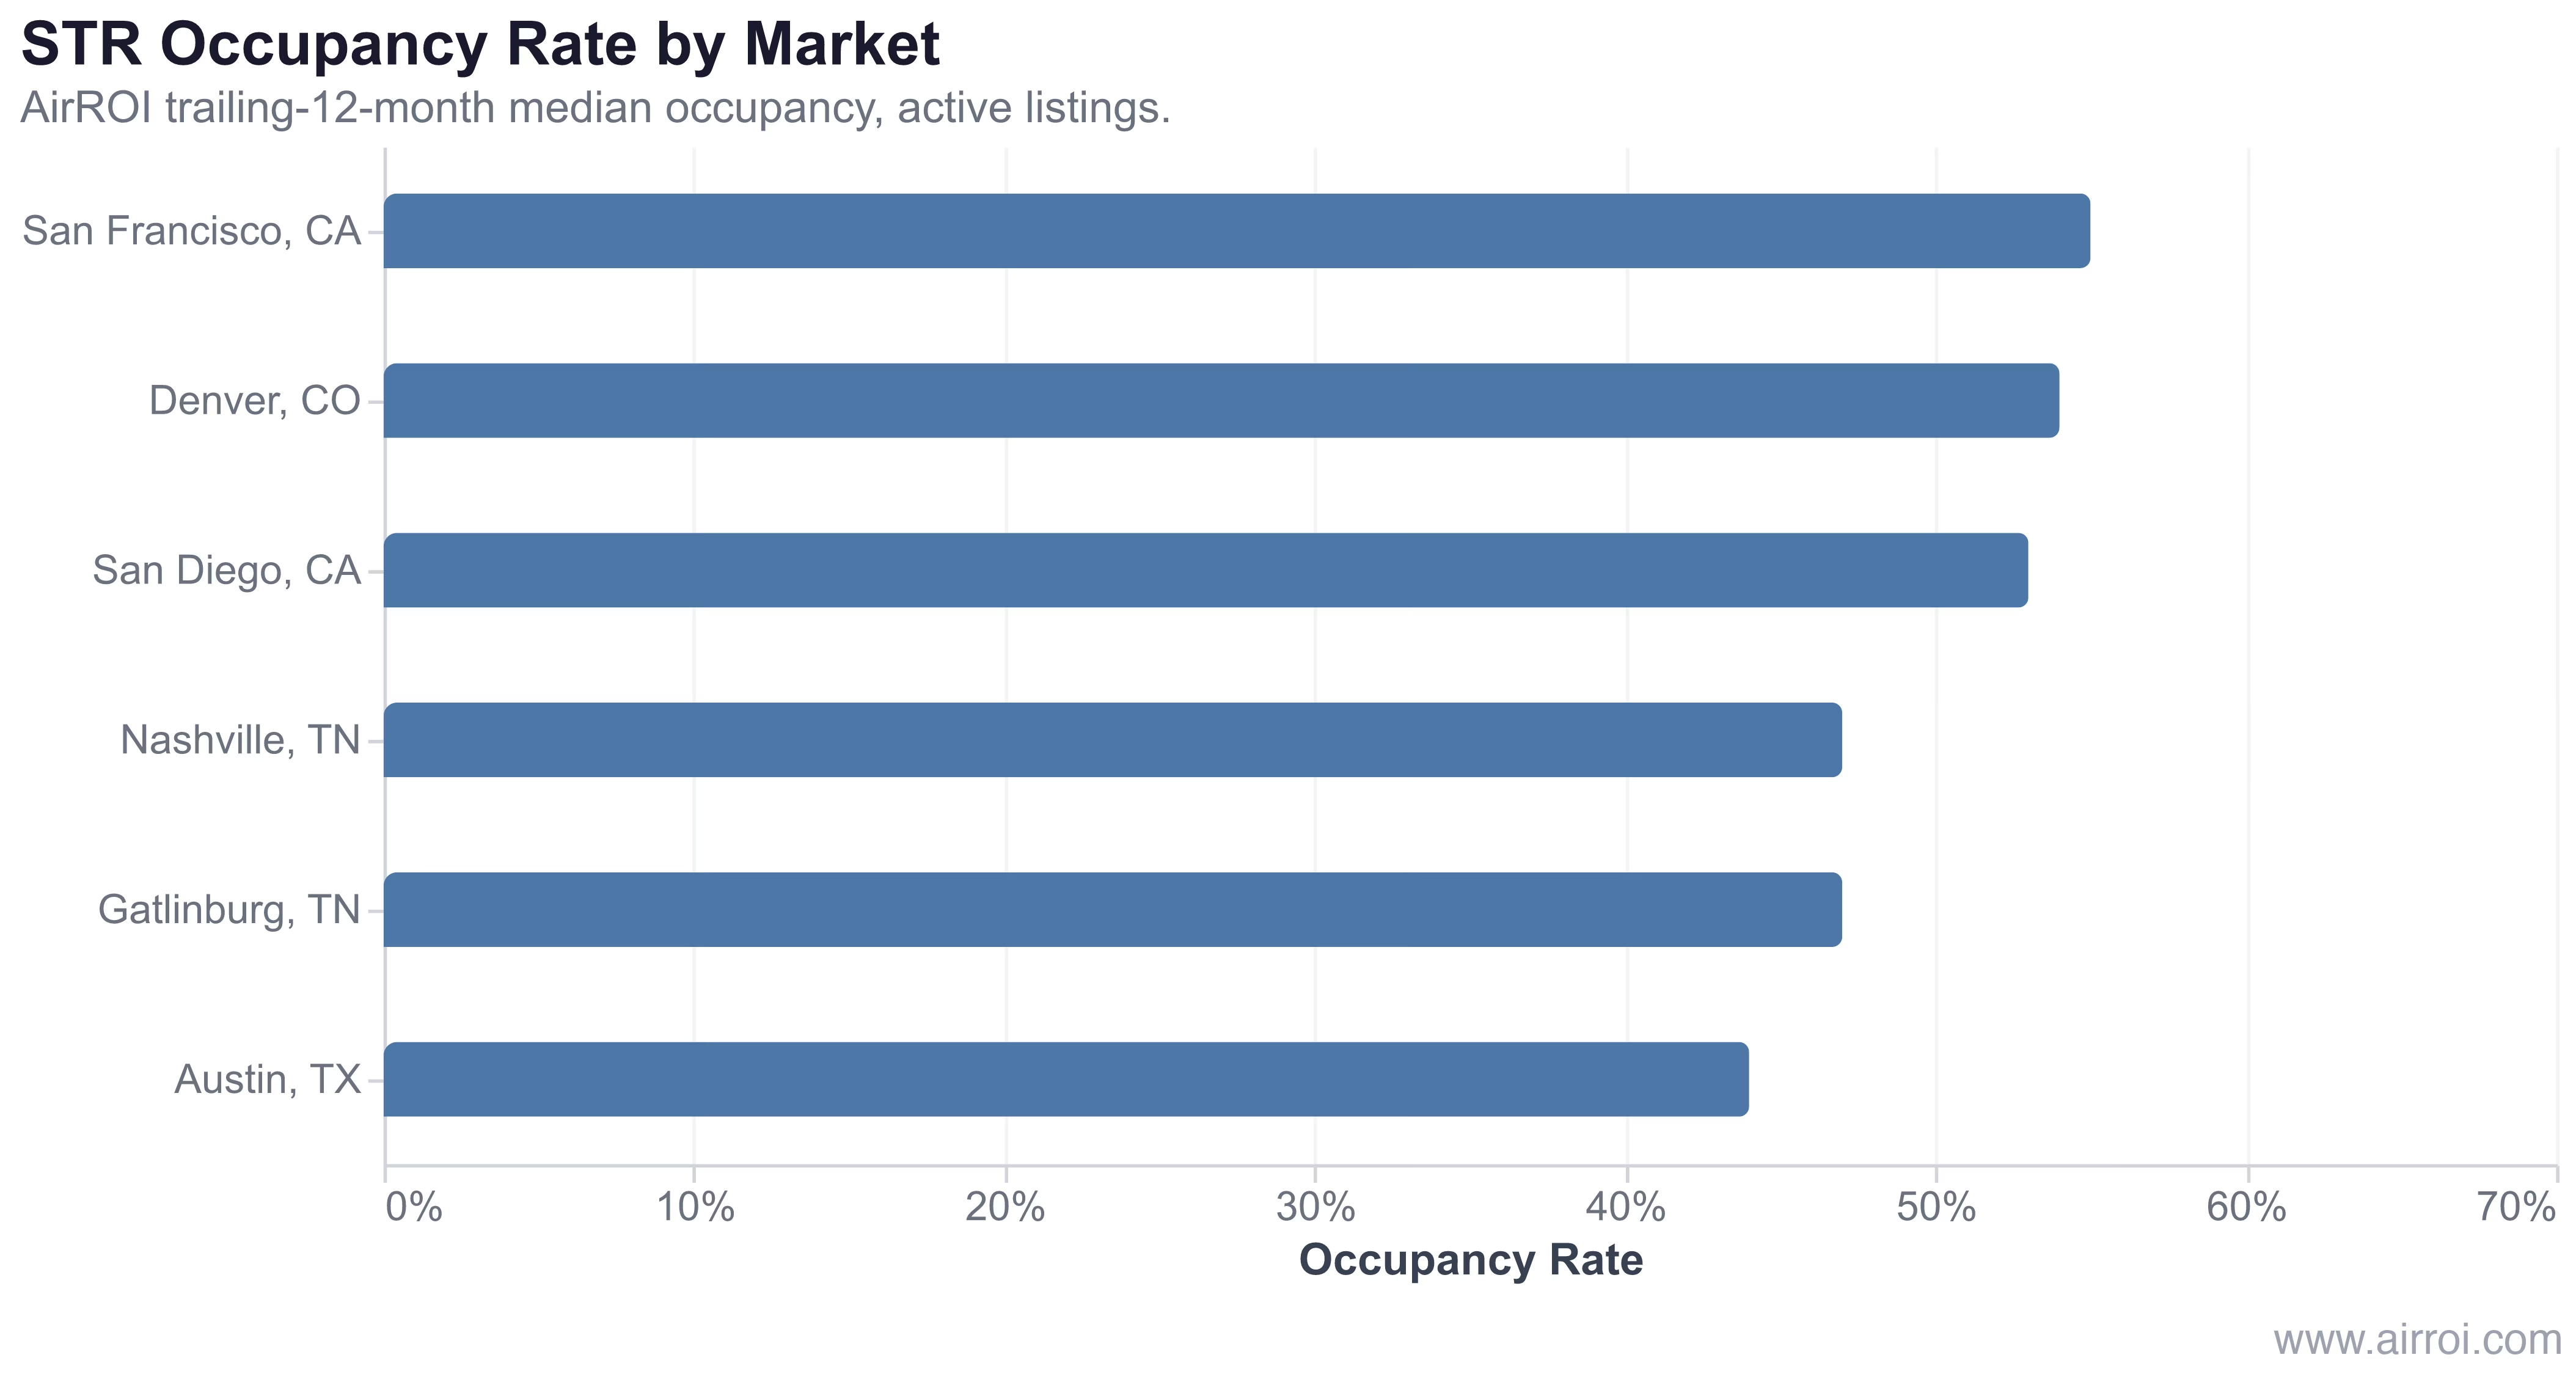
In AirROI's analysis of more than 35,000 active listings across these six markets, occupancy spans from 44% in Austin to 55% in San Francisco — an 11-point range that maps directly onto absorption difficulty. San Francisco's 55% median means new listings enter a market where demand comfortably fills available nights; Austin's 44% median means new supply lands in a pool that is already strained.
The occupancy rate of existing listings is the market's verdict on whether it can absorb new ones. Below 50%, the market is telling you something every investor should hear before committing capital.
Why Absorption Rate Matters for Airbnb Hosts
Absorption rate provides information that aggregate metrics miss entirely:
- Leading indicator: Occupancy rate tells you how the market is performing today; absorption rate tells you where it is heading. A market adding 20% more listings per quarter with a falling absorption rate will see occupancy decline for everyone — including established hosts — within two to four quarters.
- Investment timing: Entering a market with an absorption rate above 70% means your new listing is likely to reach sustainable bookings within 60–90 days. Entering at 45% means budgeting 9–12 months to ramp, and accepting that early ADR will be compressed.
- Competitive pressure signal: When absorption weakens, new listings compete harder for the same guest pool — undercutting on price, accepting shorter stays, and eroding the rate discipline that protects established hosts. According to AirROI's 2026 market rankings, the highest-performing markets share one common trait: sustained absorption strength driven by diverse, year-round demand rather than a single event or season.
- Market health beyond RevPAR: A market can post a healthy trailing RevPAR while its absorption rate is quietly deteriorating — supply growth is lagged in most revenue metrics. Absorption catches the inflection point earlier.
Absorption Rate Benchmarks
| Absorption Rate | Market Health | Implication for Hosts |
|---|---|---|
| 80%+ | Strong demand | Favorable window to expand or invest; new listings ramp within 60 days |
| 65–80% | Healthy | Market supports moderate growth; standard 90-day ramp-up budget appropriate |
| 50–65% | Caution | Supply beginning to strain demand; differentiate aggressively |
| 35–50% | Concerning | Saturation risk; new investment needs strong thesis |
| Below 35% | Oversupplied | High probability of continued occupancy and ADR compression; avoid unless distressed acquisition |
Factors That Affect Absorption Rate
| Factor | Impact on Absorption |
|---|---|
| Market demand growth | Higher demand growth = faster absorption |
| Existing supply levels | Already-saturated markets absorb slowly |
| Seasonality | New listings launched in peak season absorb faster |
| Property quality and photography | Well-presented, competitively priced listings absorb faster |
| Property type vs. local inventory mix | Types in short supply absorb faster than oversupplied types |
| Regulatory regime | Permit caps in heavy-regulation markets slow new supply and paradoxically sustain absorption for existing hosts |
How to Use Absorption Rate in Practice
- Check before investing: Query your market dashboard for how quickly new active listings are reaching viable occupancy in your target area. A single data point is useful; a 4-quarter trend is decisive.
- Track quarterly trends: One quarter's absorption rate is a snapshot; the direction over 3–4 quarters reveals whether the market is tightening or loosening. A rate falling 10+ points quarter over quarter warrants a pause.
- Segment by property type: The absorption rate for two-bedroom condos may be 75% while luxury homes sit at 40% in the same ZIP code. Aggregate market figures can mask the specific segment you are evaluating.
- Compare across submarkets: Adjacent neighborhoods can differ by 20+ percentage points based on walkability, proximity to demand drivers, and existing inventory mix.
- Factor absorption into revenue projections: If absorption is running at 60%, model your first 6 months conservatively — assume 40% occupancy in months 1–3 and 55% in months 4–6, then normalize. Overestimating early ramp-up is the most common underwriting error in new STR investments. Our STR investment analysis guide walks through the full underwriting model.
- Combine with booking pace: Pair absorption with booking pace data to understand both how fast new listings fill and how quickly existing listings are booking forward — together, they capture both the entry and the cruising speed.
Frequently Asked Questions
Absorption rate for STRs is calculated by dividing the number of new listings that achieve a target occupancy threshold (typically 50%+ within their first 90 days) by the total number of new listings entering the market in that period. For example, if 80 of 100 new listings reach 50% occupancy within 90 days, the absorption rate is 80%.
A healthy absorption rate is generally above 65-70%, indicating that the market can absorb new supply without significant disruption. Rates below 50% suggest the market is struggling to absorb new listings, which often leads to declining occupancy and rates across all properties.
Occupancy rate measures the percentage of available nights booked across all existing listings. Absorption rate specifically measures how well the market integrates new supply — how quickly new listings go from zero to productive. A market can have a decent overall occupancy rate while having a low absorption rate, signaling that new supply is beginning to strain the market.
Markets with sustained occupancy above 53-55% — such as San Francisco and San Diego — tend to absorb new supply most rapidly, because underlying demand can accommodate additional inventory. Conversely, markets where occupancy has dipped below 45% despite active listing growth, like Austin, signal weakening absorption and a need for caution before new investment.
Check the trailing absorption trend for the specific submarket and property type you are targeting, not just the city-level aggregate. A market absorbing 70%+ of new listings within 90 days supports a standard 6-month ramp-up budget. If absorption is below 50%, extend your break-even timeline to 9-12 months and stress-test your returns at 40% occupancy in year one.