
Occupancy Rate
Key Takeaways
- Occupancy rate = (Booked Nights ÷ Available Nights) × 100
- AirROI trailing-12-month data shows US STR markets ranging from 44% (Austin) to 55% (San Francisco)
- Higher occupancy does not always mean higher revenue — rate optimization matters equally
- Analyze occupancy alongside ADR and RevPAR; a rising occupancy with falling ADR is a warning sign
- Seasonal patterns cause month-to-month swings of 20+ percentage points in many markets
- Regulatory supply constraints can push compliant-listing occupancy higher, as in New York after Local Law 18
How to Calculate Occupancy Rate
Formula:
Occupancy Rate = (Booked Nights ÷ Available Nights) × 100
Example:
If your property was open for 30 nights in a month and guests booked 22 of them:
Occupancy Rate = (22 ÷ 30) × 100 = 73.3%
Available nights means only the nights your property was genuinely open to guests. Nights you blocked for personal use, maintenance holds, or gap-day rules should be excluded from the denominator — including them artificially deflates your rate.
STR Occupancy Rate Benchmarks
| Rating | Occupancy Rate | Interpretation |
|---|---|---|
| Excellent | 75%+ | High demand; test higher nightly rates immediately |
| Good | 55–75% | Healthy balance of bookings and ADR |
| Fair | 35–55% | Improve pricing, photos, or minimum-stay rules |
| Low | Below 35% | Review listing fundamentals and market competition |
These benchmarks apply to properties priced at or near market rate. A luxury property running 45% occupancy at $800/night can outperform a budget listing at 70% occupancy and $120/night on every revenue metric that matters — including RevPAR and NOI.
Occupancy Rates Across US Markets
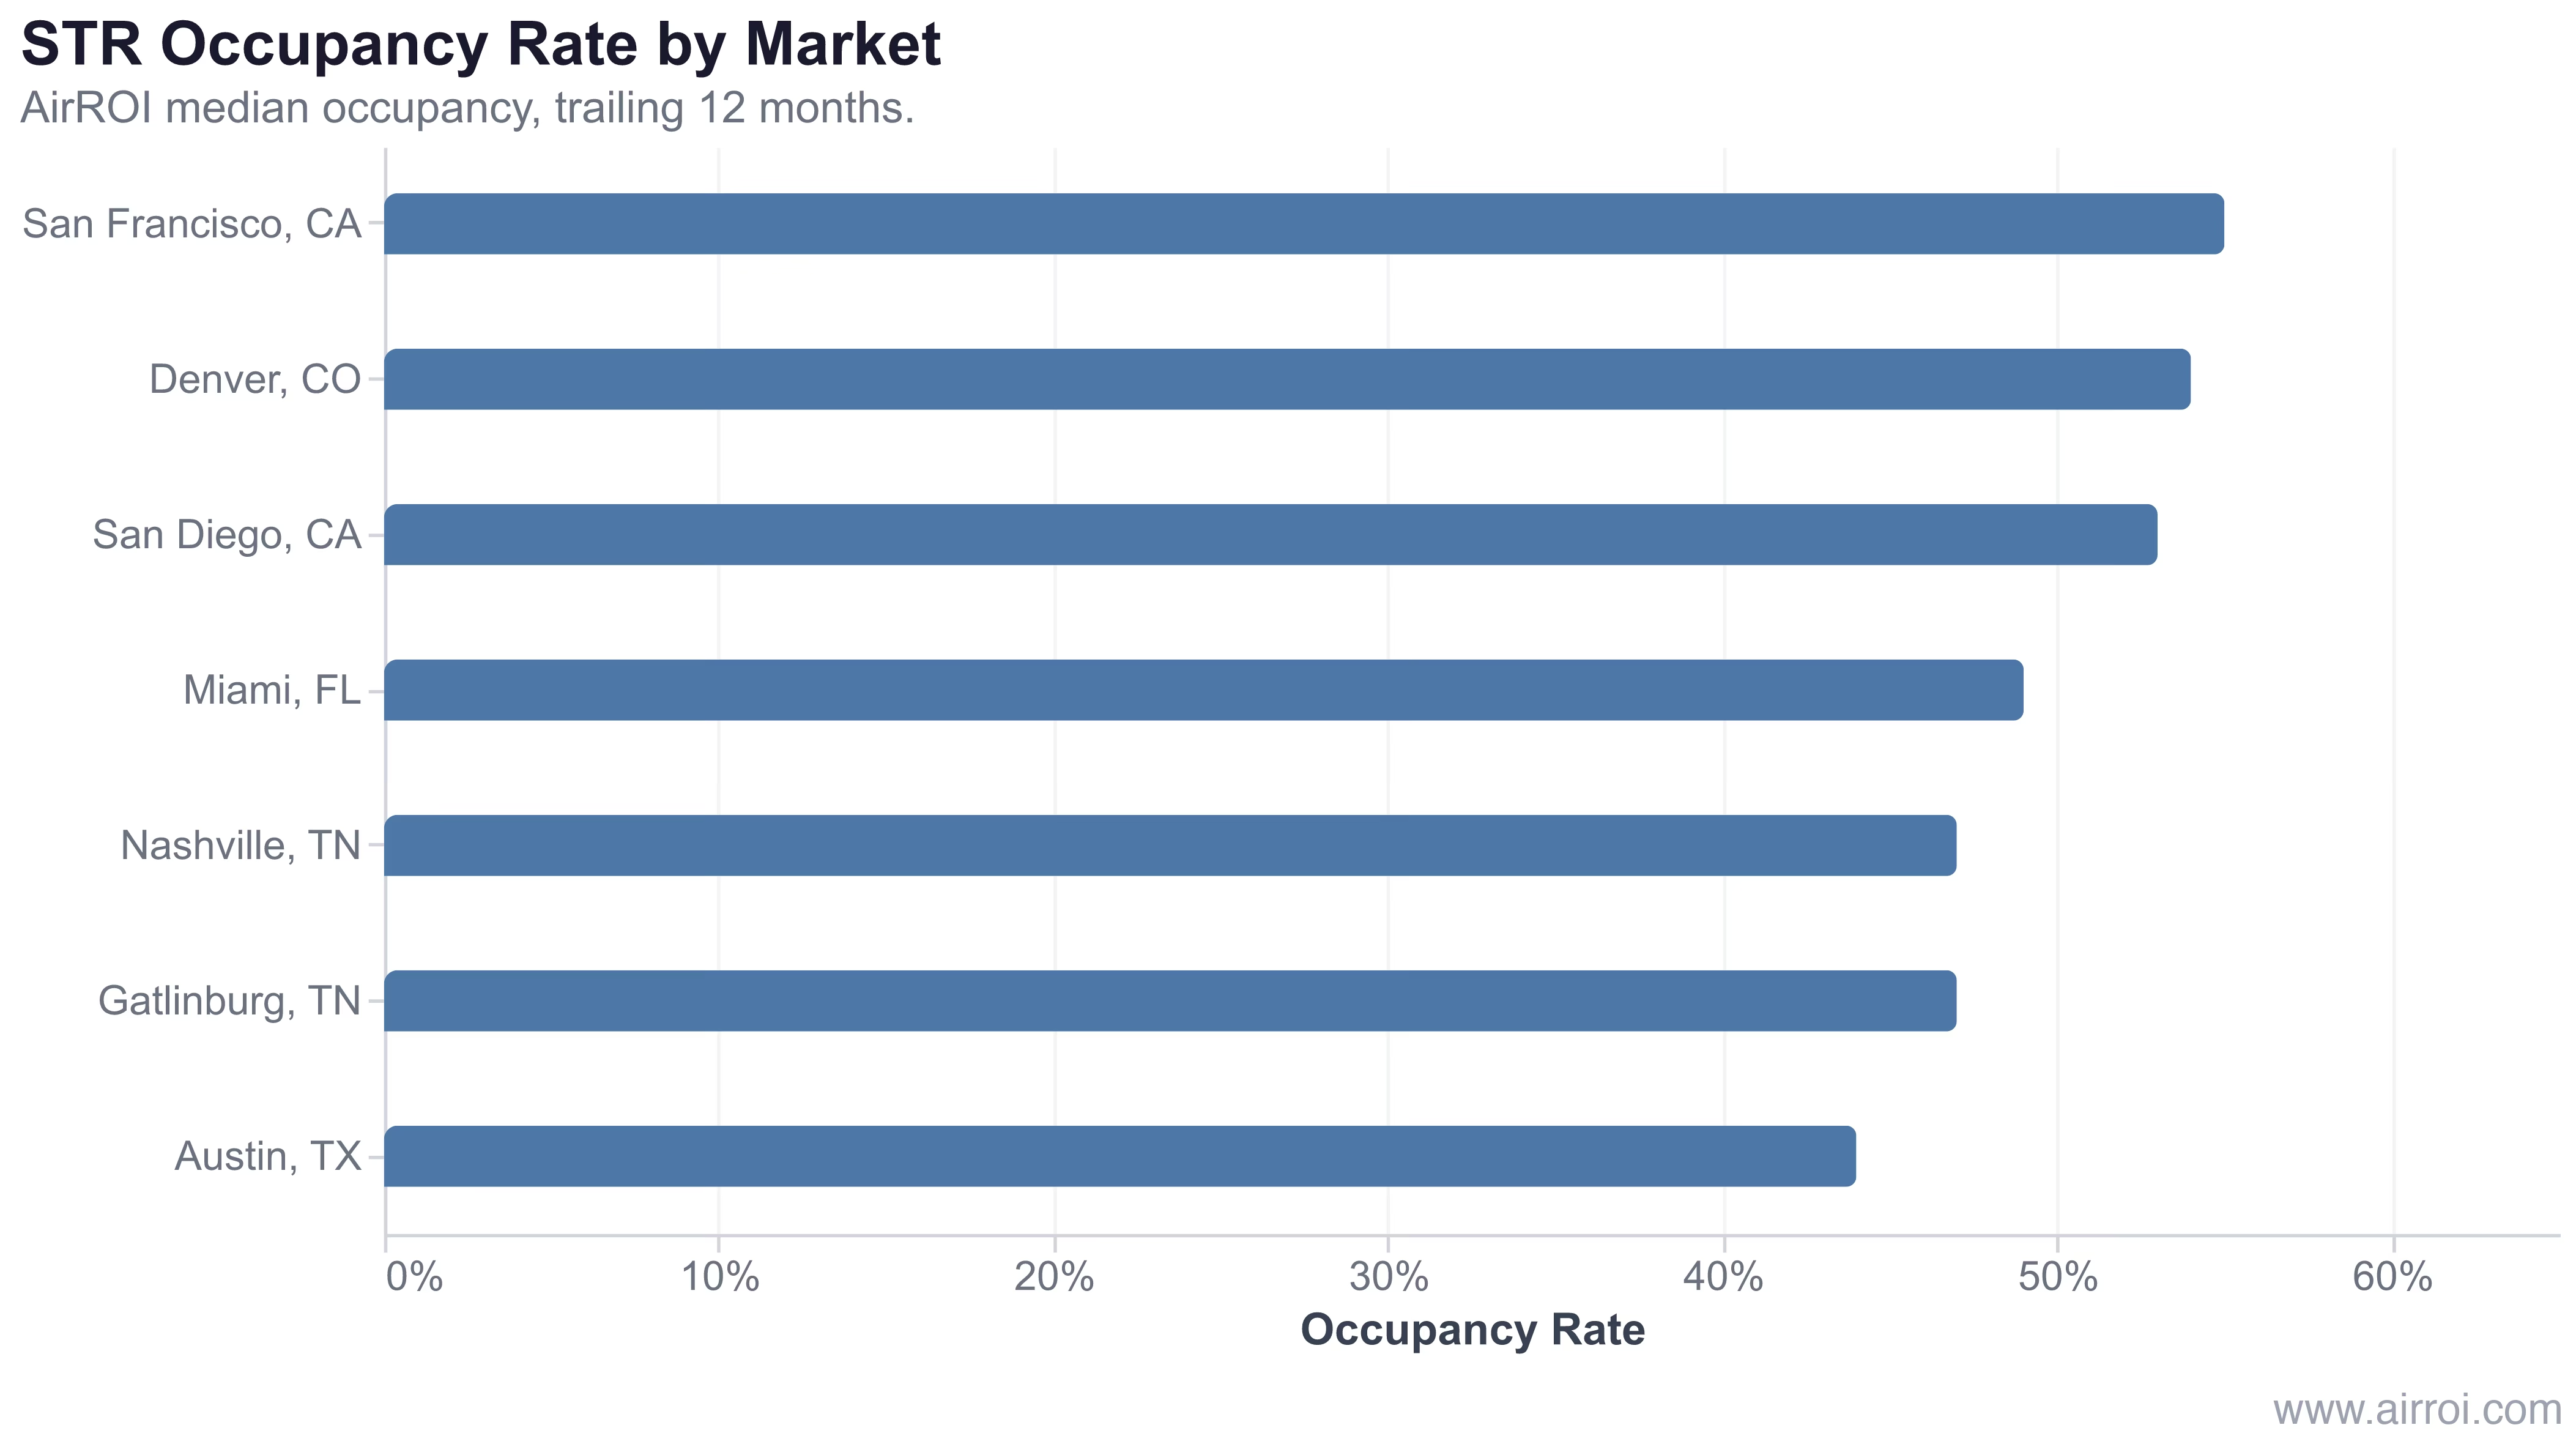
In AirROI's analysis of more than 44,000 active listings across seven US markets, median occupancy spans a 11-point range from 44% to 55% — a surprisingly tight band given the diversity of destinations involved.
| Market | Occupancy | ADR | RevPAR | Active Listings |
|---|---|---|---|---|
| San Francisco, CA | 55% | $273.50 | $152.10 | 4,355 |
| Denver, CO | 54% | $221.50 | $120.00 | 3,739 |
| San Diego, CA | 53% | $394.90 | $212.20 | 9,560 |
| Miami, FL | 49% | $291.00 | $142.90 | 7,905 |
| Nashville, TN | 47% | $353.60 | $160.20 | 6,165 |
| Gatlinburg, TN | 47% | $376.50 | $178.10 | 3,622 |
| Austin, TX | 44% | $297.70 | $129.80 | 8,774 |
The data exposes the occupancy-ADR trade-off directly: San Francisco's 55% occupancy is the highest in the group, yet its $273.50 ADR ranks near the bottom. San Diego and Nashville both run lower occupancy but post $40–$120 more per night, which translates into stronger RevPAR. Occupancy alone does not determine which market — or which host strategy — wins.
The markets with the highest occupancy are not always the most profitable. San Diego's 53% occupancy combined with a $394.90 ADR produces a $212.20 RevPAR — nearly 40% above San Francisco's $152.10 despite 2 points less occupancy. Rate discipline, not occupancy maximization, is the lever that compounds fastest.
Why Occupancy Rate Matters
Revenue arithmetic: RevPAR equals ADR times occupancy rate. A 5-point occupancy gain on a $300 ADR property adds $15 per available night — roughly $5,400 per year — with zero change to pricing. That same gain from a rate increase is harder to achieve and risks losing bookings.
Regulatory read-through: Supply constraints can structurally lift occupancy for compliant listings. In New York, AirROI data shows active listings fell from roughly 26,775 in September 2023 to ~10,500 by April 2026 following Local Law 18 enforcement — a 60% contraction in supply that effectively raised occupancy for the listings that remained legally active.
How to Improve Your Occupancy Rate
Audit your seasonal calendar. Most markets have predictable low seasons where occupancy drops 15–25 points. Pre-loading promotional rates and shorter minimums before the shoulder season — not during it — captures early bookers who would otherwise choose a competitor.
Maintain a high review score. Airbnb's search algorithm weights ratings heavily. Properties with 4.8+ stars surface higher in search results, which directly raises organic booking probability. AirROI data shows Superhost-badged listings in Gatlinburg running 53% occupancy versus 36% for non-Superhosts in the same market — a 17-point gap driven partly by search placement.
Enable Instant Book. Friction in the booking process suppresses conversion. Guests who must submit a request and wait for approval often book a competing property in the meantime. Instant Book removes that friction and improves occupancy, especially for last-minute bookings.
Frequently Asked Questions
A good occupancy rate for an Airbnb is typically 55–75%, though the realistic ceiling varies by market. In AirROI's trailing-12-month data, San Francisco leads at 55% while Austin sits at 44% — both with strong revenue because ADR compensates. Urban markets generally run higher than seasonal vacation destinations, which compress in the off-season.
Divide the number of booked nights by the total available nights in the period, then multiply by 100. For example, 22 booked nights out of 30 available equals a 73.3% occupancy rate. Exclude nights you blocked for personal use or maintenance — only count nights that were genuinely open to guests.
Not necessarily. A 100% occupancy rate almost always means your nightly rate is too low. Revenue management research consistently shows that 70–85% occupancy at an optimized rate generates more total revenue than 100% occupancy at a discounted price — and it also reduces wear on the property.
RevPAR equals ADR multiplied by occupancy rate, so every percentage-point change in occupancy moves RevPAR by the same proportion. A property with a $300 ADR and 50% occupancy earns $150 RevPAR; raise occupancy to 55% without cutting rate and RevPAR jumps to $165 — a 10% gain from a 5-point occupancy move.
The five largest drivers are local demand and seasonality, nightly price relative to comparable listings, minimum-stay requirements (longer minimums create orphan-day gaps), listing quality (photos, reviews, response rate), and regulatory supply constraints. Markets with heavy regulation like New York have structurally lower supply, which can push occupancy higher for compliant listings.