
Revenue Per Available Room (RevPAR)
Key Takeaways
- RevPAR = ADR × Occupancy Rate (equivalently: Total Room Revenue ÷ Total Available Nights)
- Unlike ADR, RevPAR accounts for every unsold night, making it the most complete measure of revenue efficiency
- AirROI trailing-12-month data shows US market RevPARs ranging from $115 (Las Vegas) to $212 (San Diego)
- Superhost status materially closes the RevPAR gap: Scottsdale Superhosts post $241.90 vs. $137.00 for non-Superhosts
- Regulation that reduces short-stay listings suppresses RevPAR even as it reduces supply — New York City is the clearest example
How to Calculate RevPAR
Two equivalent formulas produce the same result:
Method 1 — Rate × Occupancy:
RevPAR = ADR × Occupancy Rate
Method 2 — Revenue over inventory:
RevPAR = Total Room Revenue ÷ Total Available Nights
Example:
A Nashville cabin with a $353.60 ADR and 47% occupancy:
RevPAR = $353.60 × 0.47 = $166.19
That $166.19 represents what every calendar night is worth — on average — whether or not a guest slept there.
RevPAR vs. ADR: Why the Distinction Matters
ADR flatters. A property that charges $500 per night but books only 30% of the time looks like a premium performer on rate alone; its RevPAR of $150 tells a different story. The table below shows how identical ADRs can produce vastly different revenue outcomes once occupancy is introduced:
| Scenario | ADR | Occupancy | RevPAR | Monthly Revenue (30 nights) |
|---|---|---|---|---|
| High rate, low demand | $300 | 40% | $120 | $3,600 |
| Balanced optimization | $200 | 65% | $130 | $3,900 |
| Low rate, high fill | $150 | 90% | $135 | $4,050 |
| Superhost premium blend | $350 | 65% | $228 | $6,825 |
The "high rate, low demand" scenario — the most seductive on paper — generates the least cash. RevPAR surfaces that truth where ADR hides it.
Real RevPAR Data Across US Markets
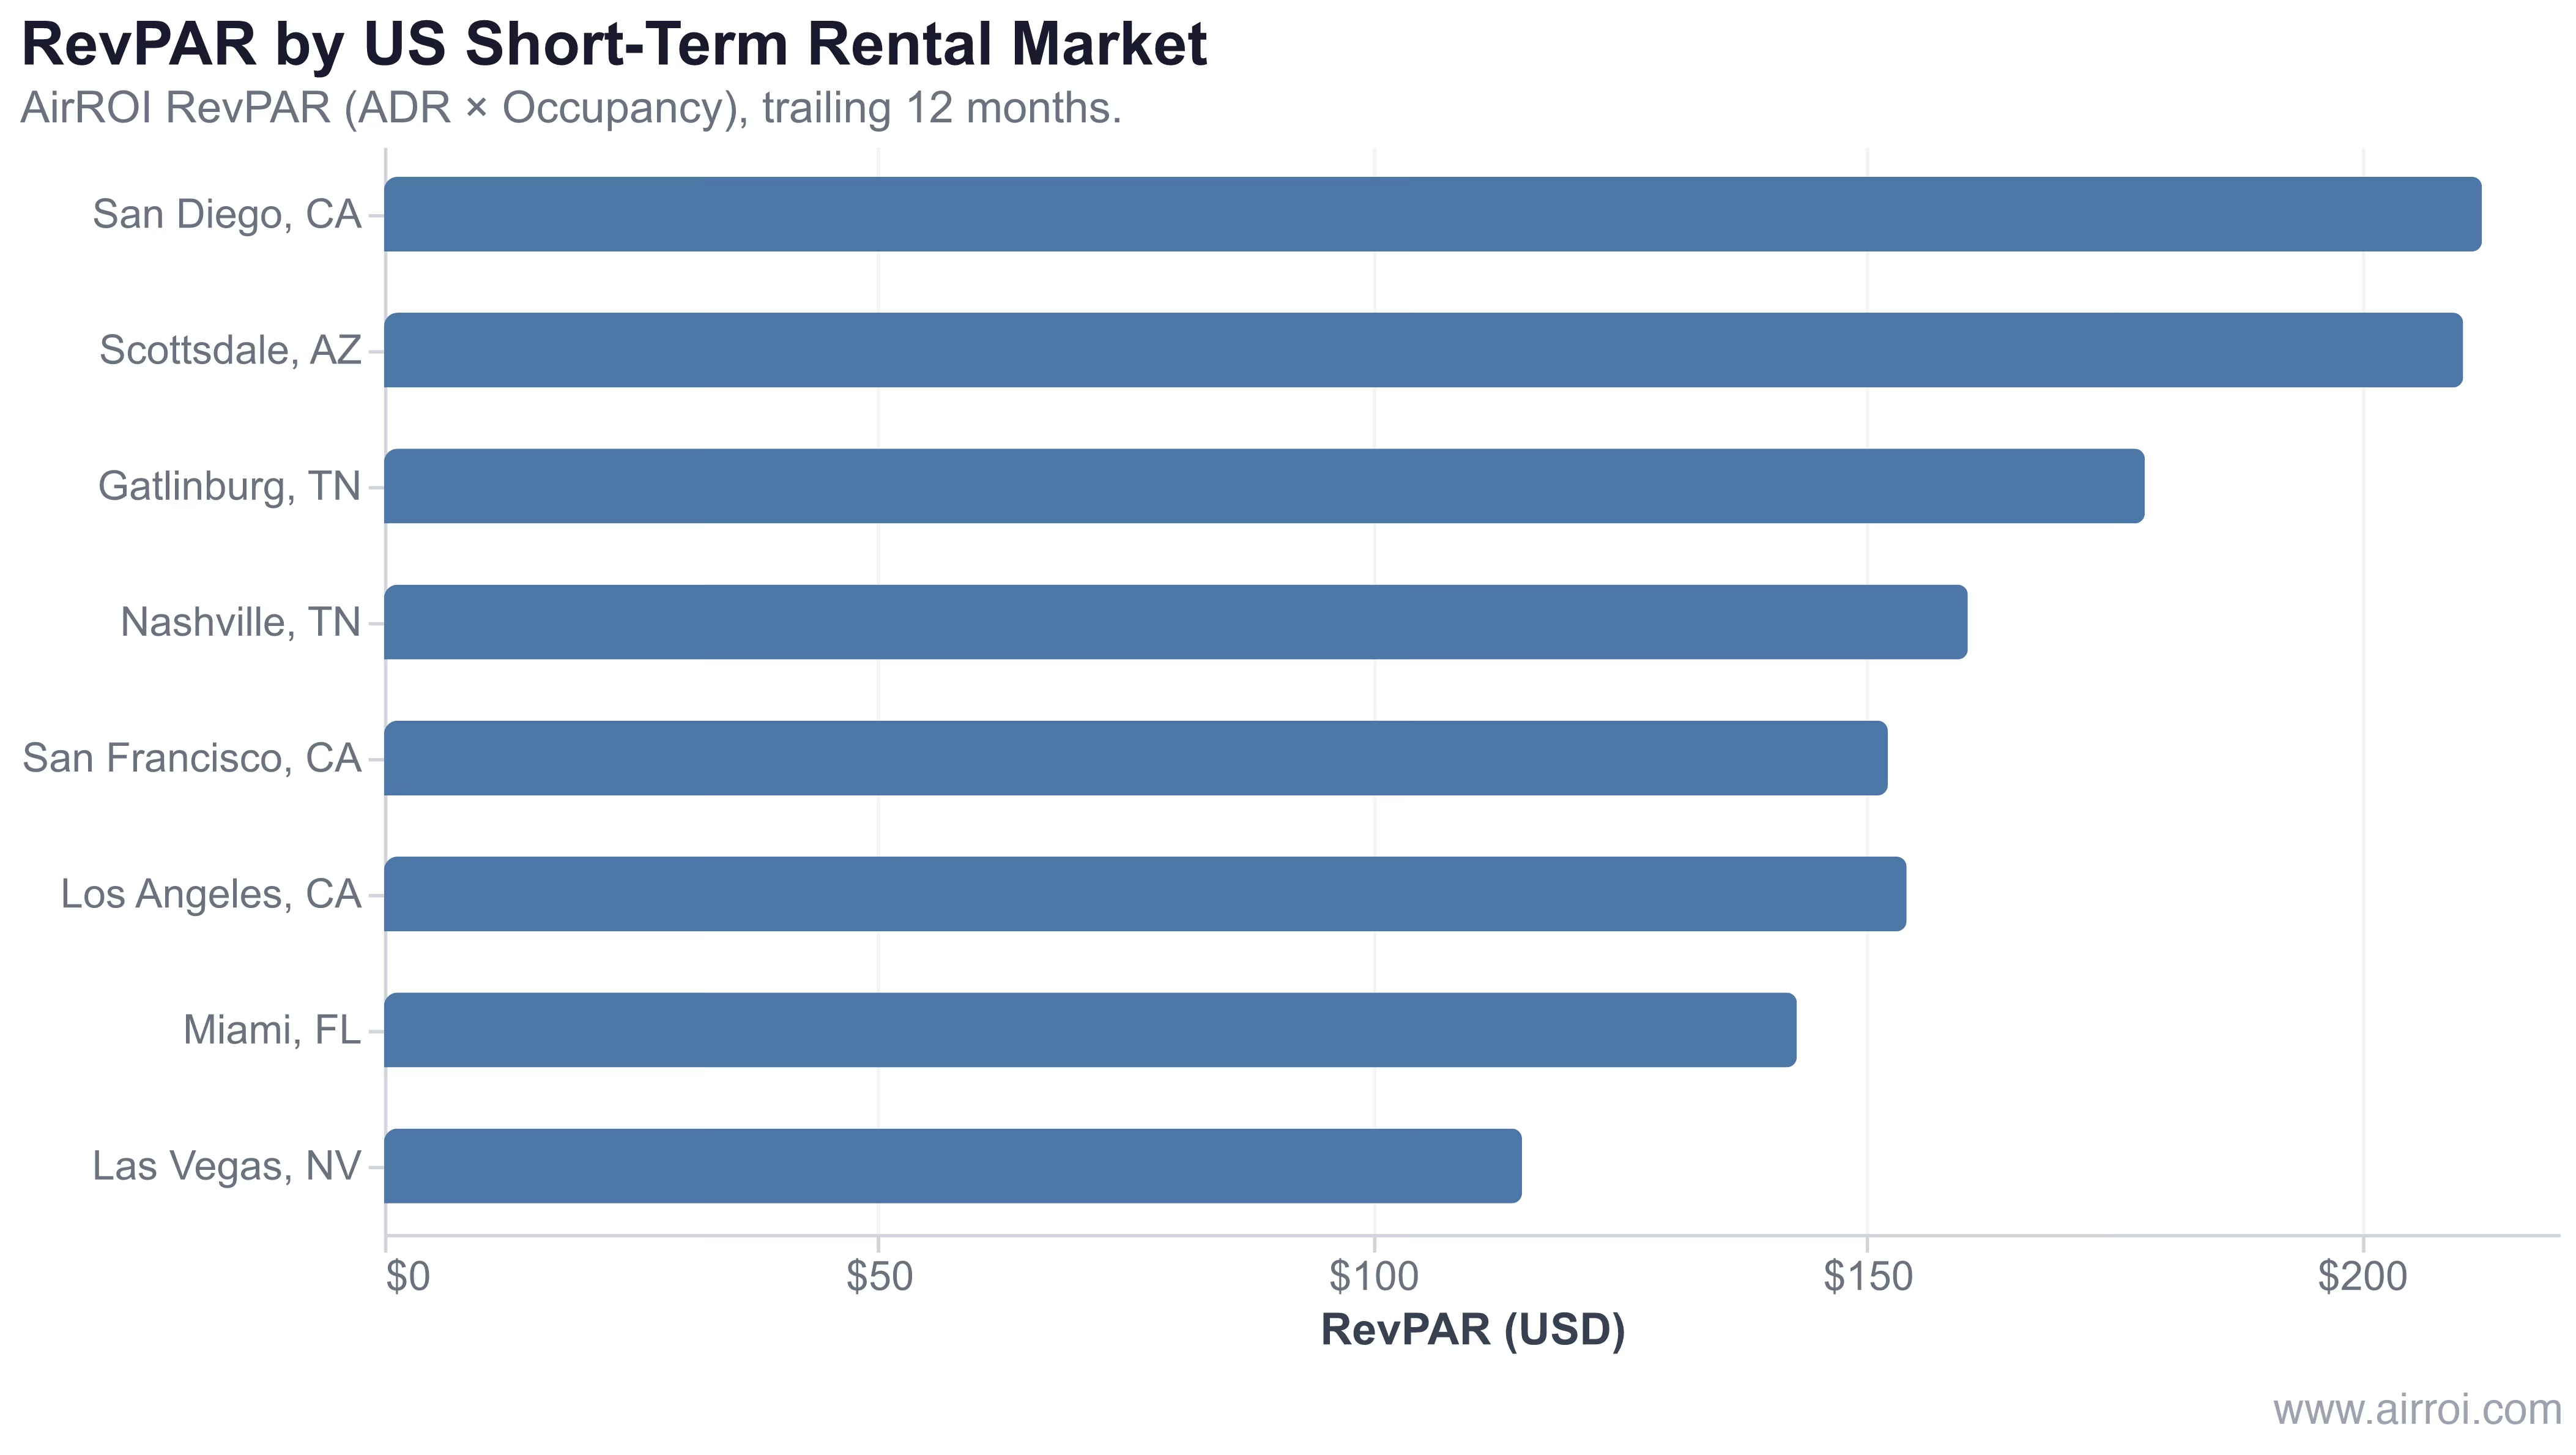
In AirROI's analysis of more than 59,237 active listings across eight US markets, RevPAR ranges from $115.10 in Las Vegas to $212.20 in San Diego — a 84% spread driven by the interaction of local rates and demand depth, not by either factor alone.
| Market | ADR | Occupancy | RevPAR |
|---|---|---|---|
| San Diego, CA | $394.90 | 53% | $212.20 |
| Scottsdale, AZ | $421.10 | 49% | $210.30 |
| Gatlinburg, TN | $376.50 | 47% | $178.10 |
| Nashville, TN | $353.60 | 47% | $160.20 |
| Los Angeles, CA | $311.60 | 48% | $154.00 |
| San Francisco, CA | $273.50 | 55% | $152.10 |
| Miami, FL | $291.00 | 49% | $142.90 |
| Las Vegas, NV | $274.20 | 42% | $115.10 |
San Francisco's RevPAR ($152.10) sits below San Diego ($212.20) despite having the highest occupancy rate in the dataset (55%). The culprit is San Francisco's lower ADR relative to its property costs — a reminder that RevPAR reflects real demand conditions, not just headline rate potential.
RevPAR is the one number that tells you whether your pricing strategy is working — a rising ADR paired with falling occupancy produces a flat or declining RevPAR, which is the earliest warning that your rate floor has moved above what the market will bear.
How Superhost Status Affects RevPAR
| Market | Superhost RevPAR | Non-Superhost RevPAR | Premium |
|---|---|---|---|
| Scottsdale, AZ | $241.90 | $137.00 | +77% |
| Gatlinburg, TN | $201.80 | $137.50 | +47% |
| Nashville, TN | $169.70 | $134.40 | +26% |
How Regulation Compresses RevPAR
Using RevPAR to Improve Performance
RevPAR improvement comes from moving ADR, occupancy, or both. The three levers that work in practice:
Minimum-night management directly controls vacancy. Platforms like Airbnb fill short gaps between bookings when minimum-night requirements are flexible; hosts who reduce minimums on orphan-night windows recover 8–15 booked nights annually that would otherwise sit dark.
Frequently Asked Questions
A good RevPAR depends on your market. AirROI data shows trailing-12-month medians ranging from $115 in Las Vegas to $212 in San Diego. Compare within your market — a $130 RevPAR in Nashville is respectable, while the same number in San Diego signals underperformance relative to peers.
ADR measures average revenue per booked night only — it ignores vacancy. RevPAR accounts for every available night, booked or not. RevPAR = ADR × occupancy rate. A property with a $200 ADR but only 60% occupancy has a RevPAR of $120, exposing the 40% of nights generating zero income.
Raise RevPAR by improving either ADR or occupancy — or both simultaneously. Dynamic pricing closes the gap between peak and shoulder periods. Reducing minimum-night requirements fills short gaps. Superhost status lifts both metrics: AirROI data shows Scottsdale Superhosts achieve a $241.90 RevPAR versus $137.00 for non-Superhosts.
RevPAR reflects both local rate levels and demand depth, so cross-market comparisons require context. A $160 RevPAR in Nashville and a $152 RevPAR in San Francisco reflect very different cost structures and regulatory environments. RevPAR is most reliable as an intra-market ranking tool and a trend indicator for a single property over time.
Restrictive regulation compresses RevPAR indirectly: supply falls (fewer competing listings), but demand also falls because guests can't find short-stay options. New York City's Local Law 18 pushed median minimum nights to 25.8 nights and cut active listings by roughly 60%, producing a market RevPAR of $120.50 — below comparably priced metros with lighter regulation.