
Gross Revenue
Gross revenue is the total income generated from short-term rental bookings before deducting any expenses, fees, or taxes. It is the sum of every dollar a guest pays — nightly rates, cleaning fees, pet fees, and extra-guest charges — making it the top-line figure that every other financial metric for an STR property builds upon.
Key Takeaways
- Gross revenue = nightly revenue + cleaning fees + all ancillary guest charges; no expenses deducted
- It is the starting point for calculating NOI, cap rate, and cash-on-cash return
- AirROI data shows US market medians ranging from $27,540 (Denver) to $53,472 (San Diego) in trailing 12-month annual gross revenue
- Gross revenue is driven by two levers: ADR (pricing) and occupancy rate (volume)
- Never confuse gross revenue with net revenue — platform commissions, cleaning costs, and operating expenses are excluded from gross
How to Calculate Gross Revenue
The formula is straightforward:
Gross Revenue = Nightly Revenue + Cleaning Fees + Ancillary Fees
In practice, every line item on a guest's booking confirmation contributes to gross revenue.
Example — monthly calculation:
| Component | Amount |
|---|---|
| Nightly revenue (22 nights × $185 avg) | $4,070 |
| Cleaning fees (8 bookings × $120) | $960 |
| Extra guest fees | $210 |
| Pet fees | $75 |
| Gross Revenue | $5,315 |
This $5,315 is your gross revenue for the month. Multiply similar months across a full year to arrive at annual gross revenue, which is the figure investors, lenders, and platforms use to evaluate an STR property's income potential.
Annual Gross Revenue Across US Markets
Revenue varies dramatically by location. The chart below compares AirROI's trailing-12-month median annual gross revenue per active listing across seven markets from the basket.
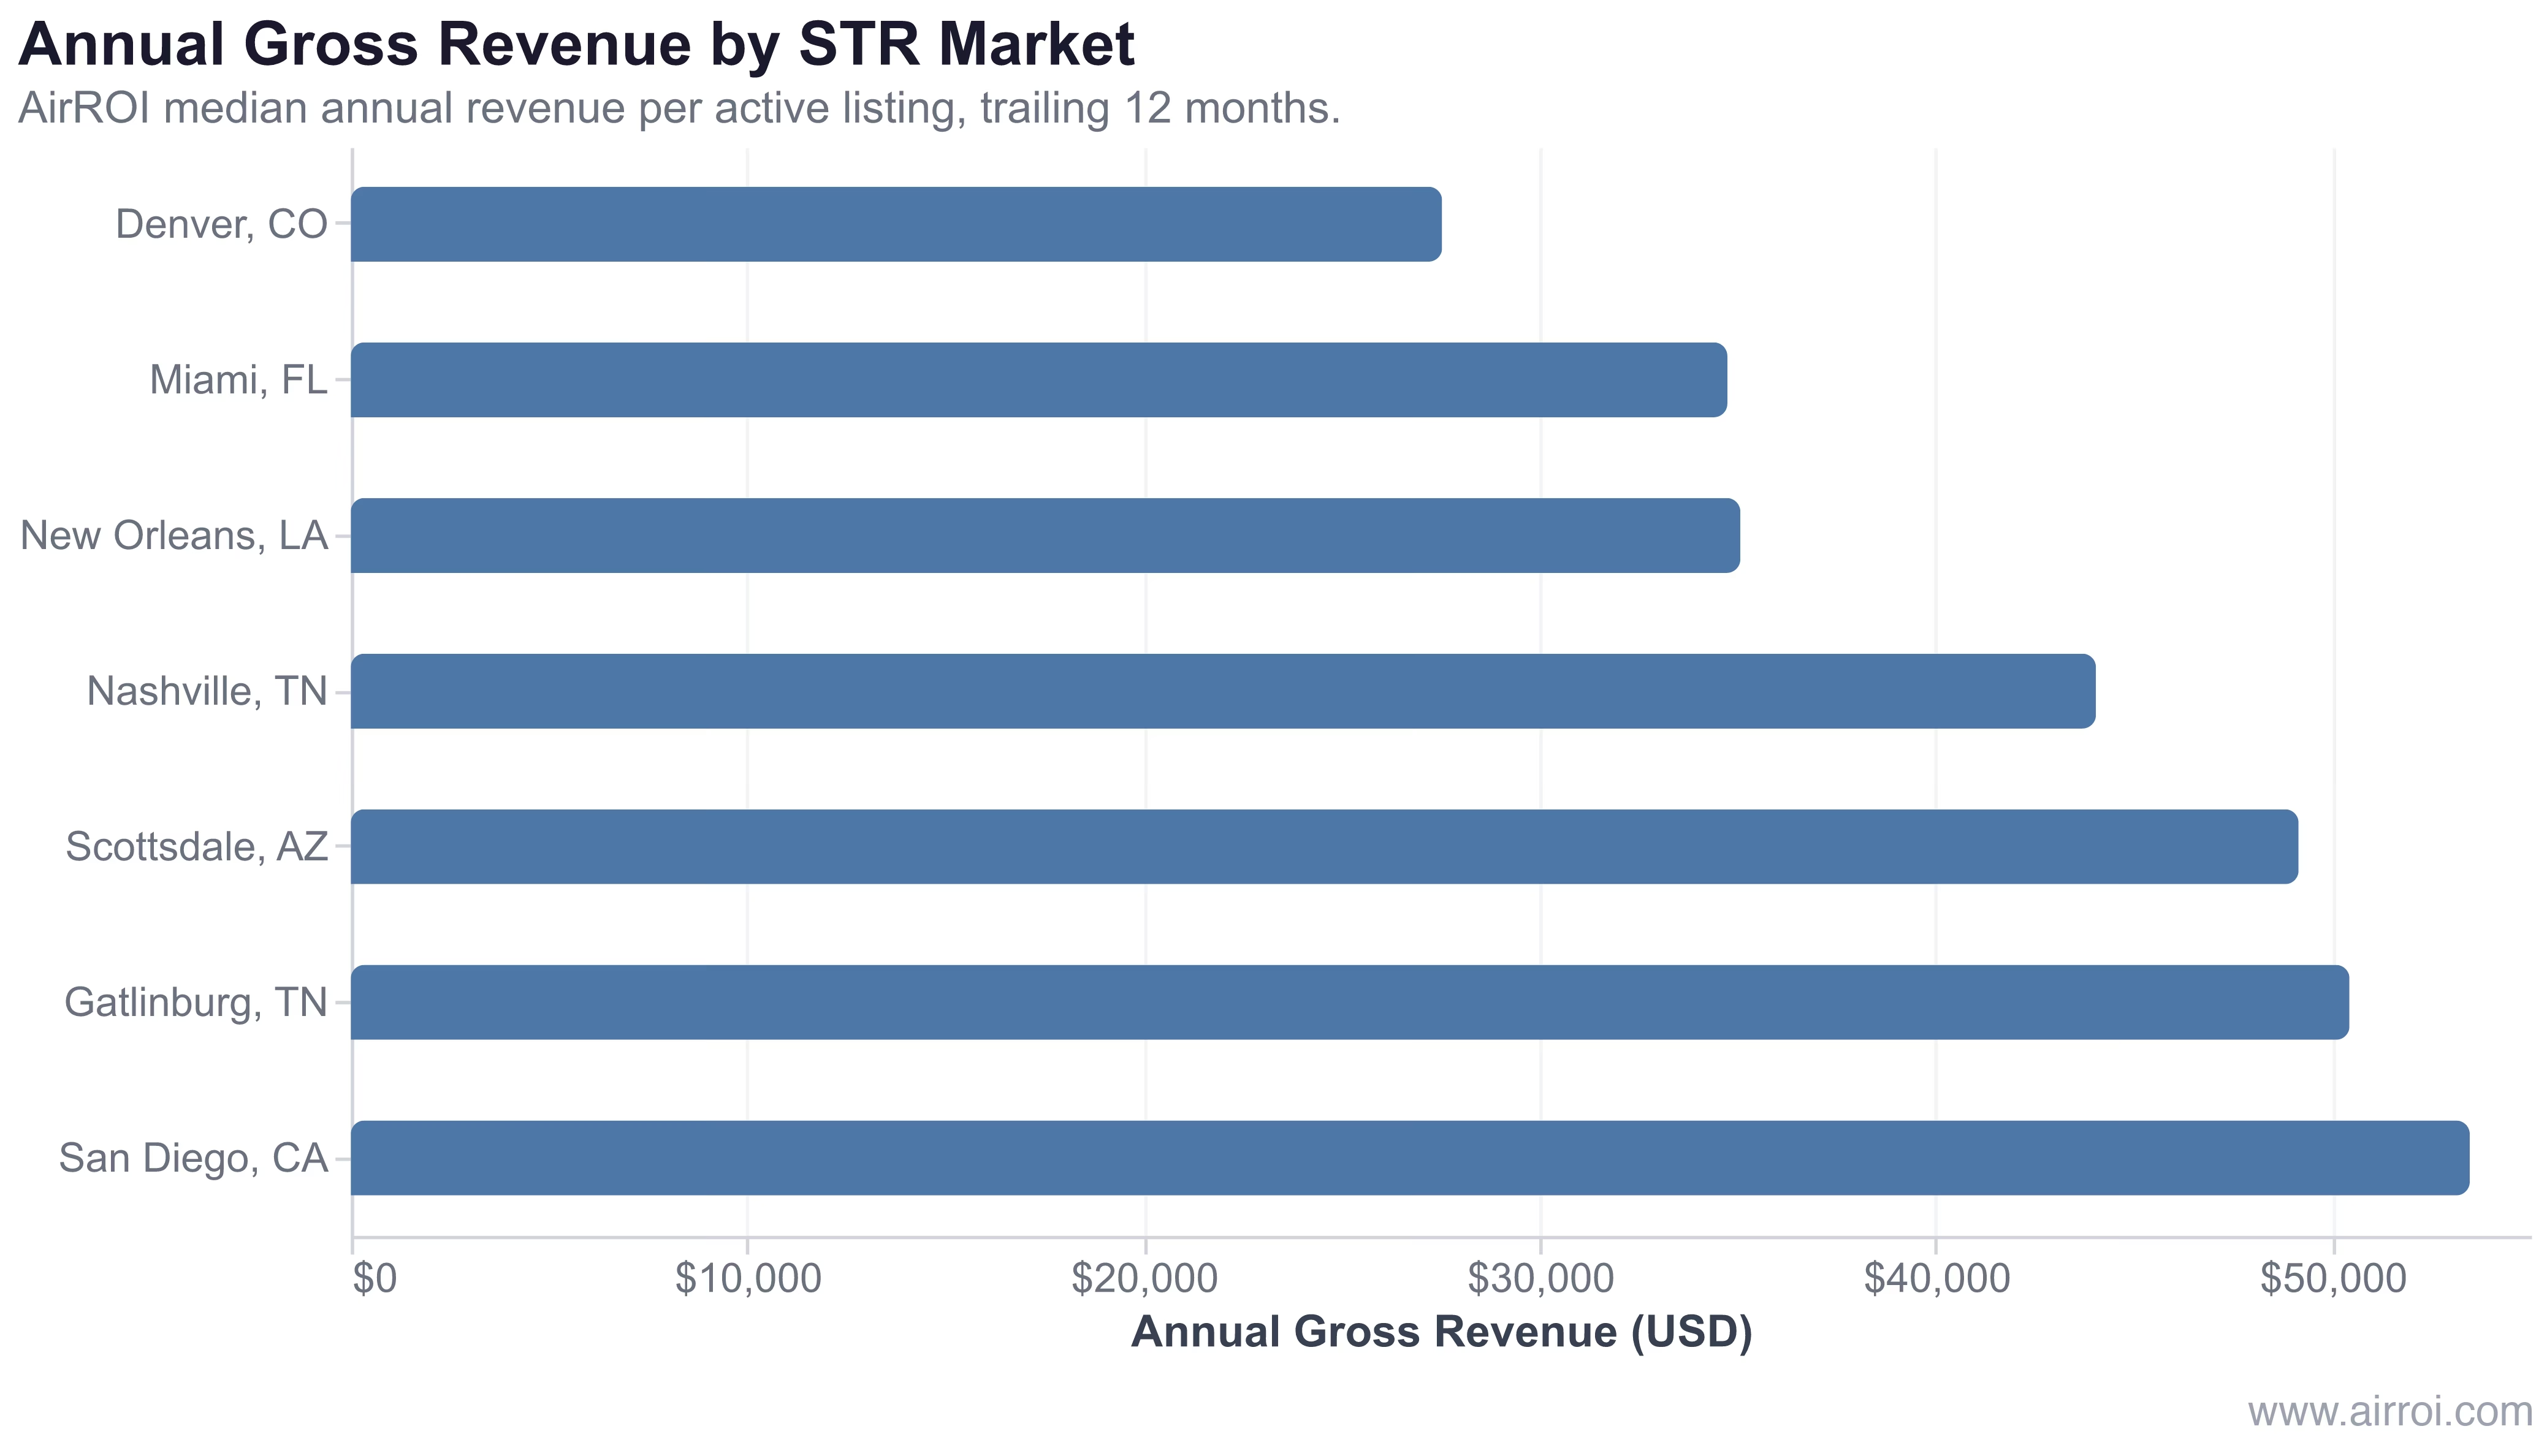
In AirROI's analysis of more than 43,000 active listings across these seven markets, San Diego leads at $53,472 in annual gross revenue, followed by Gatlinburg, TN ($50,438) and Scottsdale, AZ ($49,153). Denver sits at the lower end with $27,540 — not because listings underperform, but because Denver's ADR ($221.50) is substantially lower than San Diego's ($394.90). Volume alone cannot compensate for a 78% gap in nightly rate.
Gross revenue is as much a pricing story as a booking story — two markets with identical occupancy rates can differ by $25,000 in annual income purely because of ADR.
Gross Revenue vs. Net Revenue
The distinction matters most when evaluating investment returns. Gross revenue is the top line; net revenue (or net operating income) is what you actually keep.
| Metric | What it includes | Excludes |
|---|---|---|
| Gross revenue | All guest payments | All expenses |
| Net revenue | Gross revenue minus operating costs | Mortgage payments |
| Net operating income (NOI) | Revenue minus all operating expenses | Financing costs |
What Drives Gross Revenue
Gross revenue has two structural levers and one ancillary channel:
2. Occupancy Rate At 53% occupancy, San Diego listings produce income on 194 nights per year. Closing that gap by even 5 percentage points adds roughly $3,700 in nightly revenue at San Diego ADR. Reducing minimum-night requirements during soft periods and offering gap-night discounts are the fastest structural fixes.
Gross Revenue Benchmarks by Market Type
The table below reflects AirROI trailing-12-month medians for all active listings by market archetype:
| Market archetype | Annual gross revenue range | Notes |
|---|---|---|
| Coastal vacation (San Diego) | $50,000–$65,000+ | High ADR, moderate occupancy |
| Resort/cabin (Gatlinburg, Scottsdale) | $44,000–$55,000 | Dual-season demand, strong ancillary |
| Entertainment cities (Nashville, Miami, New Orleans) | $34,000–$45,000 | Event-driven peaks, competitive supply |
| Mountain/urban (Denver) | $25,000–$32,000 | Lower ADR, steady year-round bookings |
Why Gross Revenue Matters Beyond Cash Flow
- Lender underwriting: Most DSCR lenders use projected STR gross revenue (discounted by a vacancy factor) to determine loan eligibility and sizing. Higher gross revenue directly supports a larger loan.
- Property valuation: The income approach values an STR as NOI ÷ cap rate. Because NOI derives from gross revenue, every dollar of top-line income improvement compounds into property value.
- Performance benchmarking: Comparing your annual gross revenue to market medians — available in AirROI's Atlas — reveals whether you are outperforming or underperforming comparable listings.
- Tax basis: Gross rental income is the starting point for Schedule E reporting, QBI deductions, and depreciation calculations. Accurate gross revenue tracking is a compliance requirement, not just a performance metric.
Frequently Asked Questions
Gross revenue includes all income collected from guests: nightly rates, cleaning fees, extra guest fees, pet fees, and any other charges billed at booking. It does not deduct platform commissions, property management fees, mortgage payments, or operating costs — those come out of gross revenue to produce net revenue.
Add every dollar collected from guest reservations in a given period — nightly revenue, cleaning fees, and ancillary charges. A listing with 22 booked nights at a $185 average, 8 cleaning fees at $120, plus $285 in pet and extra-guest fees produces $4,070 + $960 + $285 = $5,315 in monthly gross revenue.
Gross revenue is total guest income before any deductions. Net revenue is what remains after subtracting all expenses — platform fees, cleaning costs, maintenance, insurance, mortgage, and taxes. Net revenue represents actual take-home profit; gross revenue is the starting line every other financial metric builds upon.
AirROI's trailing-12-month data shows wide variation by market: San Diego listings earn a median $53,472 per year, Gatlinburg $50,438, Scottsdale $49,153, and Nashville $44,039, while Denver averages $27,540. Location, property type, ADR, and occupancy rate are the primary drivers of gross revenue.
Gross revenue = ADR × occupied nights + ancillary fees. RevPAR (revenue per available room) normalizes gross revenue by total available nights, making cross-property comparisons fair regardless of size or booking pace. ADR captures pricing power; occupancy drives volume; RevPAR and gross revenue together reveal overall market position.