Net Operating Income (NOI)
Key Takeaways
- NOI equals gross rental revenue minus all operating expenses, excluding mortgage payments, income taxes, and capital expenditures
- NOI is the numerator in the cap rate formula; improving NOI directly increases what your property is worth
- AirROI data shows median NOI ranging from roughly $12,400 in Denver to $24,000 in San Diego across active STR markets — driven more by ADR and occupancy than by expense management
- Healthy NOI margins for STRs run 35%–55% of gross revenue; self-managed properties reach the top of that range, fully managed ones the bottom
- NOI is not cash flow — subtract your debt service from NOI to find the money that actually stays in your account each month
How to Calculate NOI
NOI = Gross Rental Revenue − Operating Expenses
Gross revenue includes nightly rental income, cleaning fees passed to guests, pet fees, and any ancillary income (early check-in, late checkout, etc.). Operating expenses cover everything required to keep the property running — but not the mortgage.
Revenue Components
| Revenue Source | Description |
|---|---|
| Nightly rental income | Total booking revenue across all platforms |
| Cleaning fee income | Cleaning fees collected from guests |
| Ancillary fees | Pet fees, early check-in, late checkout, etc. |
Operating Expense Components
| Expense Category | Typical % of Gross Revenue |
|---|---|
| Property management | 10% – 25% |
| Cleaning costs | 8% – 15% |
| Platform / booking fees | 3% – 5% |
| Property taxes | 5% – 12% |
| Insurance | 2% – 4% |
| Utilities | 3% – 7% |
| Maintenance and repairs | 5% – 10% |
| Supplies and amenities | 2% – 4% |
| HOA fees (if applicable) | Varies |
| Marketing and photography | 1% – 3% |
Example Calculation
| Item | Annual Amount |
|---|---|
| Gross rental revenue | $85,000 |
| Property management (20%) | −$17,000 |
| Cleaning costs | −$9,600 |
| Platform fees (3%) | −$2,550 |
| Property taxes | −$5,500 |
| Insurance | −$2,400 |
| Utilities | −$4,200 |
| Maintenance | −$4,000 |
| Supplies | −$1,800 |
| Net Operating Income | $37,950 |
| NOI Margin | 44.6% |
Estimated NOI Across STR Markets
NOI is only as meaningful as the revenue that feeds it. In AirROI's analysis of more than 44,000 active listings across seven US markets, median annual revenue spans from $27,500 in Denver to $53,500 in San Diego — and that spread carries directly into NOI.
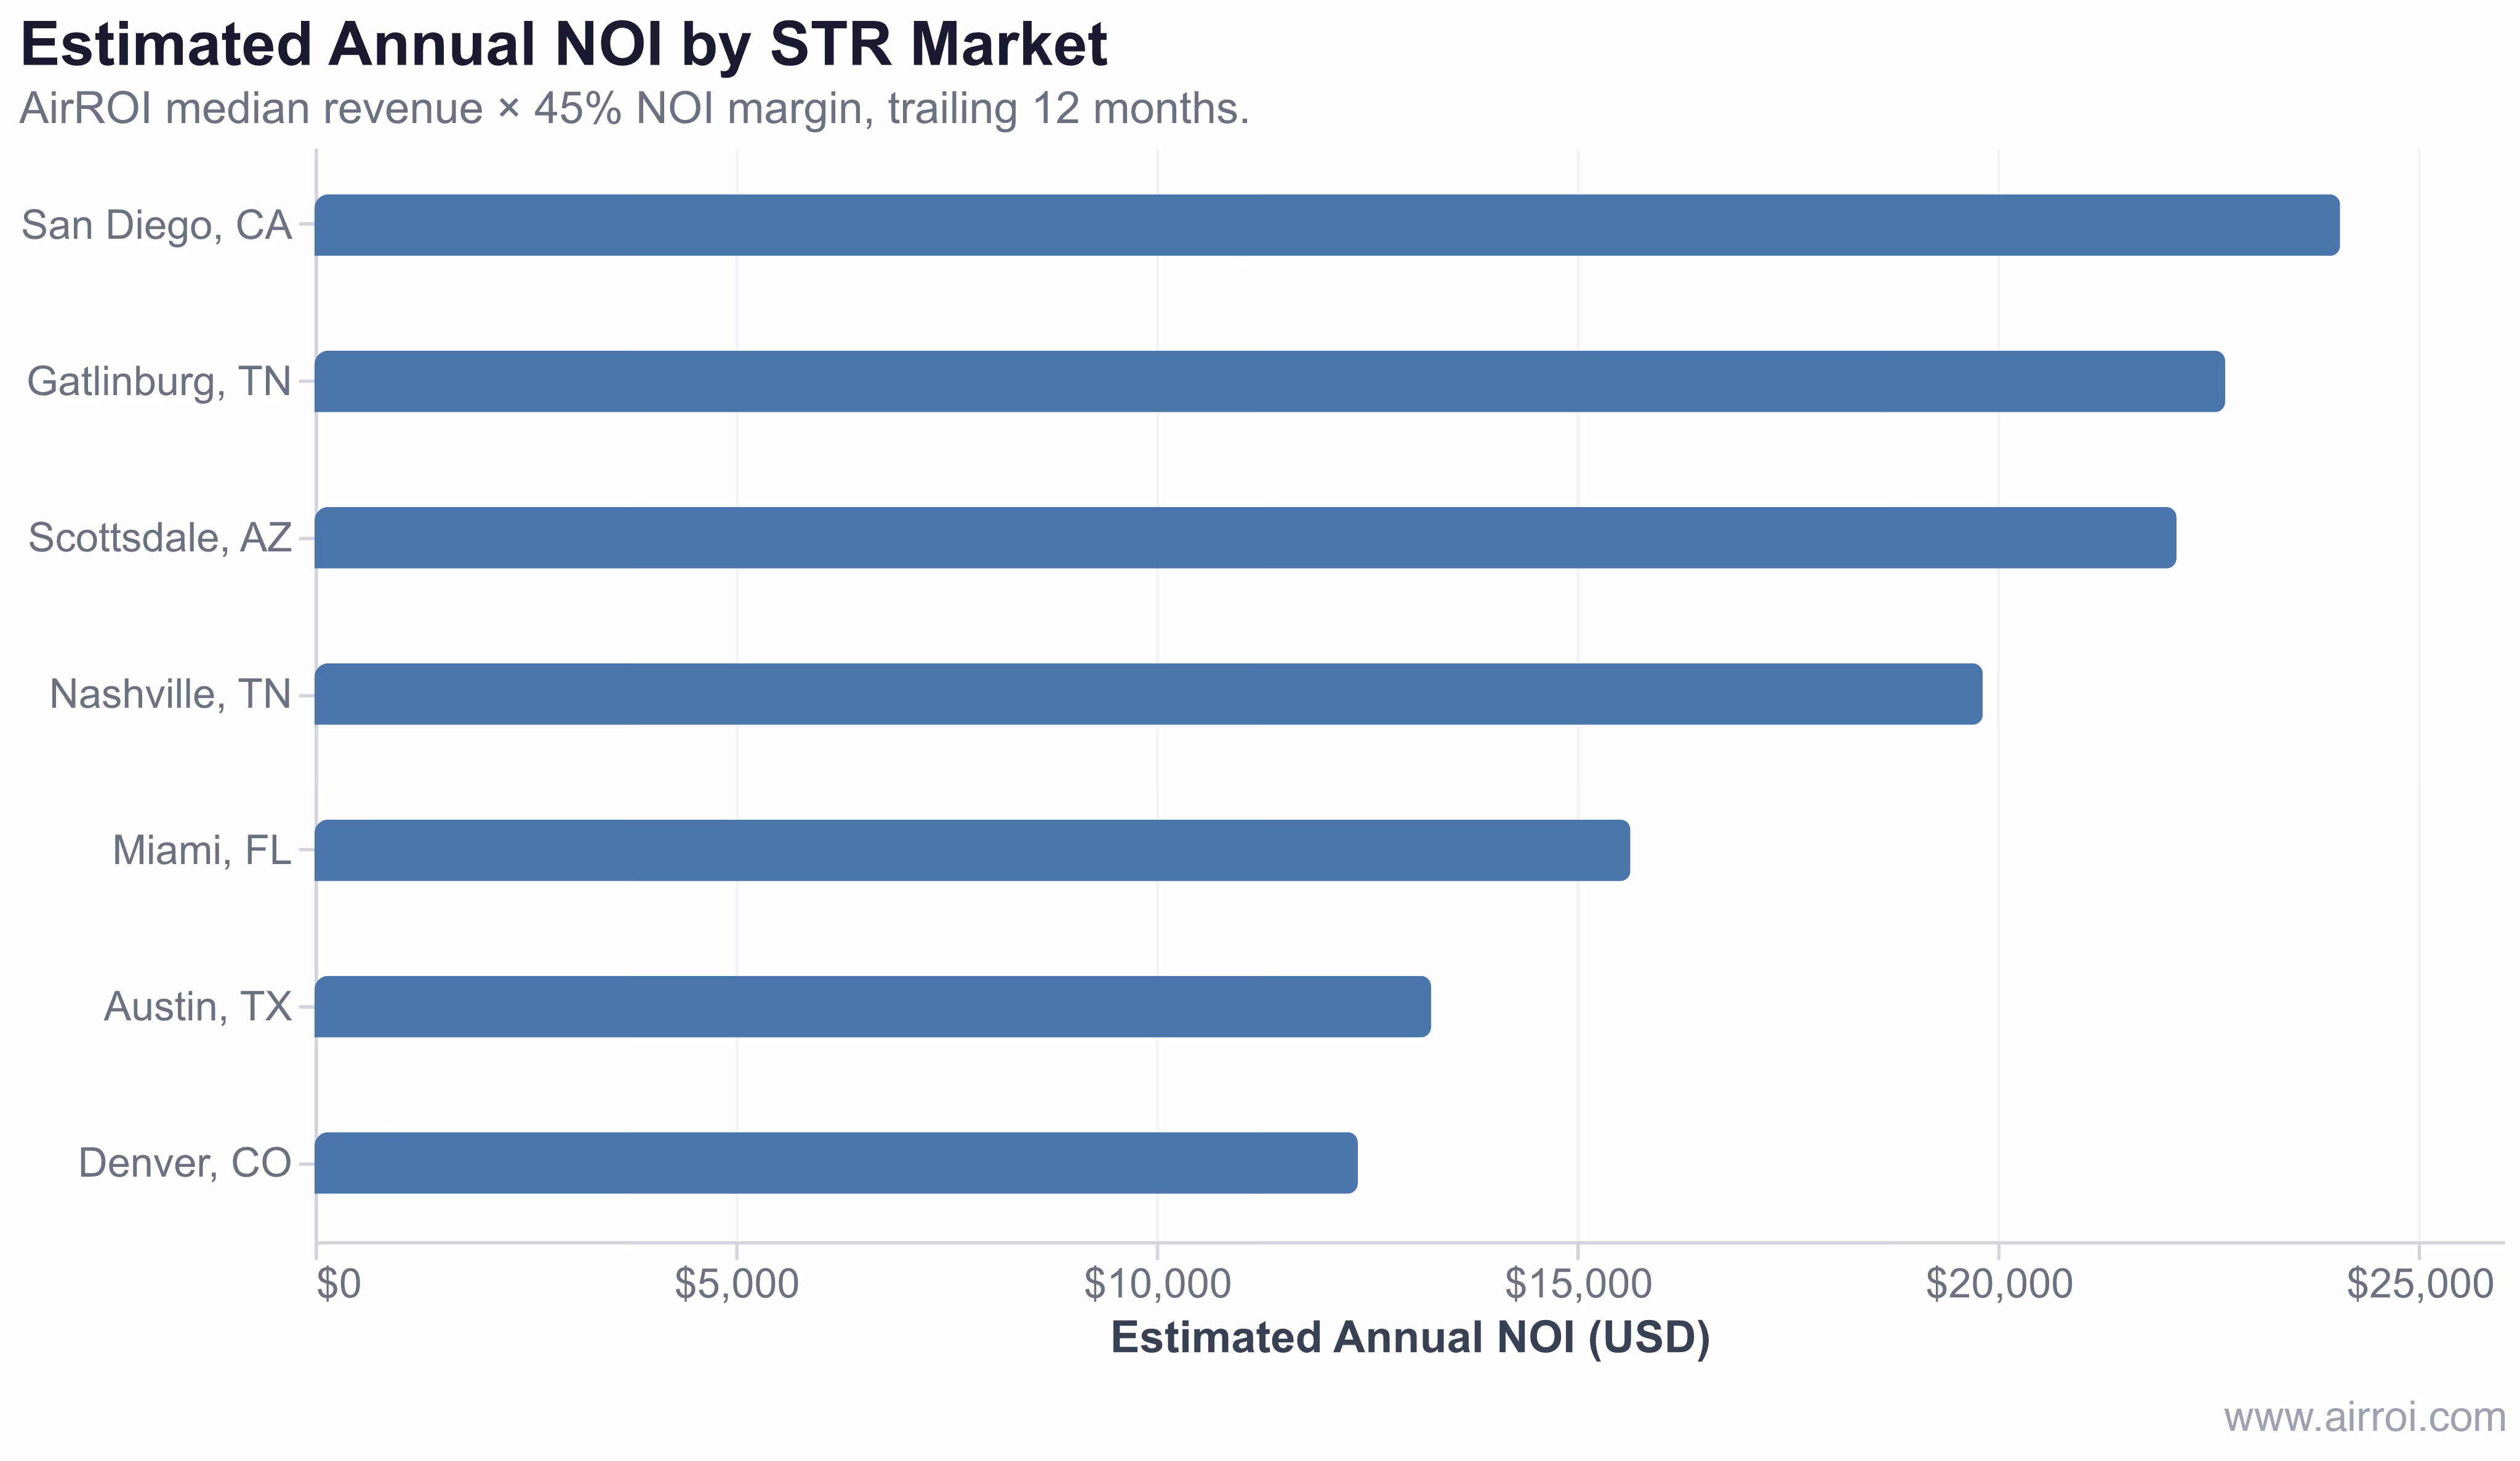
Applying a 45% NOI margin to AirROI's trailing-12-month median revenue for each market:
| Market | Median Annual Revenue | Estimated NOI (45%) | Active Listings |
|---|---|---|---|
| San Diego, CA | $53,472 | $24,062 | 9,560 |
| Gatlinburg, TN | $50,438 | $22,697 | 3,622 |
| Scottsdale, AZ | $49,153 | $22,119 | 4,310 |
| Nashville, TN | $44,039 | $19,818 | 6,165 |
| Miami, FL | $34,738 | $15,632 | 7,905 |
| Austin, TX | $29,474 | $13,263 | 8,774 |
| Denver, CO | $27,540 | $12,393 | 3,739 |
San Diego's median listing produces nearly twice the estimated NOI of Denver's — not because San Diego operators run leaner, but because higher ADR ($394.9 vs. $221.5) compounds through every booking night. Revenue is the dominant lever in NOI; expenses are the fine-tuning.
NOI vs. Cash Flow: The Distinction That Matters
Cash Flow = NOI − Debt Service (Principal + Interest)
NOI Margin Benchmarks by Management Style
| Management Style | Typical NOI Margin | Key Factors |
|---|---|---|
| Self-managed | 45% – 55% | No management fee; higher time commitment |
| Hybrid management | 38% – 48% | Partial outsourcing (cleaning, maintenance) |
| Full professional management | 30% – 42% | 15–25% management fee; less owner involvement |
Why NOI Is the Foundation of STR Valuation
Property appraisers and commercial lenders value income-producing real estate using the income approach:
Property Value = NOI ÷ Cap Rate
Improving NOI: Revenue First, Expenses Second
- Optimize ADR before cutting costs: Increasing revenue through dynamic pricing and demand-aligned minimum nights has a direct dollar-for-dollar impact on NOI. Cutting expenses has diminishing returns once obvious waste is eliminated.
- Audit expenses quarterly: Review every expense line to catch subscription creep, vendor price increases, and duplicated services.
- Negotiate vendor contracts annually: Cleaning, landscaping, and maintenance contracts should be competitively bid at least once per year — not auto-renewed.
- Reduce utility costs with automation: Smart thermostats and LED lighting can cut utility spend by 15–25% with a payback period under two years.
- Track NOI margin, not just NOI dollars: A property earning $50,000 NOI on $150,000 revenue (33% margin) has a cost problem compared to one earning $40,000 NOI on $80,000 revenue (50% margin).
Frequently Asked Questions
NOI deducts all operating expenses: property taxes, insurance, property management fees, cleaning costs, maintenance and repairs, utilities, HOA fees, landscaping, pest control, supplies, platform fees, and marketing. NOI excludes mortgage payments (principal and interest), income taxes, capital expenditures, and depreciation.
A healthy STR NOI margin is 35% to 55% of gross revenue. Self-managed properties tend to reach 45–55%, while fully managed properties land at 30–45% after a 15–25% management fee. In AirROI's data, markets like San Diego and Gatlinburg generate enough revenue that a 45% margin still produces $22,000–$24,000 in annual NOI per median listing.
NOI is revenue minus operating expenses, calculated before any mortgage payments. Cash flow subtracts the debt-service cost (principal + interest) from NOI. A property can carry a positive NOI and still produce negative cash flow if the loan payment is too high. NOI is used for valuation and cap rate; cash flow tells you what stays in your pocket each month.
Divide annual NOI by the prevailing cap rate for the market: Value = NOI ÷ Cap Rate. A property generating $22,000 NOI in a market with a 5% cap rate implies a value of $440,000. This income-approach valuation is what lenders and appraisers use, so improving NOI directly increases the property's appraised value and refinance potential.
Revenue growth beats cost cutting because every extra dollar of revenue flows directly to NOI, while cutting expenses has diminishing returns once the obvious waste is eliminated. Dynamic pricing that closes the gap between your average daily rate and market peak rates is the highest-leverage lever — even a 10% ADR improvement on a $44,000 revenue property adds $4,400 to annual NOI before any cost changes.