
Cap Rate (Capitalization Rate)
Key Takeaways
- Cap rate equals net operating income (NOI) divided by property value, expressed as a percentage
- Higher cap rates signal stronger cash flow; lower cap rates often accompany higher appreciation potential and lower risk
- AirROI data shows STR cap rates ranging from roughly 1% in San Francisco to nearly 5% in Nashville on a city-median basis — the spread is driven mostly by home prices, not rents
- Cap rate ignores financing, so pair it with cash-on-cash return when analyzing a leveraged purchase
- Comparing cap rates within the same market is the only reliable way to spot an undervalued investment
How to Calculate Cap Rate
The formula is simple:
Cap Rate = Net Operating Income (NOI) ÷ Property Value × 100
If a vacation rental generates $45,000 in annual NOI and the property is worth $500,000:
Cap Rate = $45,000 ÷ $500,000 × 100 = 9.0%
Real STR Cap Rates by Market
Cap rate is most useful when grounded in real numbers. In AirROI's analysis of more than 33,000 active listings across six US markets, the implied cap rate spread is dramatic — and it is driven far more by purchase price than by rental income.
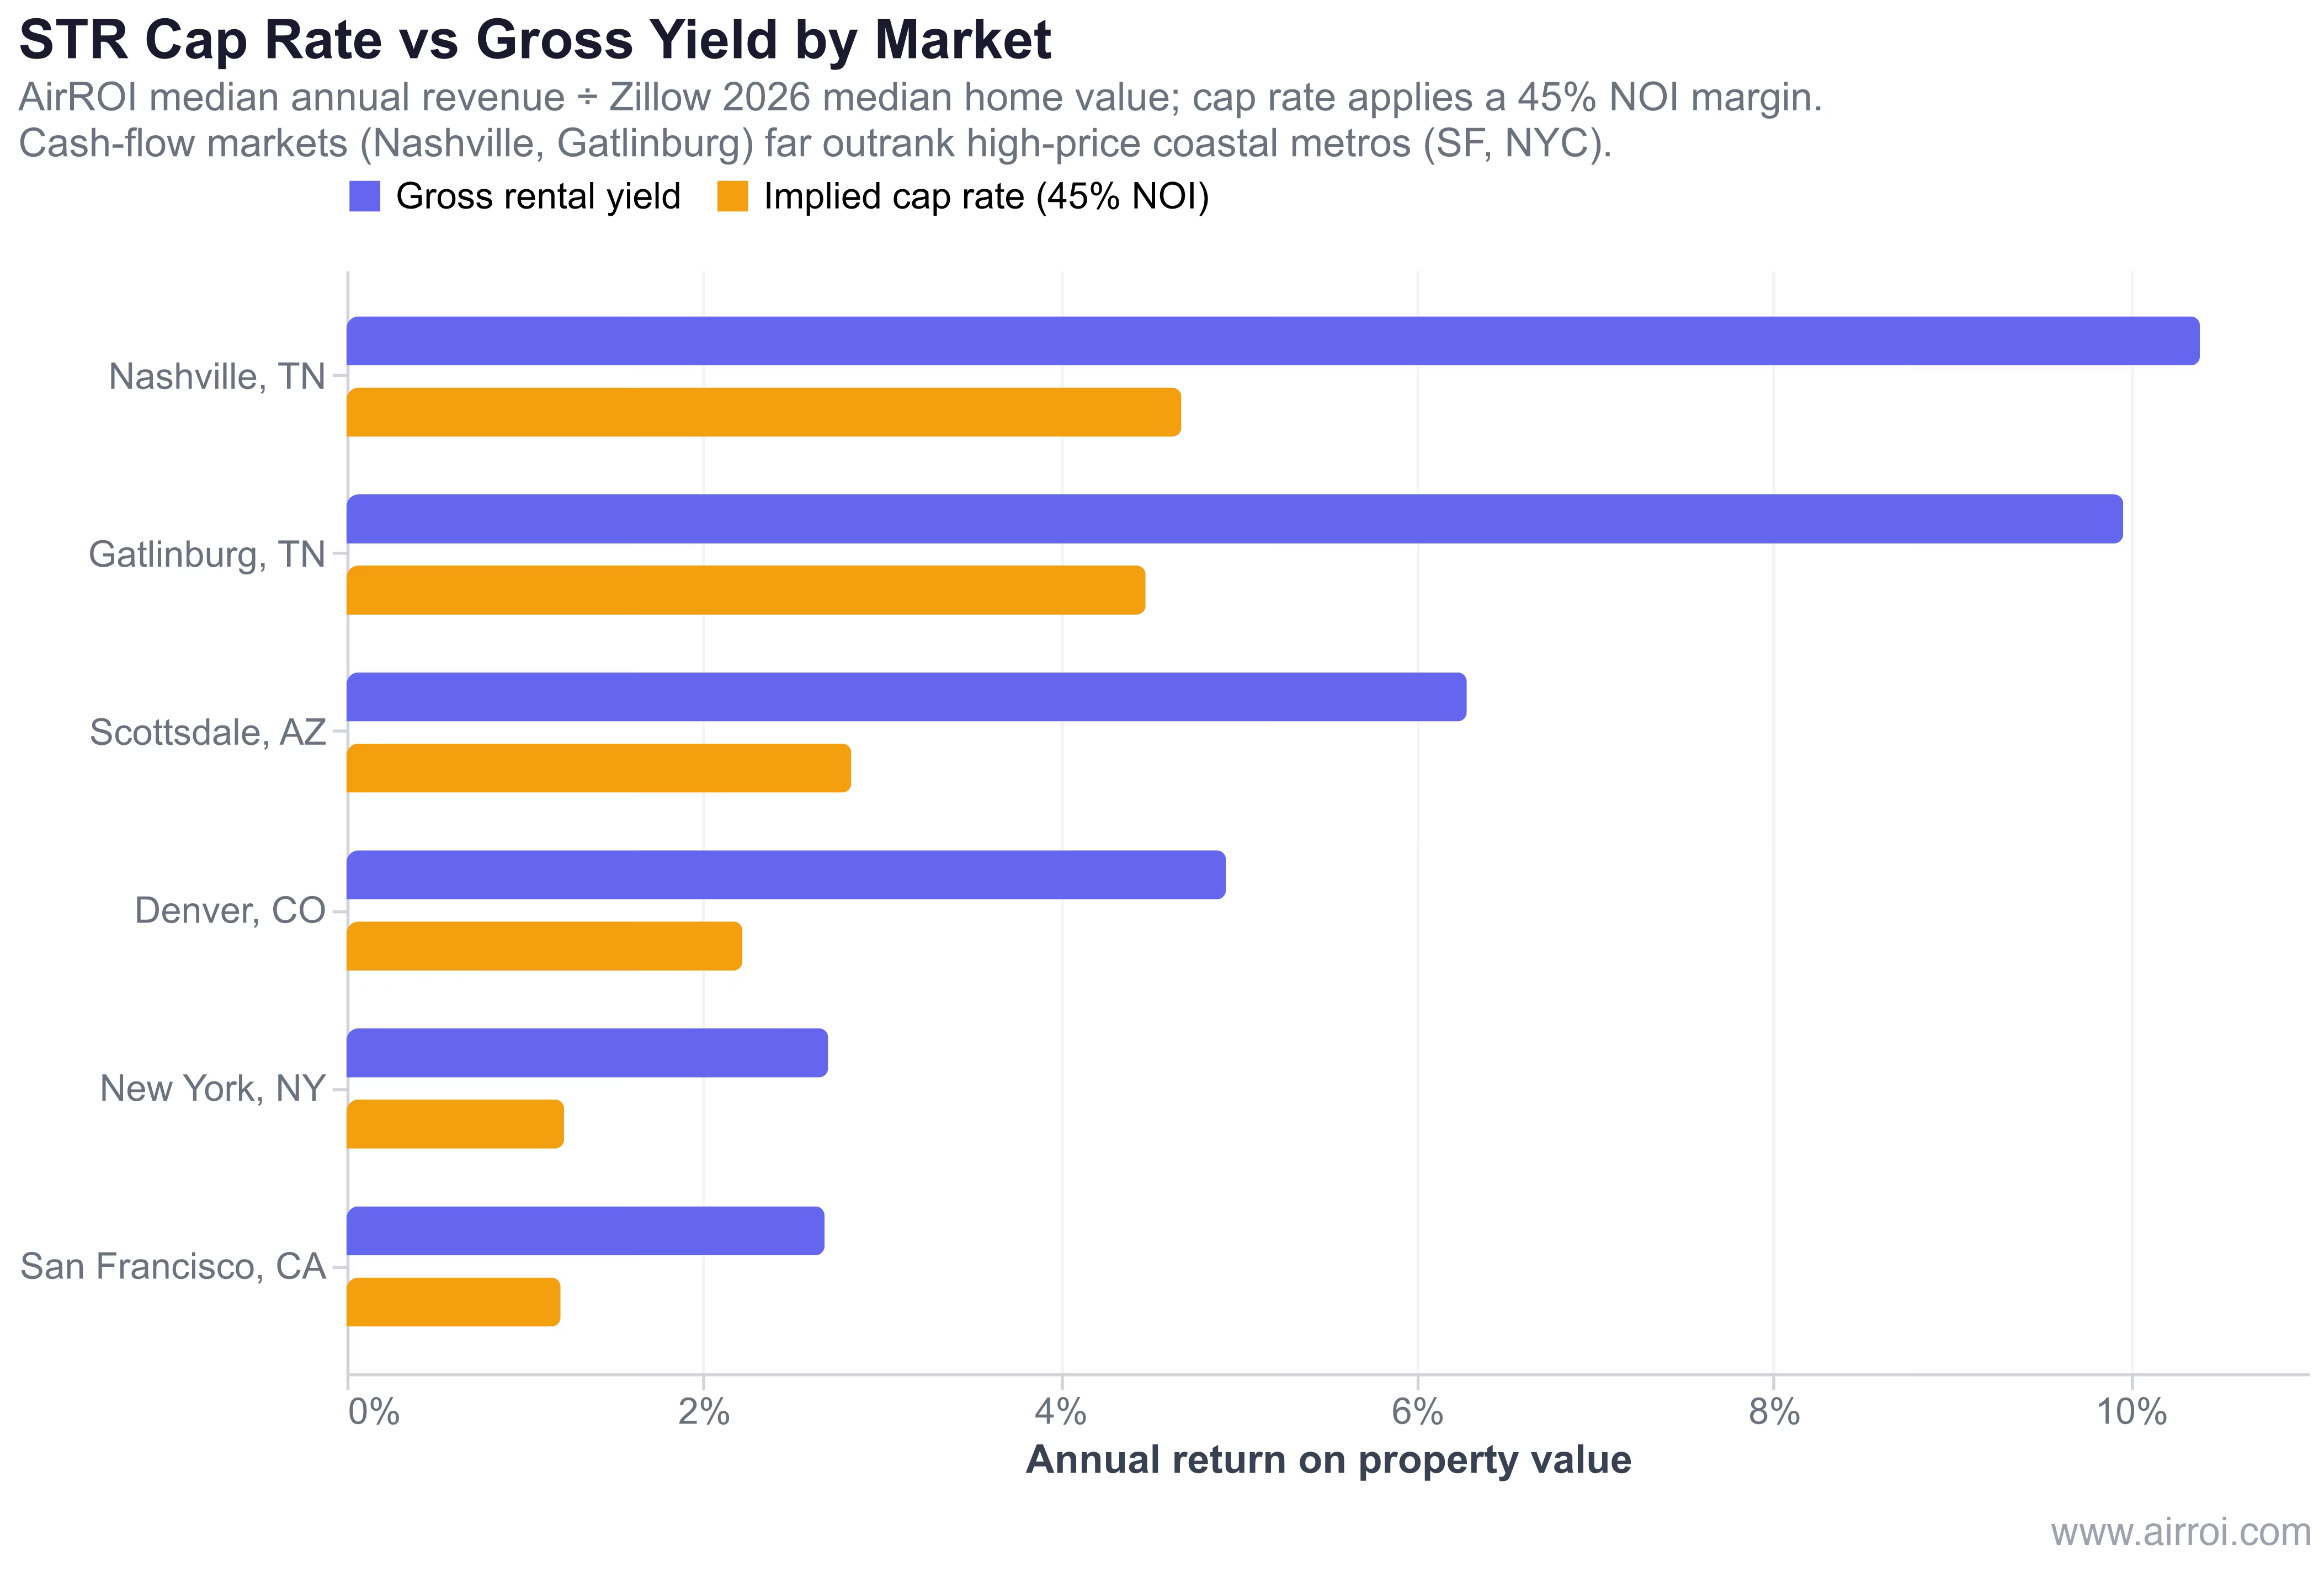
| Market | Median STR revenue | Median home value | Implied cap rate |
|---|---|---|---|
| Nashville, TN | $44,039 | $423,694 | 4.7% |
| Gatlinburg, TN | $50,438 | $506,638 | 4.5% |
| Scottsdale, AZ | $49,153 | $782,937 | 2.8% |
| Denver, CO | $27,540 | $558,705 | 2.2% |
| New York, NY | $21,970 | $812,861 | 1.2% |
| San Francisco, CA | $33,932 | $1,268,418 | 1.2% |
Nashville and San Francisco earn similar STR revenue, yet Nashville's cap rate is nearly four times higher — because a San Francisco home costs three times as much. Cap rate is a price story as much as a revenue story.
Why Cap Rate Matters for Airbnb Hosts
- Quick property comparison: Cap rate lets you compare investment potential across properties instantly, without untangling different financing terms
- Income-approach valuation: Lenders and appraisers value income property as NOI ÷ cap rate, so your cap rate directly shapes what a property is worth
- Market screening: Tracking cap rates across neighborhoods reveals where STR investments offer the best unleveraged returns
- Performance tracking: Recalculating cap rate annually shows whether your property's economics are improving or eroding
Cap Rate Benchmarks by Market Type
The table below reflects investor-grade cap rates — what a competitively priced, well-operated property tends to deliver, which runs higher than the city-median figures above.
| Market Type | Typical Cap Rate Range | Notes |
|---|---|---|
| Major urban (NYC, SF, LA) | 2% - 5% | High prices compress cap rates |
| Mid-size cities (Nashville, Denver) | 5% - 8% | Balance of cash flow and appreciation |
| Vacation/resort markets | 6% - 10% | Higher seasonality risk, stronger yields |
| Emerging/rural markets | 8% - 12% | Lower entry prices, higher yields |
| Luxury properties | 2% - 5% | Premium prices, lower relative NOI |
Tips for Using Cap Rate Effectively
- Always use STR-specific NOI: Long-term-rental estimates understate short-term potential. Use actual or projected STR revenue and the full STR expense load.
- Compare within the same market: A 3% cap rate in San Francisco can outperform a 6% cap rate elsewhere once appreciation is included.
- Pair it with other metrics: Cap rate ignores leverage. Combine it with cash-on-cash return and DSCR for the full picture — DSCR especially matters if you plan to use DSCR financing.
- Account for seasonality: Use full-year NOI that captures both peak and off-season performance.
- Weigh cash flow against appreciation: Low-cap-rate metros often deliver stronger long-term value growth — a tradeoff cap rate alone won't show. Our Airbnb vs. long-term rental comparison walks through how to weigh both.
Frequently Asked Questions
A good short-term rental cap rate is typically 5% to 10%, but it varies sharply by market. Cash-flow markets like Nashville and Gatlinburg reach the high end, while expensive coastal metros such as San Francisco and New York compress to 1-3% because high purchase prices outweigh rental income. Always compare cap rates within the same market, and use an STR-specific NOI rather than long-term-rental assumptions.
Short-term rental cap rates are generally higher than long-term cap rates because STRs produce more gross revenue per year. However, STR operating expenses are also higher due to cleaning, furnishing, utilities, and management. The net effect typically places STR cap rates 2-4 percentage points above comparable long-term rentals in the same market.
Divide the property's annual net operating income (NOI) by its market value or purchase price, then multiply by 100. NOI is gross rental revenue minus all operating expenses, excluding mortgage payments. For example, a property with $19,800 NOI and a $424,000 value has a cap rate of 4.7%. Use projected STR revenue, not long-term rent, for an accurate figure.
Yes. Cap rate moves whenever net operating income or property value changes. If your NOI rises through better revenue management while value holds steady, your cap rate increases. If values appreciate faster than income, the cap rate compresses. Recalculate it annually to track real performance.