
Cash-on-Cash Return
Key Takeaways
- Cash-on-cash return equals annual pre-tax cash flow divided by total cash invested (down payment + closing costs + startup costs), expressed as a percentage
- Unlike cap rate, CoC return accounts for mortgage debt service — the same property produces a different CoC return for every investor depending on financing terms
- Strong STR CoC returns typically range from 8% to 15%; at 2026 mortgage rates near 6.8%, reaching that threshold requires either a larger down payment, below-median purchase prices, or markets with high revenue relative to home values
- Gross revenue is the primary lever: AirROI data shows median annual STR revenue ranging from $21,970 in New York to $50,438 in Gatlinburg across 37,209 active listings
- Pair CoC return with DSCR and total ROI for a complete picture — CoC return measures cash in pocket, not total wealth creation
How to Calculate Cash-on-Cash Return
The formula is:
Cash-on-Cash Return = Annual Pre-Tax Cash Flow ÷ Total Cash Invested × 100
Where:
- Annual Pre-Tax Cash Flow = Gross rental income − operating expenses − annual mortgage payments (principal + interest)
- Total Cash Invested = Down payment + closing costs + furnishing and renovation
Example Calculation — Nashville, TN:
| Item | Amount |
|---|---|
| Median annual STR gross revenue | $44,039 |
| Operating expenses (40% of revenue) | −$17,616 |
| Net operating income | $26,423 |
| Annual mortgage (80% LTV, 6.8%, 30 yr) | −$26,517 |
| Annual pre-tax cash flow | −$94 |
| Down payment (20% of $423,694) | $84,739 |
| Closing costs (3%) | $12,711 |
| Furnishing and startup | $15,000 |
| Total cash invested | $112,450 |
Cash-on-Cash Return ≈ −0.1% at city-median prices and 80% LTV financing.
The Gross Revenue Foundation
Cash-on-cash return starts with gross revenue. Markets with higher STR revenue relative to home prices produce better CoC economics — the spread across AirROI's data is substantial.
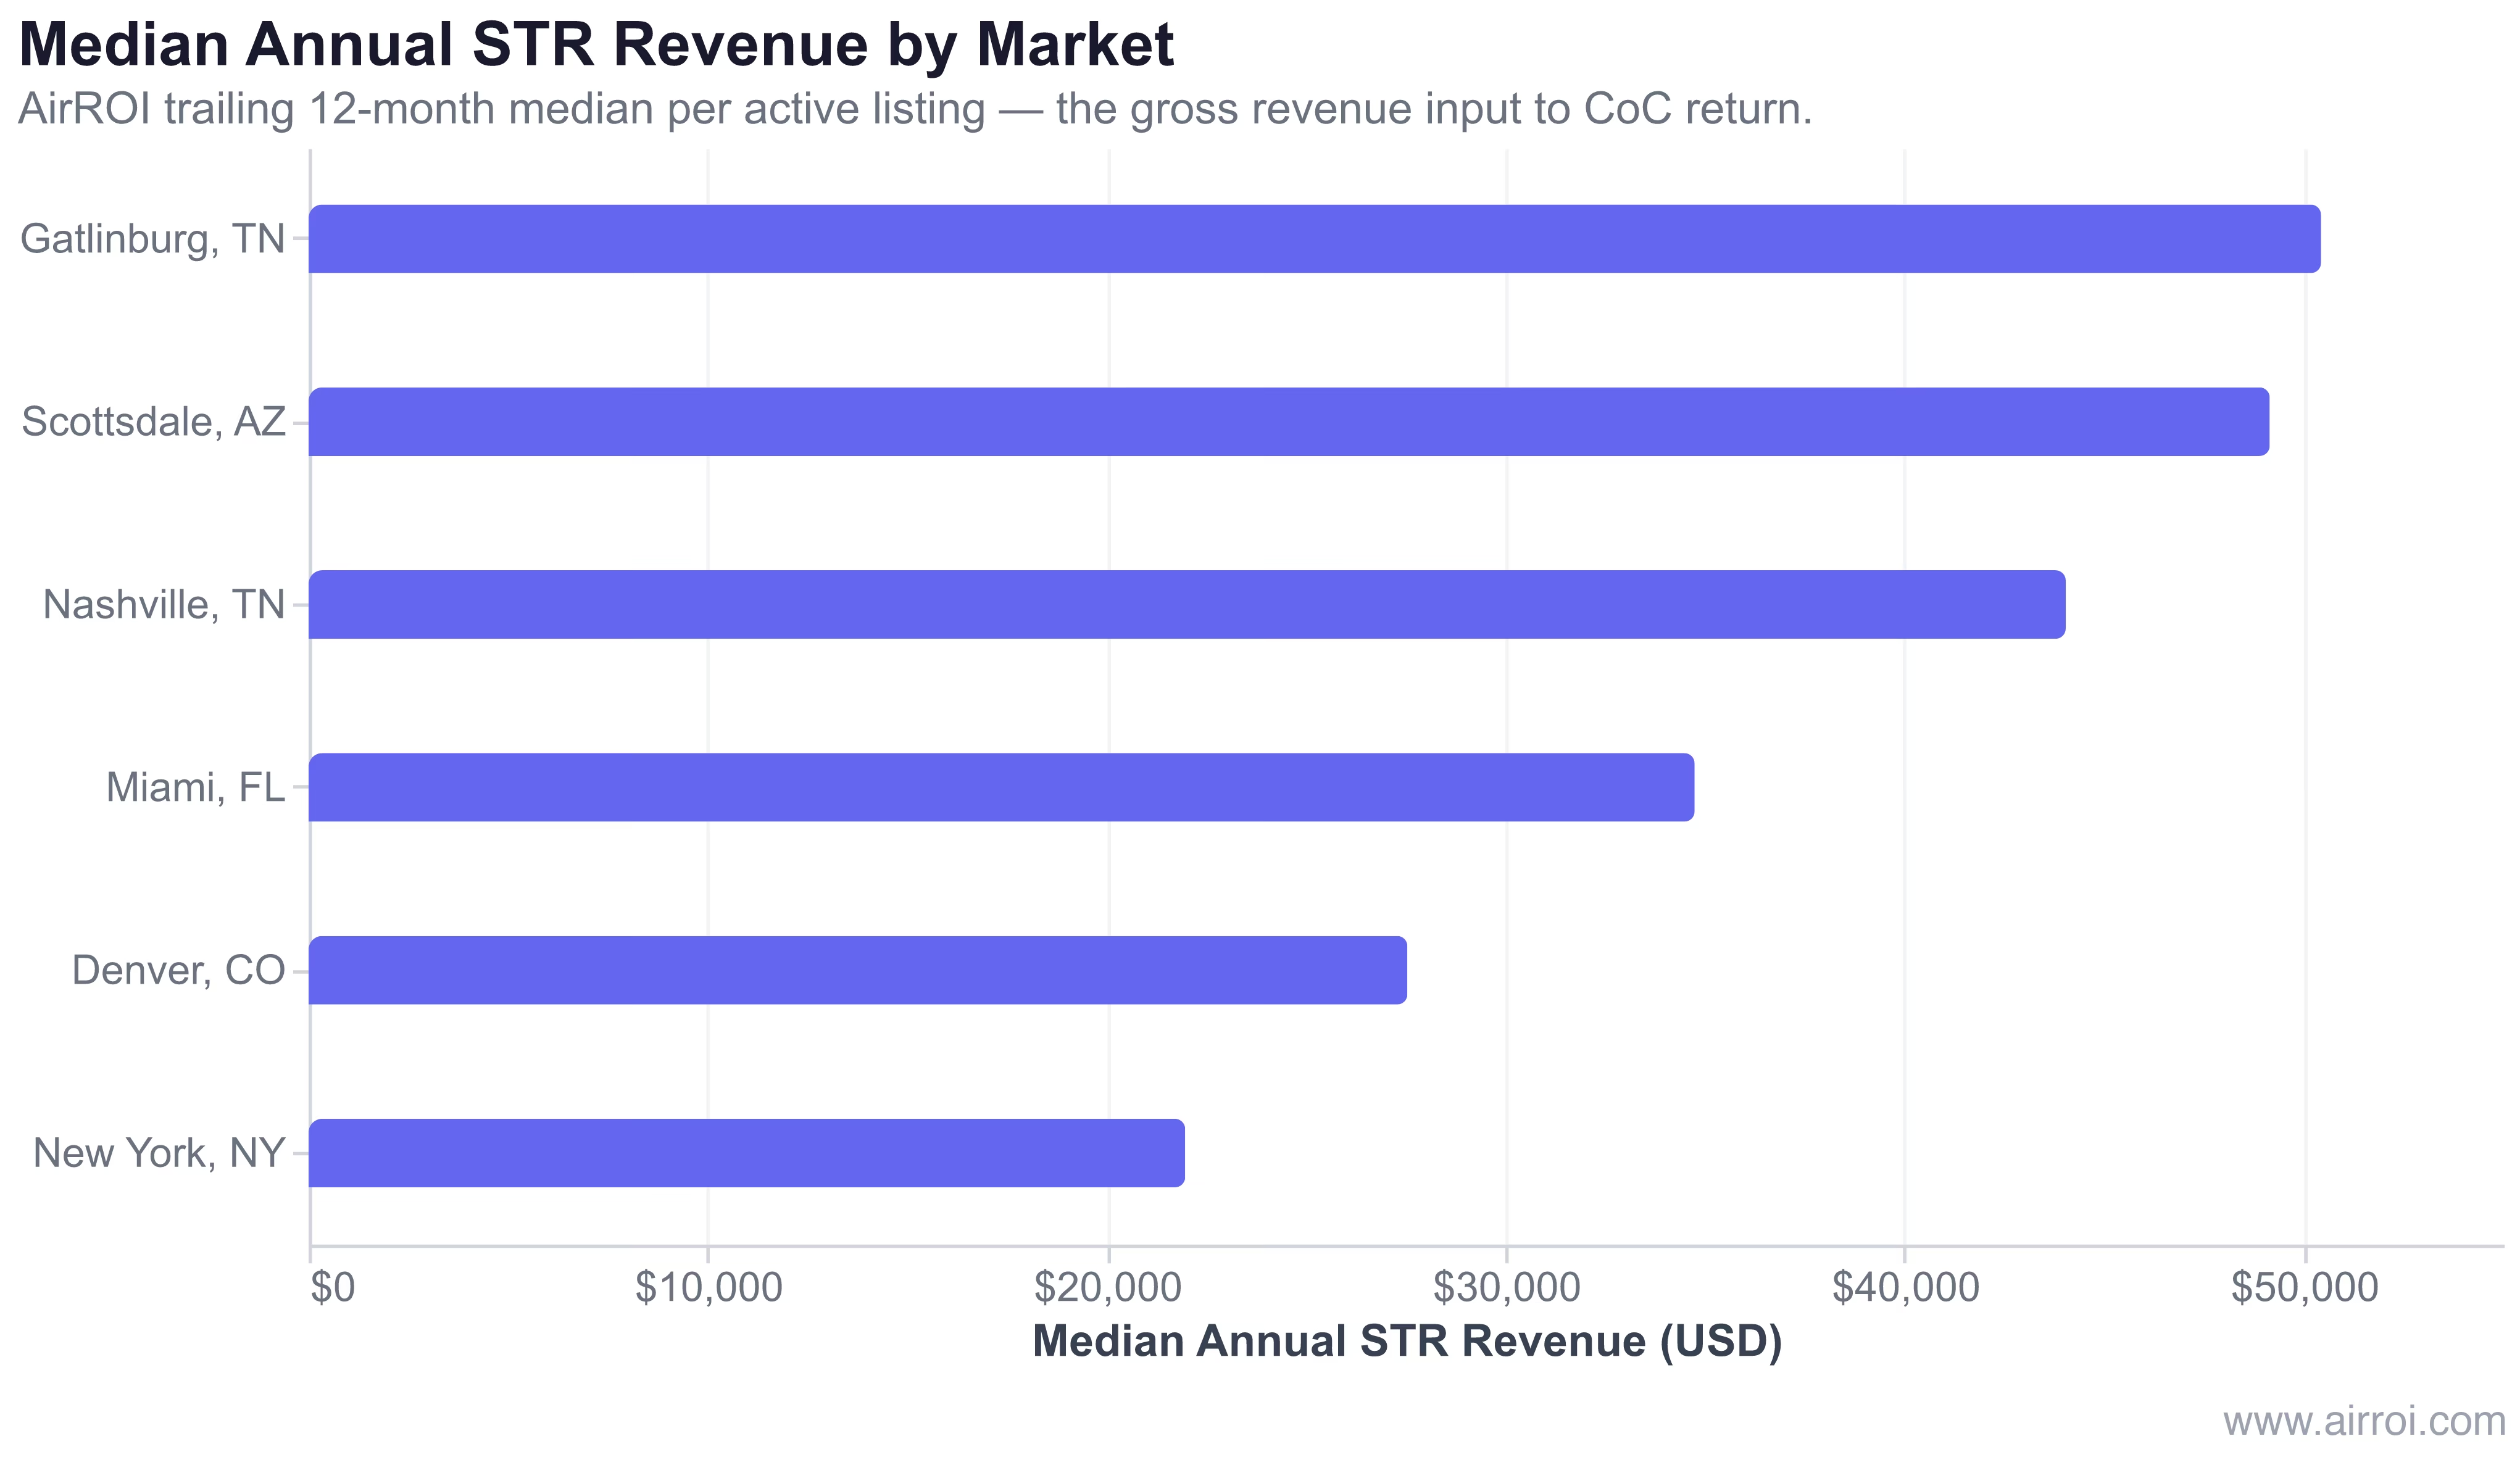
In AirROI's analysis of 37,209 active listings across six US markets, median annual STR revenue ranges from $21,970 in New York to $50,438 in Gatlinburg. Vacation markets outperform urban metros not because guests pay higher nightly rates — Scottsdale's ADR of $421/night exceeds Gatlinburg's $377 — but because vacation properties capture more nights per year at those prices. Gatlinburg's 47% occupancy on 365 days still produces $50,438 in gross revenue because the short-stay, weekend-heavy demand pattern keeps the calendar full.
Revenue is the raw material of CoC return, but home prices determine whether that raw material becomes profit. Gatlinburg earns 15% more revenue than Nashville yet costs 20% more — the CoC math is tighter than it looks on a revenue-only basis.
CoC Return vs. Cap Rate: When to Use Each
Both metrics evaluate real estate investment returns, but they answer different questions.
| Metric | What it measures | Includes mortgage? | Best used for |
|---|---|---|---|
| Cap rate | Unlevered return on total property value | No | Comparing properties regardless of financing |
| Cash-on-cash return | Return on your actual cash invested | Yes | Evaluating a specific financed deal |
CoC Return Benchmarks by Performance Level
| Performance Level | CoC Return | Interpretation |
|---|---|---|
| Below average | Below 0% | Negative cash flow — property costs money monthly |
| Breakeven | 0% – 4% | Mortgage paid, but thin margin for vacancies/repairs |
| Average | 4% – 8% | Acceptable when paired with appreciation potential |
| Good | 8% – 12% | Solid cash-flowing investment, above most benchmarks |
| Very good | 12% – 18% | Strong performer, above-market cash yield |
| Exceptional | Above 18% | Top-tier — verify all assumptions carefully |
The Federal Reserve's 2024 Survey of Consumer Finances found that direct real estate investment delivered median annual returns of roughly 7%–9% for leveraged residential properties over the prior decade — a useful benchmark when evaluating whether your STR CoC return justifies the operational complexity over passive alternatives.
Why Financing Terms Dominate CoC Return
Refinancing is a meaningful lever: a rate reduction from 7% to 5.5% on an $800,000 loan saves roughly $14,400 per year in debt service, which directly lifts CoC return by several percentage points on typical cash invested.
Tips for Improving Cash-on-Cash Return
- Include every dollar of startup cost: Omitting furnishing, staging, or early-stage vacancy from total cash invested inflates CoC return and leads to poor reinvestment decisions. The AirROI income calculator guide walks through a complete startup cost inventory.
- Use STR-specific revenue projections: Long-term rental income assumptions routinely understate STR potential by 40%–80%. Use actual comparable listings from AirROI, not listing-price-era estimates.
- Stress-test your vacancy assumption: A property that cash-flows at 70% occupancy but breaks even at 55% has thin margin. Model CoC return at your market's median occupancy, not best-case.
- Optimize the down payment: A 30% down payment on a $400,000 property adds $40,000 in cash invested but reduces annual debt service by roughly $3,200, improving CoC return in high-rate environments where NOI barely covers the mortgage.
- Track CoC return annually: Revenue, expenses, and refinancing all shift CoC return year over year. Recalculate each January to determine whether reinvesting in the same property, buying a second property, or redirecting capital produces the best return on your next dollar.
Frequently Asked Questions
A good cash-on-cash return for a short-term rental is typically 8% to 15%, with top-performing properties exceeding 20%. At 2026 mortgage rates near 6.8%, many city-median STRs produce thin or negative cash flow on 20% down — investors who reach 8%+ generally buy below market, put 30%+ down, or target vacation markets with high revenue relative to home prices. Compare any CoC figure against local benchmarks, not national averages.
Cash-on-cash return measures the return on your actual cash invested after debt service, while cap rate measures unlevered return on total property value before any mortgage. A property with a 5% cap rate can produce a 12% cash-on-cash return with favorable financing, or a negative CoC return when rates are high. Cap rate is best for comparing properties; CoC return reveals what your dollars actually earn once the bank takes its cut.
No, cash-on-cash return only measures annual cash flow relative to cash invested. It excludes property appreciation, mortgage principal paydown, and tax benefits. For a complete investment picture, pair it with total ROI calculations that capture equity growth and depreciation advantages — CoC return is the cash-in-pocket signal, not the wealth-building total.
Mortgage rates directly compress or expand CoC return because debt service is the largest deduction from annual cash flow. At 4% rates, a $400,000 STR with $26,000 NOI might clear $5,000 in cash flow (a 4%+ CoC on 20% down); at 7%, the same property breaks even or goes negative. Every 100 basis points of rate increase costs roughly $3,200 per year on a $400,000 loan, cutting directly into CoC return.
Total cash invested must include the down payment, closing costs (typically 2%–4% of purchase price), and all pre-opening expenses: furnishings, renovations, inspection fees, and initial supplies. Omitting any of these inflates your CoC return and sets false expectations. For a $400,000 STR, a realistic total cash invested figure is typically $110,000–$130,000 after accounting for all startup costs.