
Return on Investment (ROI)
Key Takeaways
- ROI equals total net profit divided by total capital invested; a more complete picture than cap rate or cash-on-cash return alone
- Total ROI combines cash flow, property appreciation, equity buildup, and tax benefits — ignoring any of these understates actual performance
- AirROI data across 33,659 active listings in six US markets shows cash-flow ROI ranging from ~6% in expensive coastal markets to over 22% in cash-flow-oriented markets
- Market selection drives ROI more than operational efficiency — a well-run property in the wrong market still underperforms a mediocre one in the right market
- Recalculate ROI annually; revenue, expenses, and property values all shift, and the metric is only useful when it reflects current conditions
How to Calculate STR ROI
Simple Formula
ROI = (Net Profit ÷ Total Investment Cost) × 100
Comprehensive STR ROI Formula
For a fully leveraged purchase, ROI captures every dimension of return:
Total Annual ROI = (Cash Flow + Appreciation + Principal Paydown + Tax Savings) ÷ Total Cash Invested × 100
Example Calculation:
| Component | Amount |
|---|---|
| Annual cash flow (after all expenses and mortgage) | $14,400 |
| Annual property appreciation (3%) | $15,000 |
| Annual mortgage principal paydown | $6,000 |
| Annual tax savings (depreciation + deductions) | $4,200 |
| Total annual return | $39,600 |
| Down payment (20%) | $100,000 |
| Closing costs | $10,000 |
| Furnishing and setup | $25,000 |
| Total cash invested | $135,000 |
Total ROI = $39,600 ÷ $135,000 × 100 = 29.3%
Cash-flow-only ROI = $14,400 ÷ $135,000 × 100 = 10.7%
Cash-flow ROI is the conservative floor. Total ROI — which includes the real but less liquid gains from appreciation and equity buildup — is the complete picture.
STR Cash-Flow ROI Across US Markets
Market selection is the primary driver of STR ROI, because purchase prices vary far more than rental revenues. Using AirROI's trailing-12-month revenue data paired with Zillow's 2026 median home values, and applying a 55% NOI margin (i.e., 45% of revenue consumed by STR operating expenses), the estimated cash-flow ROI on a 25% cash-in position (20% down + 5% closing/setup) ranges by more than 4× across major markets.
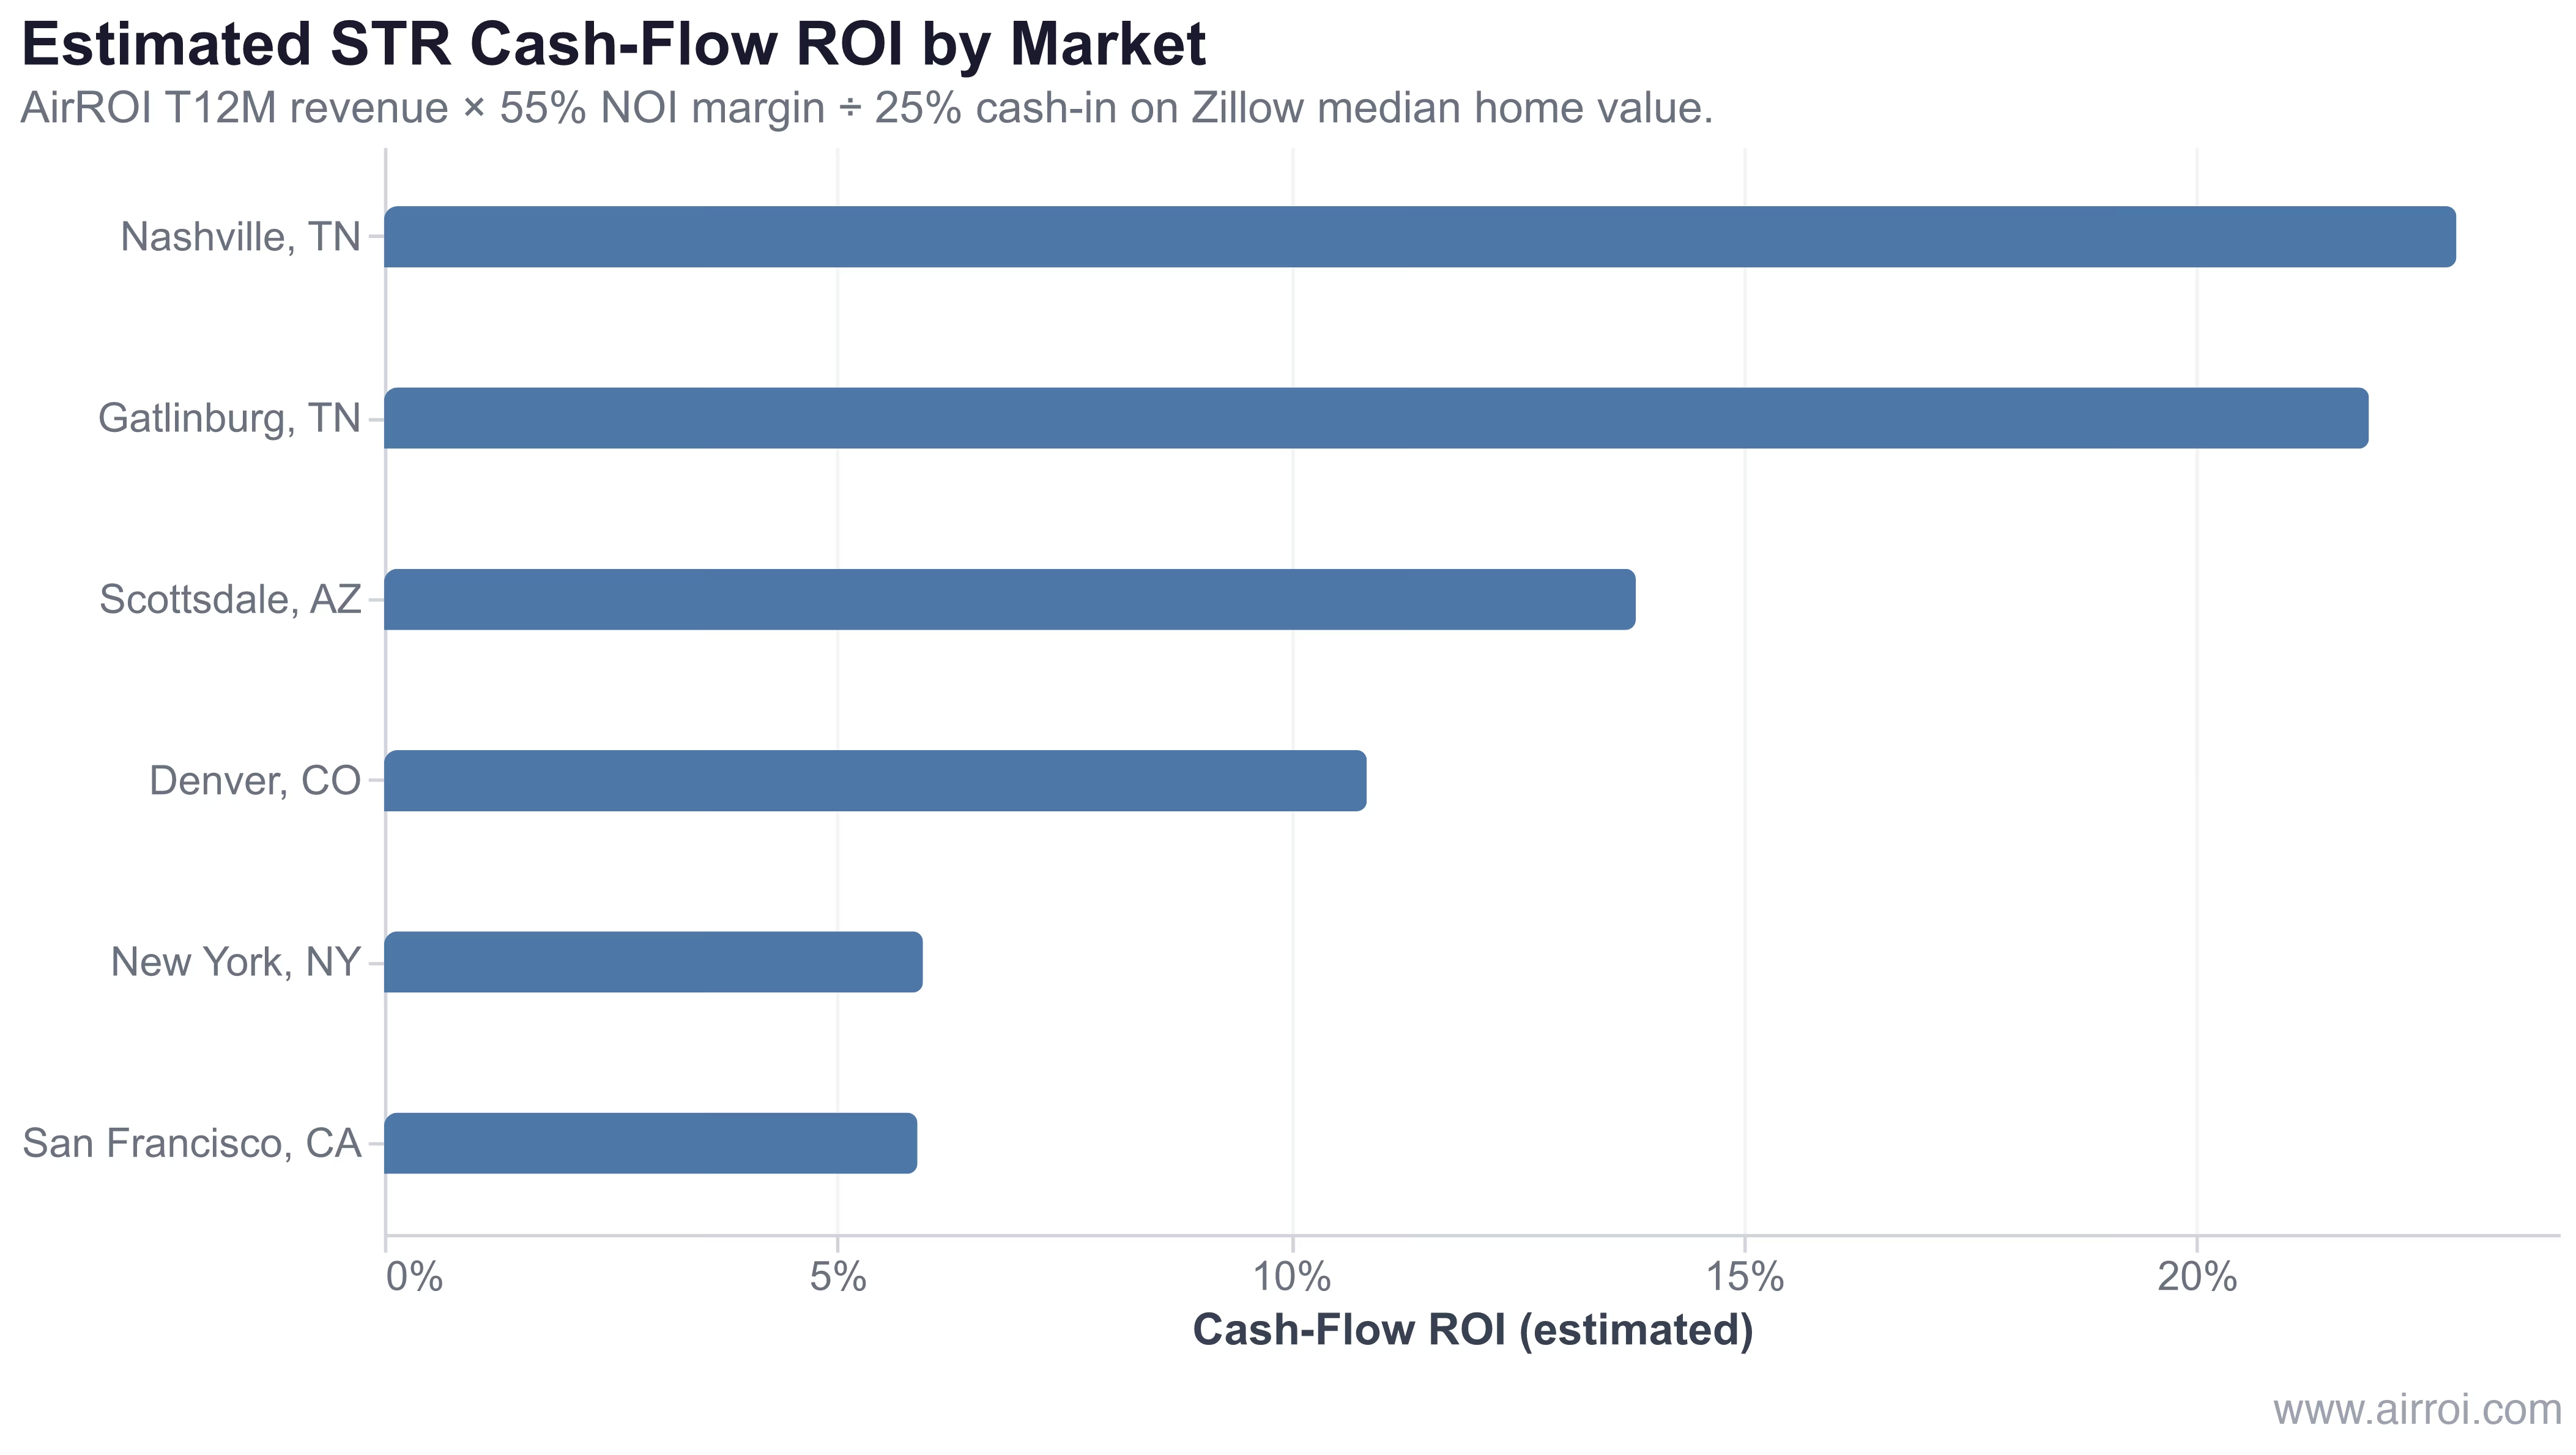
In AirROI's analysis of 33,659 active listings across Nashville, Gatlinburg, Scottsdale, Denver, San Francisco, and New York, the gap between the top and bottom markets is stark:
| Market | Median STR Revenue | Implied Cash-Flow ROI |
|---|---|---|
| Nashville, TN | $44,039 | 22.9% |
| Gatlinburg, TN | $50,438 | 21.9% |
| Scottsdale, AZ | $49,153 | 13.8% |
| Denver, CO | $27,540 | 10.8% |
| San Francisco, CA | $33,932 | 5.9% |
| New York, NY | $21,970 | 5.9% |
The biggest ROI lever most investors never pull is market selection. Choosing a market with favorable revenue-to-price ratios can triple cash-flow ROI compared to a comparable asset in a gateway city.
ROI vs. Cap Rate vs. Cash-on-Cash Return
These three metrics are complementary, not interchangeable. Confusing them leads to poor investment decisions.
| Metric | What It Measures | Financing Included? | Appreciation Included? |
|---|---|---|---|
| Cap Rate | Unlevered property yield (NOI/value) | No | No |
| Cash-on-Cash Return | Cash yield on cash invested | Yes | No |
| Total ROI | Complete investment performance | Yes | Yes |
Why ROI Matters for Airbnb Hosts
- Complete performance view: ROI captures appreciation and tax benefits that cash-on-cash return ignores — critical in markets where cash flow is modest but appreciation is strong
- Investment comparison: Comparing STR ROI against S&P 500 returns, REITs, or other real estate assets keeps you honest about opportunity cost
- Strategic planning: A declining ROI trend — even if cash flow is positive — signals it may be time to sell, 1031-exchange into a higher-yield asset, or improve operations
- Goal tracking: ROI targets give your portfolio a measurable standard, not just a vague sense of whether it's "doing well"
Maximizing STR ROI: What the Data Shows
- Buy where revenue-to-price ratios are highest: The AirROI data above makes this concrete. A market with $50K in annual revenue and a $500K median home value delivers far stronger ROI than one with $35K revenue and a $1.2M home value, even though the latter feels more prestigious.
- Optimize pricing dynamically: Revenue optimization through dynamic pricing can increase top-line income 15–25% over static pricing. That gain flows directly to NOI and ROI. See our data-driven dynamic pricing guide for a systematic approach.
- Invest in high-ROI amenities: Not all amenity spend converts equally. Revenue potential is partly a function of listing quality; the right upgrades pay back within one season.
- Minimize vacancy with market selection: Year-round demand markets (Nashville, Scottsdale) sustain occupancy in shoulder months where pure seasonal destinations drop to 20–30%. Stable occupancy stabilizes cash flow and ROI.
- Leverage tax strategies fully: Depreciation, cost segregation, and the short-term rental tax loophole (for qualifying active participants) can add 3–8 percentage points to total ROI through tax-deferred or tax-sheltered income. These gains are non-trivial and should be modeled before purchase.
- Track ROI annually, not once: Revenue trends, expense inflation, and property values all shift. A property that delivered 18% ROI at acquisition may be at 12% three years later — or vice versa — and that information should drive decisions about refinancing, reinvesting, or selling.
Frequently Asked Questions
A good short-term rental ROI depends on the components you count. Cash-flow-only ROI of 8–15% is considered strong; total ROI (adding appreciation, principal paydown, and tax benefits) of 15–25%+ is excellent. AirROI data shows cash-flow ROI ranging from roughly 6% in expensive coastal markets like San Francisco and New York to over 20% in cash-flow markets like Nashville and Gatlinburg, where purchase prices are lower relative to STR revenue.
For financed properties, calculate ROI by dividing your total annual return — cash flow after mortgage payments, plus equity gained through principal paydown, plus appreciation, plus tax savings — by your total cash invested (down payment + closing costs + furnishing and setup). This leveraged ROI is typically far higher than an all-cash purchase because you control a larger asset with less capital. Be sure to subtract all mortgage payments from cash flow before adding the other components.
Use both metrics together. Cap rate measures unlevered property performance independent of financing, making it ideal for comparing properties side by side. ROI measures your total return including financing, appreciation, and tax benefits, giving you the full picture of how your specific capital is working. Screen properties with cap rate first, then calculate ROI with your actual financing terms to make final investment decisions.
Short-term rentals generate 30–100% more gross revenue than comparable long-term rentals in most markets, which drives higher NOI from the same property. Higher STR operating expenses (cleaning, furnishing, platform fees, management) partially offset that advantage, but the net effect is still a meaningful ROI premium — typically 5–10 percentage points above long-term in the same market.