
Potential Annual Revenue
Key Takeaways
- Potential annual revenue equals average nightly rate × 365 × expected occupancy rate, calibrated to real comparable listings in your target market
- AirROI data shows median annual revenue ranging from $27,540 in Denver, CO to $53,472 in San Diego, CA across active US STR markets — a 94% spread driven primarily by ADR, not occupancy
- Seasonality creates 3–4× monthly swings in many markets; model by season, not just annual averages, for accurate projections
- New listings should apply a 10–20% discount to market-based projections for the first 60–90 days until reviews accumulate
- Revenue potential and purchase price must be evaluated together — high-revenue markets like Scottsdale and Gatlinburg often deliver stronger gross rental yields than higher-profile metros because entry costs remain lower
How to Calculate Potential Annual Revenue
Potential Annual Revenue = Average Nightly Rate × 365 × Expected Occupancy Rate
Use market comp data — not aspirational pricing — to set each input. AirROI's trailing-12-month medians give you both ADR and occupancy for active listings in your target market, so you are projecting from actual performance rather than best-case assumptions.
Example calculation using market comp data:
| Component | Value |
|---|---|
| Market median ADR (from comps) | $195 |
| Expected occupancy rate | 68% |
| Booked nights per year | 248 |
| Potential annual revenue | $48,360 |
Seasonal Model (More Accurate)
Annual averages mask the reality that peak months can generate 3–4× the revenue of off-season months. Break the projection by season for precision:
| Season | Months | Avg Rate | Occupancy | Revenue |
|---|---|---|---|---|
| Peak summer | Jun–Aug | $275 | 85% | $21,488 |
| Shoulder spring | Mar–May | $195 | 70% | $12,496 |
| Shoulder fall | Sep–Nov | $200 | 72% | $13,104 |
| Off-season winter | Dec–Feb | $150 | 50% | $6,750 |
| Annual total | $53,838 |
Potential Annual Revenue Across US STR Markets
Market selection is the highest-leverage decision in STR investing. AirROI's trailing-12-month data across 70,000+ active US listings reveals a wide revenue spread between markets that share similar occupancy rates but diverge sharply on ADR.
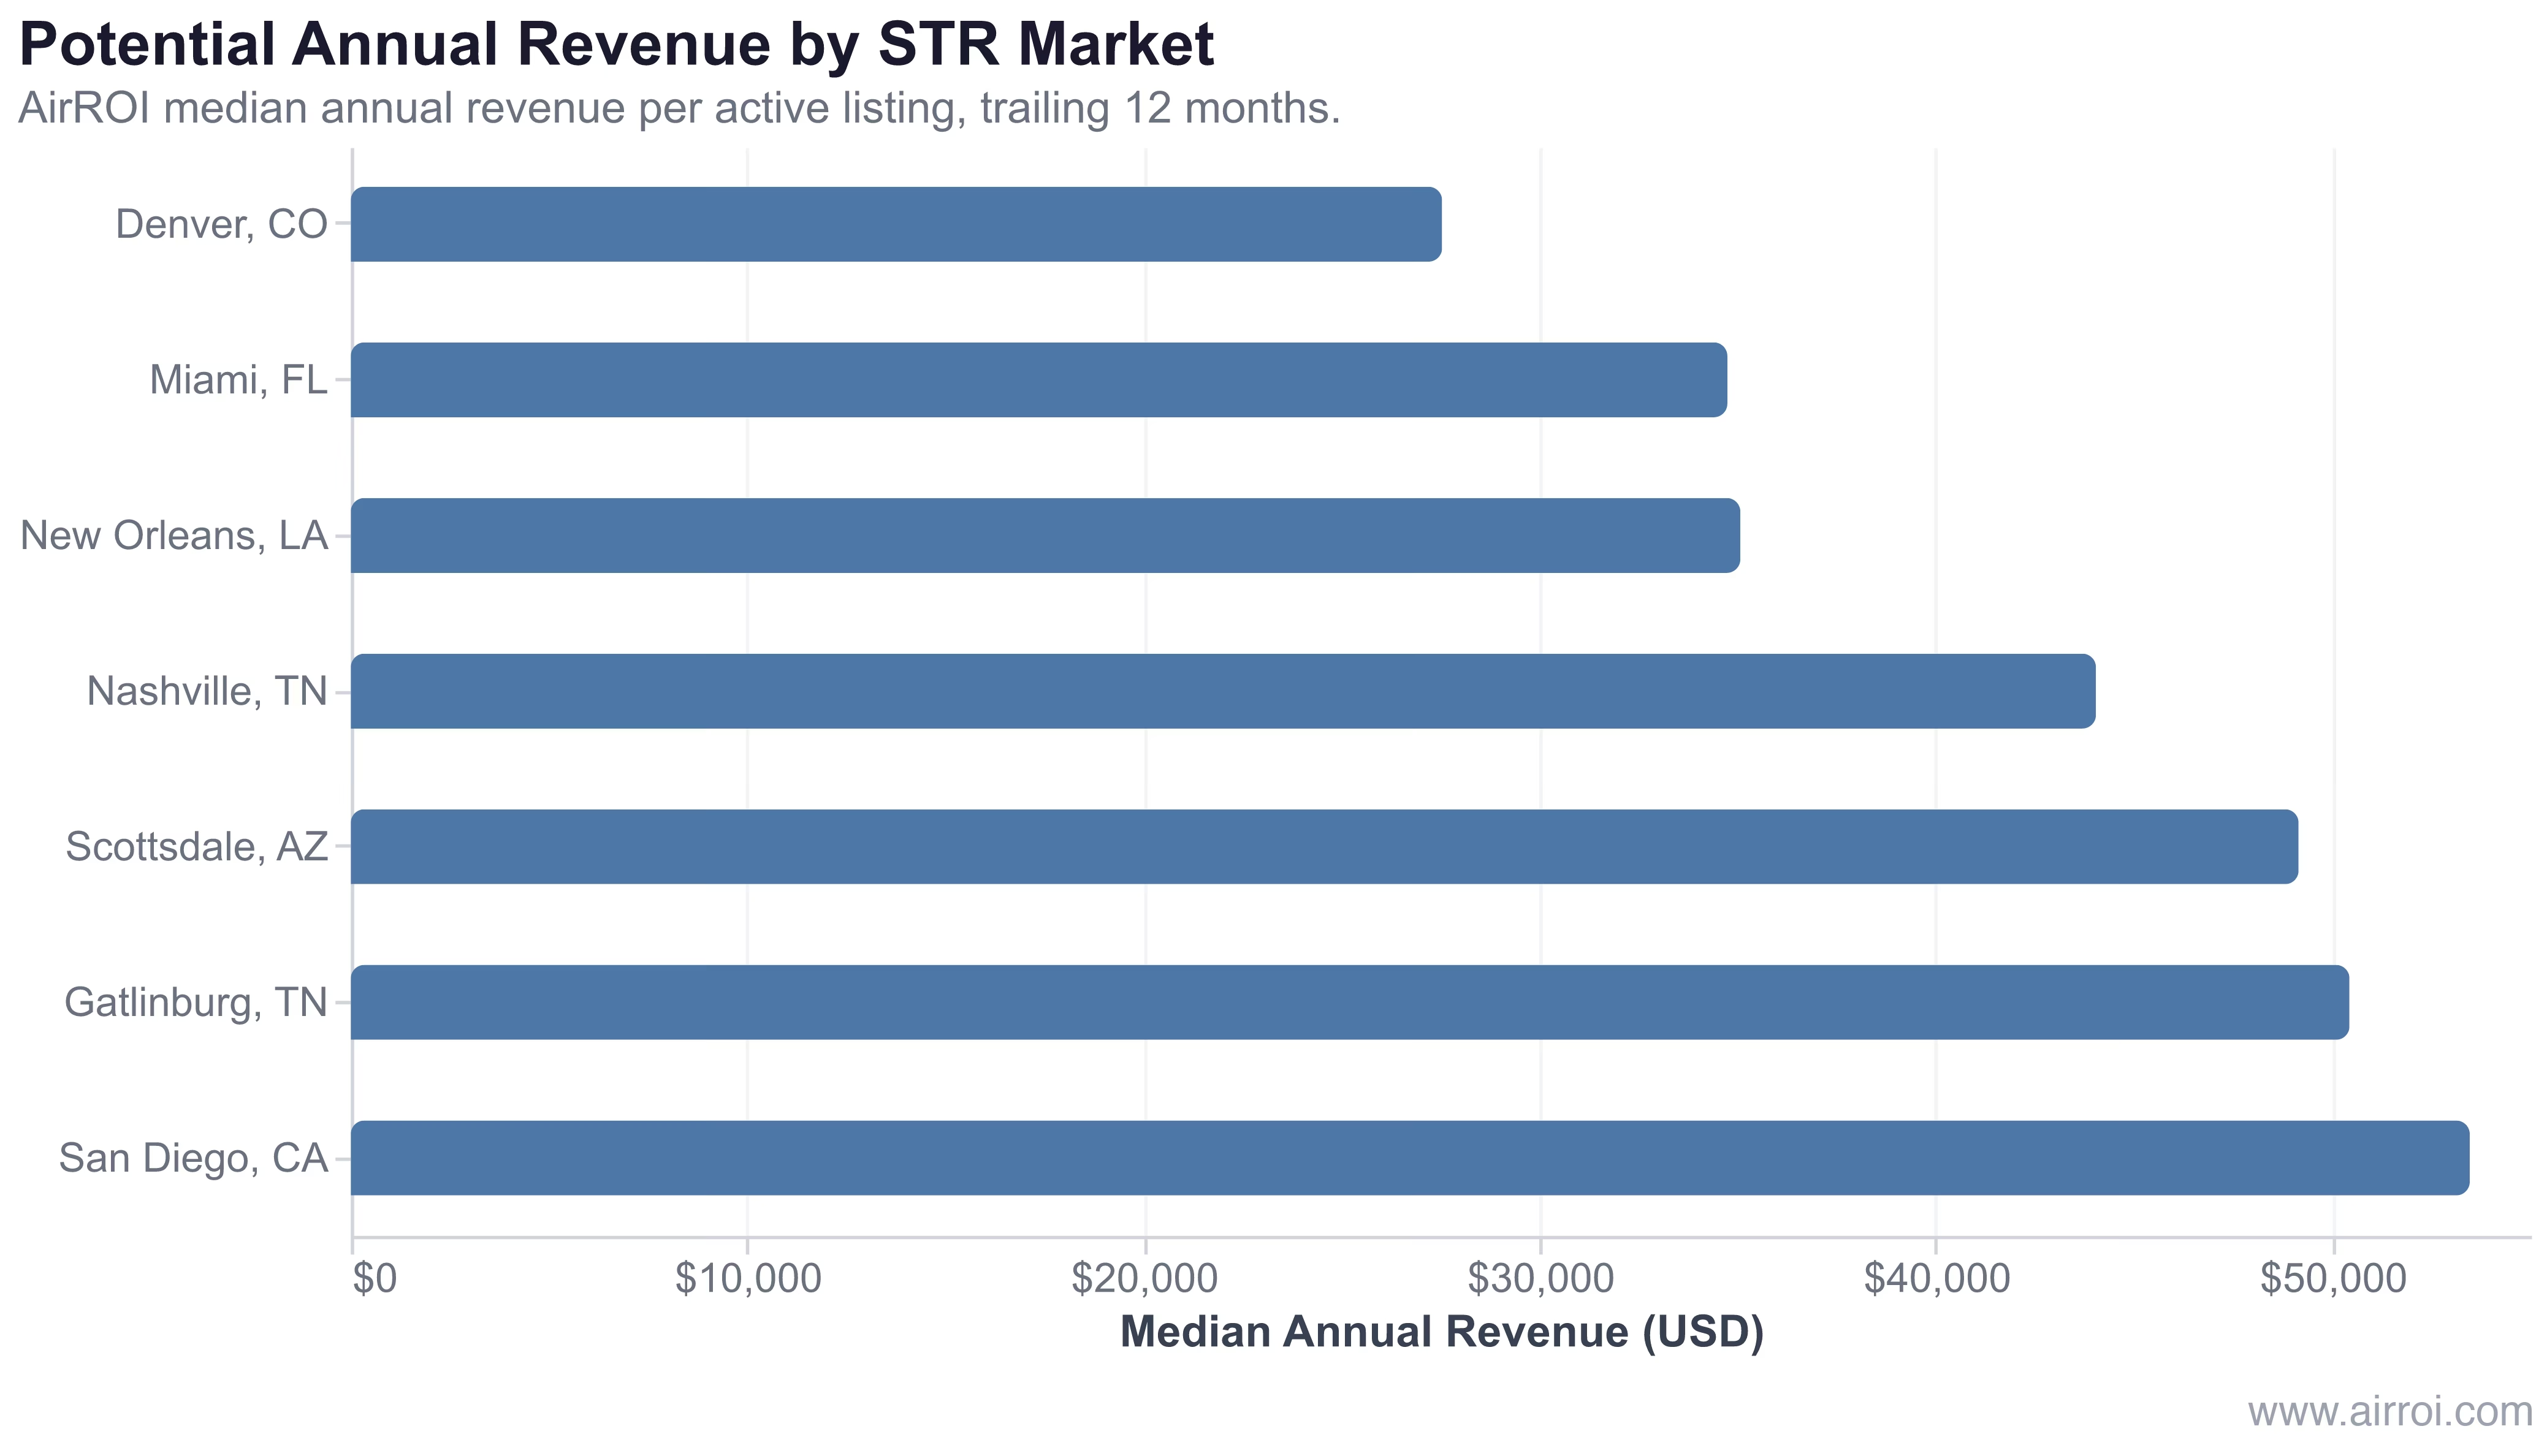
| Market | Annual Revenue | ADR | Occupancy |
|---|---|---|---|
| San Diego, CA | $53,472 | $394.90 | 53% |
| Gatlinburg, TN | $50,438 | $376.50 | 47% |
| Scottsdale, AZ | $49,153 | $421.10 | 49% |
| Nashville, TN | $44,039 | $353.60 | 47% |
| New Orleans, LA | $35,065 | $335.20 | 44% |
| Miami, FL | $34,738 | $291.00 | 49% |
| Denver, CO | $27,540 | $221.50 | 54% |
Source: AirROI trailing-12-month median per active listing, May 2026.
Mountain resort and Sun Belt leisure markets consistently deliver higher potential annual revenue than comparably-priced primary metros — because ADR, not occupancy, is the primary revenue multiplier in STR investing.
Why Potential Annual Revenue Matters for STR Investors
- Investment screening: Revenue potential sets the ceiling for gross rental yield and determines whether the property can service debt, cover operating costs, and return capital — before you ever open the deal
- Financing decisions: Lenders offering DSCR loans use projected revenue to calculate debt-service coverage; higher revenue potential directly expands your borrowing capacity and available markets. The best DSCR markets for Airbnb in 2026 are largely the ones with strong revenue floors
- Market comparison: Ranking markets by median annual revenue reveals where your investment capital generates the most top-line income relative to acquisition cost — which is the starting point for cap rate analysis
- Business planning: Revenue projections drive budgets for operating expenses, cleaning reserves, management fees, and reinvestment. Underestimating revenue leads to underfunded reserves; overestimating leads to cash-flow shortfalls. The STR investment analysis guide walks through how to build a full pro forma from your revenue estimate
Revenue Benchmarks by Property Type
Bedroom count is the second most important revenue variable after market selection. More bedrooms accommodate larger groups, supporting premium ADR and higher occupancy from event-driven demand.
| Property Type | Avg Nightly Rate | Avg Occupancy | Annual Revenue Range |
|---|---|---|---|
| 1BR apartment/condo | $100–$175 | 65%–80% | $24,000–$51,000 |
| 2BR house/condo | $150–$275 | 60%–78% | $33,000–$78,000 |
| 3BR house | $200–$400 | 55%–75% | $40,000–$110,000 |
| 4BR+ vacation home | $300–$700 | 50%–70% | $55,000–$179,000 |
| Luxury/unique property | $500–$1,500+ | 45%–65% | $82,000–$356,000 |
Ranges reflect broad market variation. Always use local comparable data for specific projections.
Tips for Accurate Revenue Projections
- Source from real comps: Pull ADR and occupancy from active listings with the same bedroom count, location radius, and amenity tier as your target property. AirROI's comparable search filters by all three dimensions simultaneously.
- Model seasonality explicitly: Use monthly or quarterly rate and occupancy inputs. A single annual average will overstate revenue in slow months and understate it in peak months — creating unreliable cash-flow projections at the critical monthly level.
- Apply a new-listing discount: Reduce your comp-based estimate by 10–20% for the first 60–90 days of operation to account for the review ramp-up. Your search ranking improves materially after the first 10 reviews.
- Include cleaning fee revenue: Cleaning fees collected from guests are gross revenue. Include them in the projection and separately account for actual cleaning costs in expenses.
- Factor regulatory constraints: Markets with permit caps or minimum-night requirements effectively cap supply and can support higher ADR — but they also create compliance costs. Research local rules before finalizing your revenue model. The top US Airbnb markets for 2026 analysis covers the regulatory landscape alongside revenue data.
- Refresh projections annually: STR markets shift. A market that delivered $50,000 median revenue last year may face new entrants or regulatory changes this year. Re-run your revenue model with current data before refinancing or making capital improvements.
Frequently Asked Questions
Multiply your projected average nightly rate by 365, then multiply by your expected occupancy rate. For example, a property averaging $195/night at 68% occupancy yields $195 × 365 × 0.68 = $48,360 in potential annual revenue. Use comparable listings in your specific market — not national averages — to set realistic rate and occupancy inputs. AirROI's revenue calculator uses actual trailing-12-month data from active listings in your target market.
Location drives the largest share of revenue variation between properties — market selection, neighborhood desirability, and proximity to demand generators (beaches, ski slopes, convention centers) account for 60–70% of the difference. Within a market, bedroom count, amenity set (hot tub, pool, parking), and listing quality (photos, reviews, response rate) determine where a property lands relative to market comps. Seasonality patterns and local regulatory environment (permit caps, minimum-night rules) shape the annual ceiling.
No. Potential annual revenue is a forward-looking projection based on comparable market data; actual revenue is what you collect after accounting for pricing execution, listing quality, guest reviews, management responsiveness, and real-world vacancy gaps. A well-optimized listing with strong reviews can exceed market projections; a newly launched listing with no reviews typically runs 10–20% below them during its first 60–90 days. Treat potential revenue as a data-driven benchmark, not a guaranteed outcome.
Dramatically. AirROI's trailing-12-month data shows San Diego, CA at a median of $53,472 per active listing versus Denver, CO at $27,540 — a 94% gap driven by ADR differences ($394.90 vs. $221.50) rather than occupancy, which is similar (53% vs. 54%). Mountain resort markets like Gatlinburg, TN ($50,438) and leisure-driven Scottsdale, AZ ($49,153) outperform most major metros despite lower home prices, highlighting why revenue potential and purchase price must be evaluated together.
Apply a 10–20% haircut to your market-based projection for the first 60–90 days of operation. New listings lack reviews, which reduces conversion rates from search impressions to bookings. As reviews accumulate and your listing moves up in search rankings, revenue typically converges toward the market median. Budget for this ramp-up period when modeling your investment's first-year cash flow.