
Gross Rental Yield
Key Takeaways
- Gross rental yield equals annual STR revenue divided by property value, multiplied by 100
- It is a screening metric — it ignores operating expenses, so always follow it with net rental yield and full cost analysis
- AirROI data shows gross yields ranging from 2.7% in San Francisco to 10.4% in Nashville — driven primarily by home prices, not rental demand
- Yields of 8%+ are generally strong for STRs; below 5% warrants close scrutiny of the purchase price
- Cross-market comparisons are where gross yield is most powerful: it collapses the affordability gap into one number
How to Calculate Gross Rental Yield
Gross Rental Yield = (Annual Gross Rental Income ÷ Property Value) × 100
Example:
| Item | Amount |
|---|---|
| Annual gross rental income | $60,000 |
| Property purchase price | $450,000 |
| Gross rental yield | 13.3% |
For short-term rentals, annual gross income should include all booking revenue, cleaning fees collected, and ancillary income (pet fees, experience add-ons). Use realized or conservatively projected figures, not peak-season extrapolations.
Real STR Gross Yields by Market
Gross yield is most revealing when grounded in actual data. In AirROI's analysis of 33,659 active listings across six US markets, the spread from top to bottom exceeds seven percentage points — and the driver is overwhelmingly purchase price.
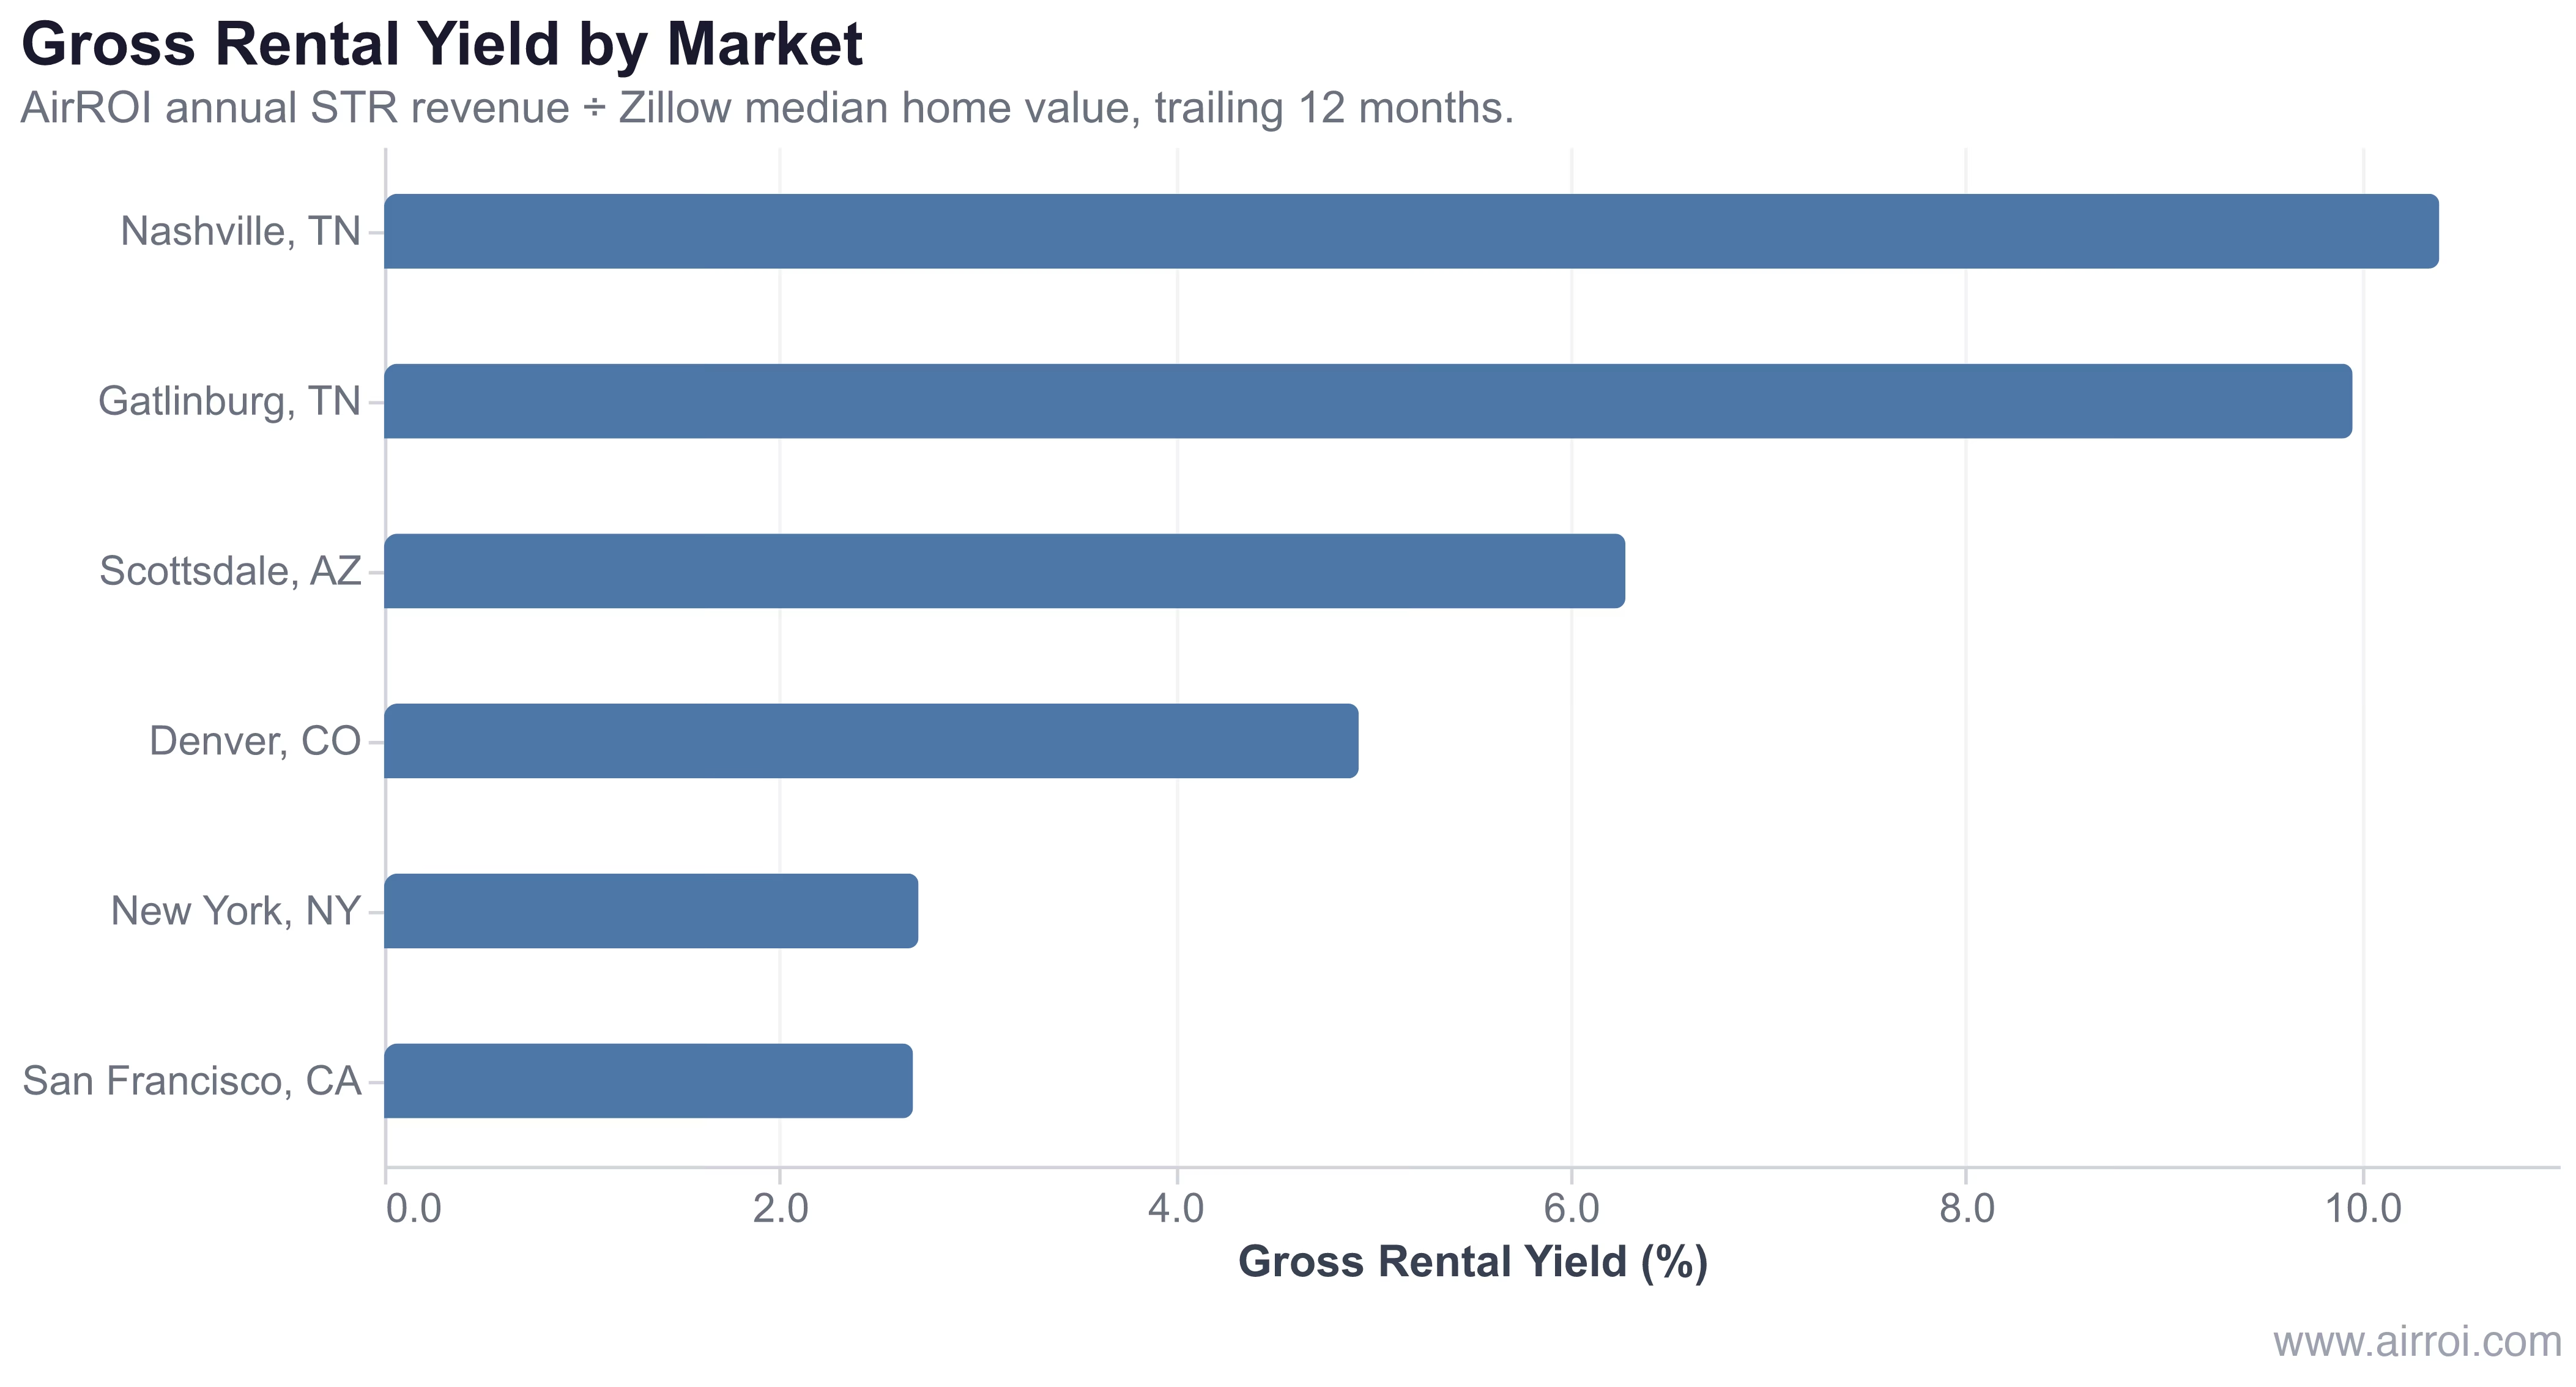
Pairing AirROI's trailing-12-month median STR revenue with Zillow's 2026 median home values:
| Market | Median STR Revenue | Median Home Value | Gross Rental Yield |
|---|---|---|---|
| Nashville, TN | $44,039 | $423,694 | 10.4% |
| Gatlinburg, TN | $50,438 | $506,638 | 10.0% |
| Scottsdale, AZ | $49,153 | $782,937 | 6.3% |
| Denver, CO | $27,540 | $558,705 | 4.9% |
| New York, NY | $21,970 | $812,861 | 2.7% |
| San Francisco, CA | $33,932 | $1,268,418 | 2.7% |
These are city-median figures across all active listings — individual properties bought below median or actively managed for revenue will outperform these benchmarks. The pattern they reveal is the real insight: San Francisco hosts generate more revenue than Nashville hosts in dollar terms, yet Nashville delivers nearly four times the gross yield because a Nashville home costs one-third as much.
Gross rental yield is a price story as much as a revenue story. A market with modest ADR and affordable homes will often outrank a high-ADR coastal market simply because entry cost dominates the equation.
Gross Rental Yield vs. Net Rental Yield
| Metric | Gross Rental Yield | Net Rental Yield |
|---|---|---|
| Formula | Gross income ÷ Property value | (Gross income − Expenses) ÷ Property value |
| Expenses included | None | All operating expenses |
| Best for | Quick cross-market screening | Investment decisions and lender analysis |
| Typical STR range | 3% – 12% | 2% – 7% |
| Typical spread | — | 3–6 pp below gross yield |
The gap between gross and net yield is typically 3–6 percentage points for a professionally managed STR, depending on management fees (usually 15–30% of revenue), cleaning cadence, insurance, property taxes, and maintenance reserves. A Nashville property at 10.4% gross yield might land at 5–6% net — still strong. A San Francisco property at 2.7% gross can easily go negative net after expenses.
Why Gross Rental Yield Matters for STR Investors
- Market screening at scale: Evaluate dozens of markets or submarkets quickly without gathering expense data for each one
- Purchase price validation: Gross yield below 5% on an STR signals the acquisition price is likely too high relative to income potential — or that the property demands exceptional operation to work
- Portfolio benchmarking: Track gross yield across your portfolio to identify assets that have drifted below threshold as property values appreciate
- Financing conversations: Lenders and underwriters recognize gross yield as a quick proxy for income-generating capacity alongside cap rate
Using Gross Yield Effectively
- Use it as a first filter, not a final answer. Screen properties with gross yield, then conduct full expense analysis on the top candidates. Our STR investment analysis guide walks through the full due-diligence stack.
- Use realistic revenue estimates. Base annual income on comparable STR data for similar property types and bedroom counts in the same submarket — not the host's asking projection.
- Account for seasonality. Annual gross income should reflect realistic occupancy across all seasons. Gatlinburg's 10.0% gross yield incorporates off-season periods; a calculation built only on peak-week rates would be meaningless.
- Compare like with like. Gross yields for 1-bedroom condos should benchmark against similar units, not 4-bedroom cabins. Property type and bedroom count drive both revenue and price.
- Always follow up with net yield and cap rate. A 15% gross yield means nothing if expenses consume 70% of revenue. The Airbnb vs. long-term rental calculator helps model the net outcome once expenses are factored in.
- Weigh regulatory risk. New York's 2.7% gross yield already reflects the post-Local-Law-18 market — a 90% drop in short-stay listings that pushed many hosts to 30-night minimum stays. Gross yield does not price in regulatory exposure; second-tier cities are now facing similar ordinance waves.
Frequently Asked Questions
A gross rental yield of 8% or above is generally strong for a short-term rental. AirROI data shows Nashville and Gatlinburg reaching 10%+ while expensive metros like San Francisco and New York sit near 2.7% because high purchase prices compress yields regardless of rental demand. Always follow a strong gross yield with a full net-yield and expense analysis before committing.
Gross rental yield divides total revenue by property value before any expense deductions. Net rental yield subtracts all operating costs first. A property with 10% gross yield typically delivers 4–6% net yield after cleaning, management, insurance, and taxes — so gross yield is a screening tool, not a final verdict.
Yes. Gross rental yield normalizes revenue against property price, making it the clearest first-pass metric for cross-market comparison. Nashville's 10.4% gross yield versus San Francisco's 2.7% captures the entire affordability gap in one number. The limitation is that it ignores operating costs and regulatory risk, which vary widely between markets.
Vacation markets combine relatively affordable home prices with strong short-term rental demand. Gatlinburg, TN, for example, posts $50,438 in median annual STR revenue against a $506,638 median home value — a 10.0% gross yield — because mountain cabin demand is high and purchase prices remain well below coastal metros.
Revenue is the numerator, property value the denominator. Increasing gross rental yield means either raising revenue (better pricing, higher occupancy, added amenity fees) or buying below market value. Dynamic pricing tools and Superhost status are proven levers on the revenue side; buying in an undervalued submarket addresses the denominator.