
Market Value
Key Takeaways
- Market value represents the probable sale price in current conditions — not purchase price, not tax assessment, not what you hope to get
- Three appraisal approaches determine value: sales comparison, income approach, and cost approach
- The income approach (Value = NOI ÷ Cap Rate) is the most relevant framework for STR investment properties
- AirROI basket data shows median home values ranging from $424K in Nashville to $1.27M in San Francisco — a 3× spread that explains most of the cap rate gap between markets
- Tracking market value annually lets you quantify equity growth and time hold-vs-sell decisions with precision
How Market Value Is Determined
Three appraisal methods are recognized by lenders, appraisers, and tax authorities. For STR investment properties, the income approach carries the most weight.
Three Appraisal Approaches
| Approach | Method | Best For |
|---|---|---|
| Sales comparison | Compare recent sales of similar properties | Primary residences, standard properties |
| Income approach | Value = NOI ÷ Cap Rate | Investment and income-producing properties |
| Cost approach | Land value + replacement cost − depreciation | New construction, unique or rural properties |
Income Approach in Practice
The income approach rewards operational excellence: every dollar of NOI you add increases implied property value.
| Component | Example Value |
|---|---|
| Annual STR revenue | $44,039 |
| NOI margin (45% after operating expenses) | $19,818 |
| Local market cap rate | 4.7% |
| Implied market value (income approach) | $421,660 |
At a 4.7% cap rate, increasing NOI by $5,000 — through better dynamic pricing or reduced vacancy — adds roughly $106,000 to the property's implied income-approach value.
Market Value Across STR Markets
Purchase price is the single largest driver of cap rate differences between markets. Gross STR revenue in San Francisco ($33,932/year) and Nashville ($44,039/year) are in the same ballpark — yet their home values are separated by $845,000.
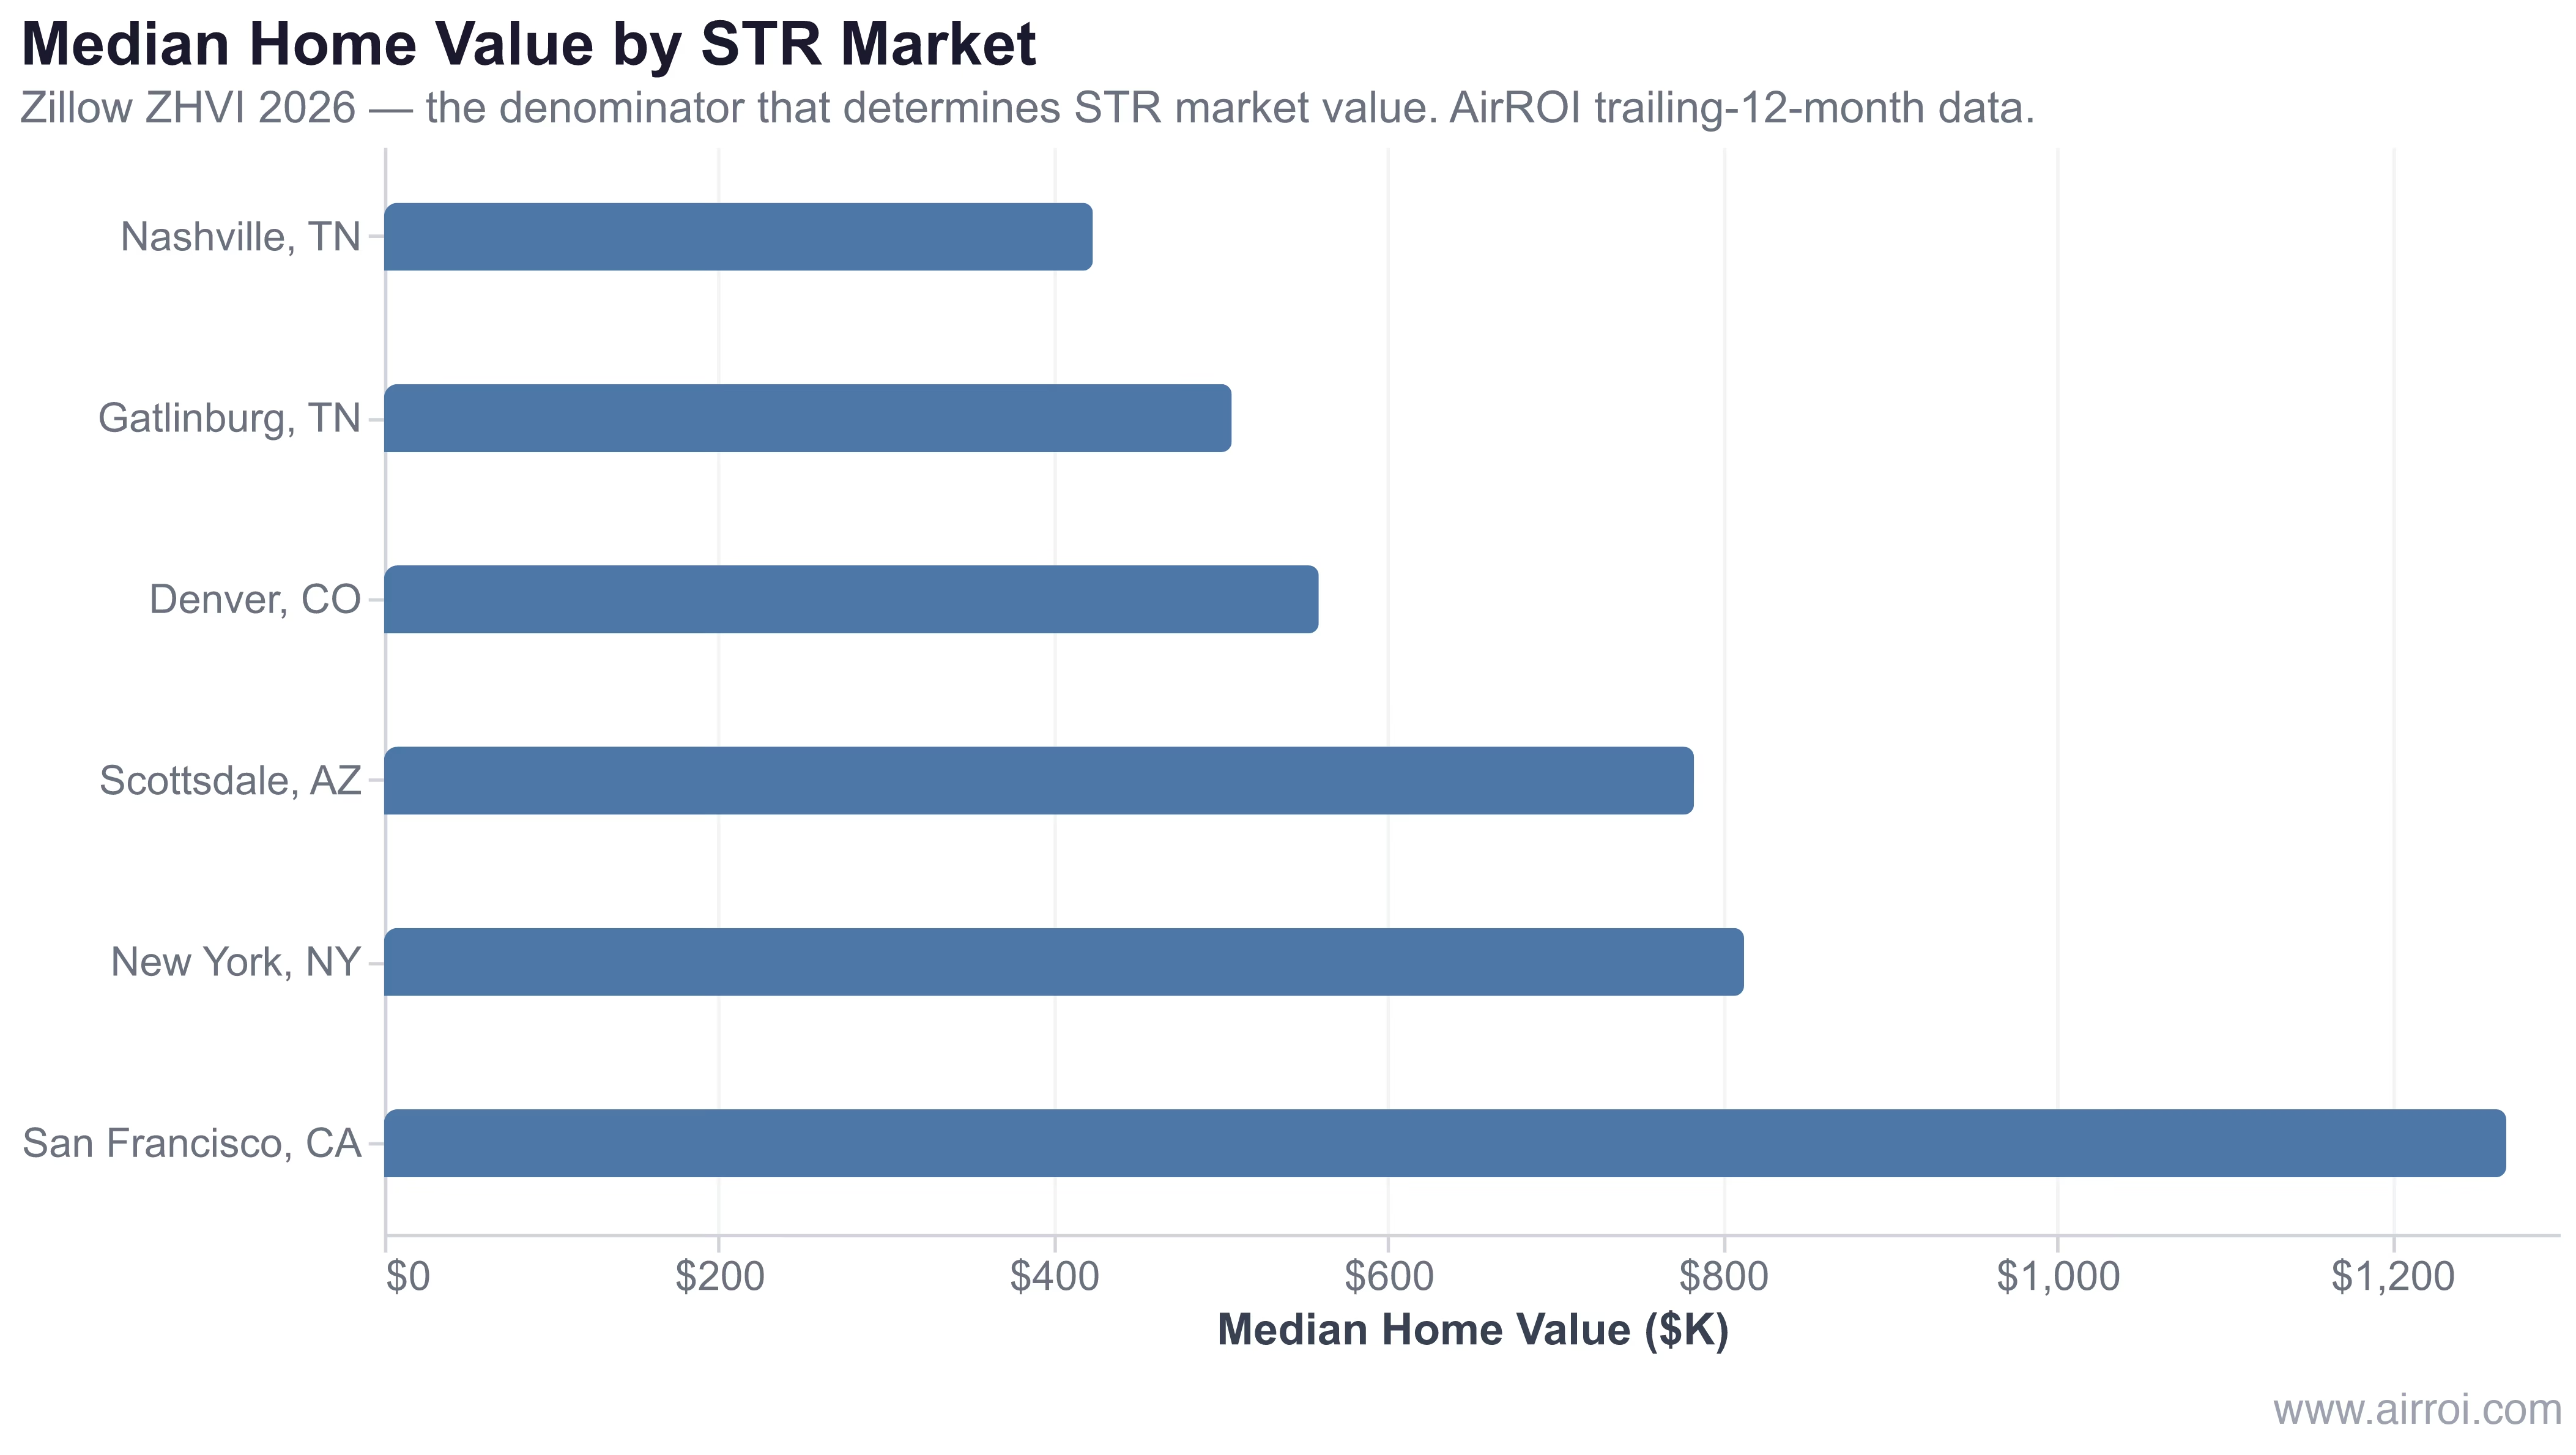
In AirROI's analysis of more than 27,000 active listings across these six markets, the home value spread — from $424K in Nashville to $1.27M in San Francisco — explains why Nashville's implied cap rate is nearly four times San Francisco's, despite similar gross revenue.
| Market | Median Home Value | Median STR Revenue | Active Listings |
|---|---|---|---|
| Nashville, TN | $423,694 | $44,039 | 6,165 |
| Gatlinburg, TN | $506,638 | $50,438 | 3,622 |
| Denver, CO | $558,705 | $27,540 | 3,739 |
| Scottsdale, AZ | $782,937 | $49,153 | 4,310 |
| New York, NY | $812,861 | $21,970 | 11,468 |
| San Francisco, CA | $1,268,418 | $33,932 | 4,355 |
Home values: Zillow ZHVI 2026. STR revenue: AirROI trailing-12-month median per active listing.
Market value is a price story as much as a revenue story. Two properties earning similar STR income can carry radically different implied valuations depending solely on where they sit — which makes market selection the most consequential investment decision an STR operator makes.
Factors That Influence STR Market Value
| Factor | Impact on Value | Notes |
|---|---|---|
| Location and neighborhood | High | Proximity to attractions, walkability, views |
| Property condition | High | Updated properties command 10–20% premiums |
| STR income history | Medium-High | Documented revenue history supports higher valuations |
| Local regulations | Medium-High | STR-friendly regimes protect income potential — see STR regulations guide |
| Comparable sales | High | Recent comps set the ceiling for the sales comparison approach |
| Interest rates | Medium | Lower rates support higher valuations by reducing buyer cap rate hurdles |
| Seasonality and tourism | Medium | Growing tourism markets appreciate faster |
| Premium amenities | Medium | Hot tubs, pools, and unique features add $20K–$80K in comp value |
Why Market Value Matters for STR Investors
- Investment metric calculations: Market value is the denominator in cap rate, gross yield, and net yield. An error here cascades into every performance metric.
- Equity tracking: The gap between market value and your mortgage balance is your real equity — the foundation of ROI and portfolio growth.
- Refinancing decisions: A higher market value improves your loan-to-value ratio, potentially qualifying you for cash-out refinancing to fund additional acquisitions.
- Exit planning and 1031 exchanges: Understanding current market value helps you time a sale and 1031 exchange to maximize after-tax proceeds.
- DSCR lending: DSCR lenders underwrite against market value and STR income simultaneously — knowing both numbers is essential before approaching a lender.
Maximizing Market Value Through STR Operations
Three levers matter most:
- Revenue discipline: Dynamic pricing that closes the gap between booked rate and market peak ADR raises both annual revenue and the income-approach valuation. Use our STR investment analysis framework to model the value uplift before committing to a pricing strategy.
- Document everything: Appraisers and DSCR lenders need 12–24 months of verifiable STR revenue data. Listings with documented income history consistently achieve higher appraisals than equivalent undocumented properties.
- Strategic renovations: Improvements that raise both nightly rates and comparable-sale comps — kitchens, bathrooms, outdoor entertainment spaces — increase value through both the income approach and the sales comparison approach simultaneously.
Frequently Asked Questions
It depends on the appraisal method and buyer pool. Properties in STR-friendly markets may command premiums of 10–30% when marketed to investors who value the income potential. Traditional appraisals using comparable sales often ignore STR income, but lenders increasingly recognize it — especially for DSCR loans. The strongest value impact occurs in markets where STR revenue significantly exceeds long-term rental income.
Market value for rental properties is typically determined using three approaches: the sales comparison approach (comparing recent sales of similar properties), the income approach (dividing NOI by cap rate), and the cost approach (land value plus replacement cost minus depreciation). For STR investment properties, the income approach is most relevant because it ties value directly to the property's income-generating capacity.
Market value is the estimated price a property would sell for in a competitive market between willing buyers and sellers. Assessed value is the figure assigned by the local tax assessor for property tax purposes — often 50–90% of market value depending on jurisdiction. Assessed values update infrequently and can lag real conditions by years. Never substitute assessed value for true market value in investment analysis.
Market value is the denominator in the cap rate formula, so it directly compresses or expands the yield. AirROI data shows Nashville and San Francisco generate similar STR revenue — roughly $44K and $34K annually — but Nashville's median home value of $424K versus San Francisco's $1.27M produces a cap rate nearly four times higher. Price, not rent, drives most of the spread between markets.
The income approach means every dollar of additional NOI raises the property's implied value by $10–$15 at typical STR cap rates (6–10%). Increasing revenue through dynamic pricing, adding premium amenities, and documenting STR performance all lift value from the income side. Strategic renovations — kitchens, bathrooms, outdoor spaces — raise both comparable-sale comps and nightly rates simultaneously.