
Net Rental Yield
Key Takeaways
- Net rental yield equals (net operating income ÷ property value) × 100 — mathematically identical to cap rate
- STR operating costs typically consume 40–65% of gross revenue, so net yield can be less than half the gross yield figure
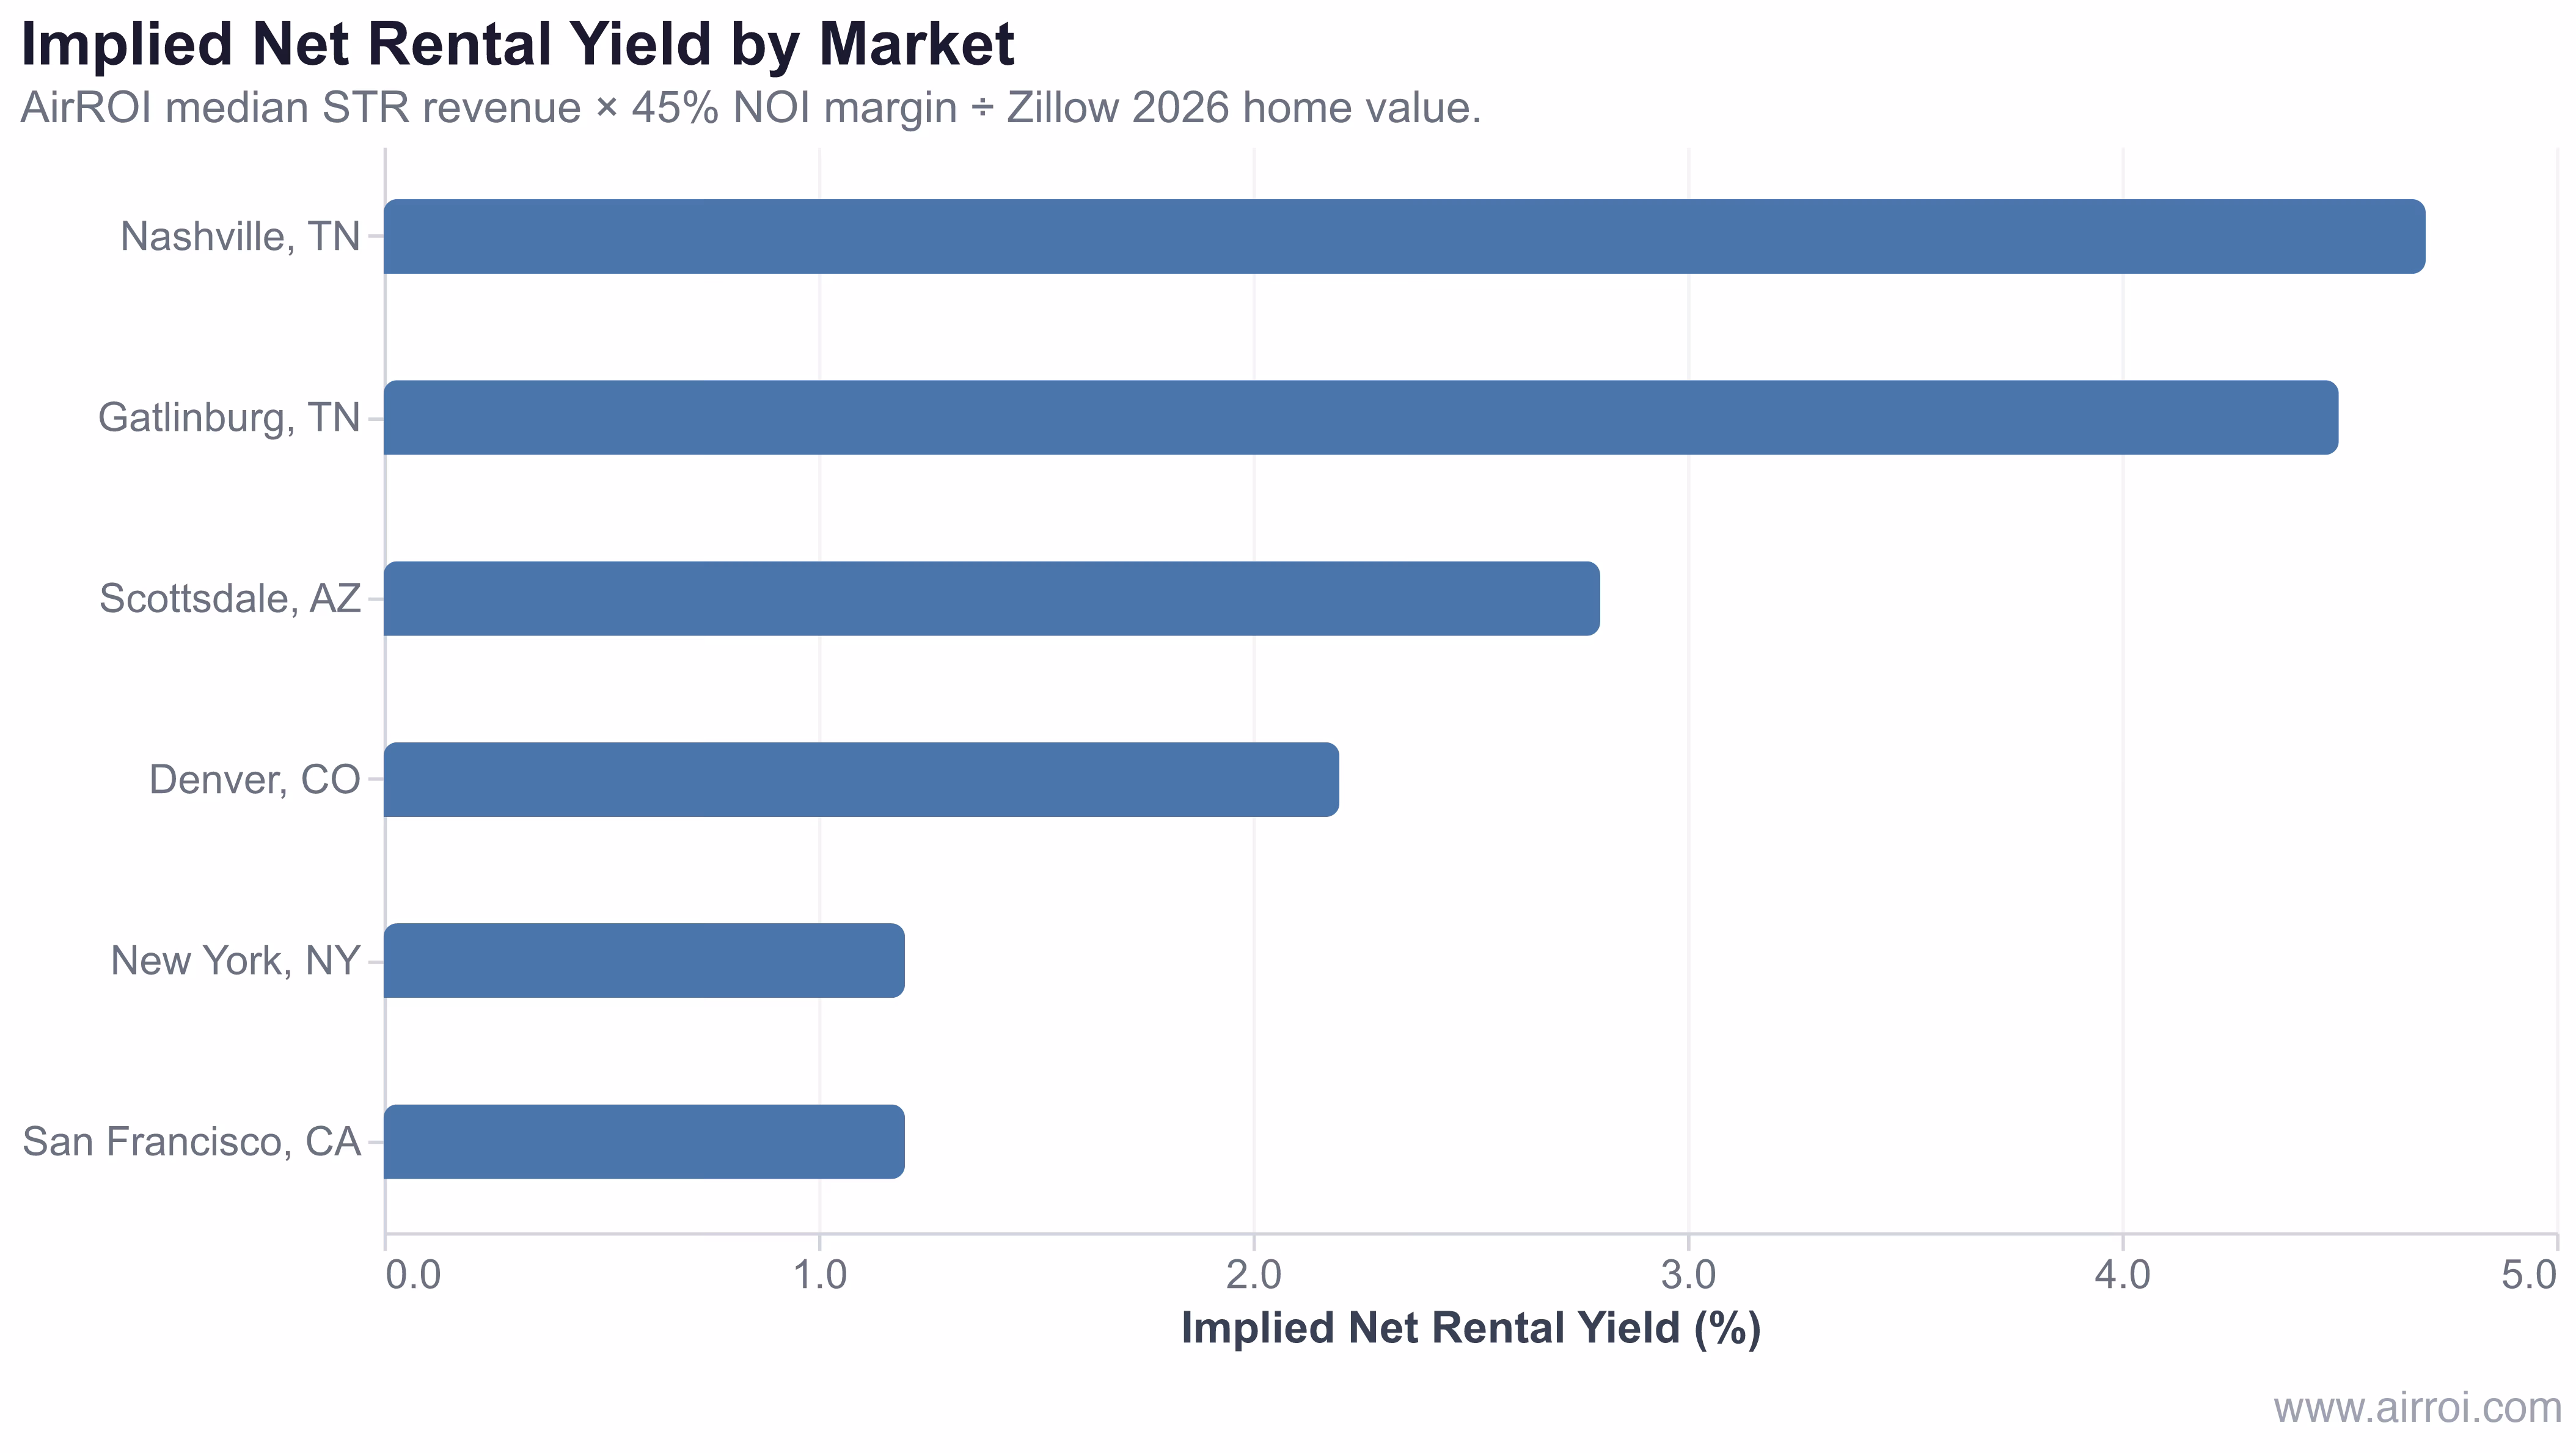
- AirROI data shows implied net yields ranging from 4.7% in Nashville to 1.2% in San Francisco across 33,659 active listings — driven primarily by home prices, not rental revenue
- A net yield below 4–5% often signals negative cash flow once mortgage payments are added
- Excluding debt service makes net yield a clean, financing-neutral benchmark for comparing properties across markets
How to Calculate Net Rental Yield
Net Rental Yield = ((Annual Gross Income − Annual Operating Expenses) ÷ Property Value) × 100
Example Calculation:
| Item | Amount |
|---|---|
| Annual gross rental income | $72,000 |
| Property management (20%) | −$14,400 |
| Cleaning costs | −$7,200 |
| Platform fees (3%) | −$2,160 |
| Property taxes | −$4,800 |
| Insurance | −$2,000 |
| Utilities | −$3,600 |
| Maintenance | −$3,500 |
| Supplies | −$1,500 |
| Net operating income | $32,840 |
| Property purchase price | $425,000 |
Net Rental Yield = $32,840 ÷ $425,000 × 100 = 7.7%
Real Net Rental Yields Across US Markets
Net yield is most instructive when grounded in real data. In AirROI's analysis of 33,659 active listings across six US markets, applying a 45% NOI margin to median STR revenue and dividing by Zillow's 2026 median home values reveals a dramatic spread — driven almost entirely by purchase price, not by rental income.
| Market | Median STR Revenue | Median Home Value | Gross Yield | Implied Net Yield |
|---|---|---|---|---|
| Nashville, TN | $44,039 | $423,694 | 10.4% | 4.7% |
| Gatlinburg, TN | $50,438 | $506,638 | 10.0% | 4.5% |
| Scottsdale, AZ | $49,153 | $782,937 | 6.3% | 2.8% |
| Denver, CO | $27,540 | $558,705 | 4.9% | 2.2% |
| New York, NY | $21,970 | $812,861 | 2.7% | 1.2% |
| San Francisco, CA | $33,932 | $1,268,418 | 2.7% | 1.2% |
AirROI median annual STR revenue, trailing 12 months. Zillow ZHVI 2026 median home values. NOI margin: 45%.
San Francisco earns roughly $12,000 more in annual STR revenue than New York, yet both post identical 1.2% implied net yields — because San Francisco homes cost $455,000 more. Nashville, by contrast, delivers the strongest net yield in the group with a median home value under $425,000 despite earning $44,039 annually. These are city-median figures across all listing types; a well-selected, competitively operated property in any of these markets can meaningfully exceed these benchmarks.
Nashville and San Francisco both rank among the most-analyzed STR markets in the US — yet Nashville's implied net yield is nearly four times higher. That gap exists entirely on the denominator side: home prices, not rents, determine where net yield lands.
Net Rental Yield vs. Gross Rental Yield
Gross yield ignores expenses entirely. Net yield removes them. The gap between the two is your expense ratio — and watching that ratio over time reveals whether your cost structure is improving or deteriorating.
| Property | Gross Yield | Expense Ratio | Net Yield | Verdict |
|---|---|---|---|---|
| 3BR house, Gatlinburg | 10.0% | 55% | 4.5% | Best net yield |
| 2BR condo, Nashville | 10.4% | 55% | 4.7% | Strongest |
| 4BR cabin, Scottsdale | 6.3% | 55% | 2.8% | |
| 1BR apartment, NY | 2.7% | 55% | 1.2% |
A property in Gatlinburg earning $50,438 annually but purchased at $506,638 nets a 4.5% yield — stronger than a comparable San Francisco property earning more gross revenue, because San Francisco's $1.27 million median home price overwhelms any income advantage.
Net Rental Yield Benchmarks
| Performance Level | Net Yield | Assessment |
|---|---|---|
| Poor | < 3% | Likely cash-flow negative with financing |
| Below average | 3% – 5% | Marginal; depends on appreciation |
| Average | 5% – 7% | Solid foundation for positive cash flow |
| Good | 7% – 9% | Strong income-producing asset |
| Excellent | > 9% | Outstanding; verify expense estimates |
Why Net Rental Yield Matters for STR Investors
- True income measurement: Net yield reveals what the property earns after all operating costs — not just the revenue it collects
- Expense diagnosis: A widening gap between gross and net yield signals costs growing faster than revenue — a red flag requiring immediate action
- Financing-neutral comparison: Because it excludes debt service, net yield compares identically financed and unfinanced properties on equal footing
- NOI foundation: Net yield and cap rate are mathematically the same metric — which means lenders and appraisers use this number to value income properties
Tips for Improving Net Rental Yield
- Reduce your expense ratio below 50%: Self-managed STRs with clean systems and repeat guests can hold total expenses to 45–50% of revenue. Each percentage point saved flows directly to net yield.
- Evaluate self-management carefully: Eliminating a 20% management fee adds roughly 2–4 percentage points to net yield, but only if you maintain occupancy and review scores. A drop in occupancy from poor response times erases the gain.
- Target revenue gains that don't scale with costs: Adding a hot tub or game room raises ADR and occupancy without proportionally increasing variable expenses — a structural improvement to the gross-to-net gap.
- Review insurance annually: STR-specific insurance premiums vary widely. An annual market comparison can reduce this fixed cost by $500–$1,500 on a typical property.
- Track the gross-to-net spread quarterly: If the spread widens beyond 55–60%, investigate which cost line is growing. Cleaning and maintenance are the most common culprits in high-occupancy markets.
Frequently Asked Questions
A good net rental yield for a short-term rental is typically 5% to 9%. Self-managed properties in cash-flow markets like Nashville can approach 7–9%, while professionally managed properties in expensive coastal cities like San Francisco compress to 1–3%. Always compare net yields within the same market type, because vacation destinations and high-cost urban metros have fundamentally different cost structures and home values.
Calculate net rental yield by subtracting all annual operating expenses from annual gross rental income, then dividing by the property purchase price or market value, and multiplying by 100. Operating expenses include property management, cleaning, utilities, insurance, taxes, maintenance, and platform fees. Exclude mortgage payments — net yield measures unlevered property performance, not cash flow after debt service.
Net rental yield accounts for operating expenses, which consume 40–65% of gross revenue for short-term rentals. Two properties with identical gross yields can have dramatically different net yields if one has a higher expense ratio. Net yield reveals the true income return and is mathematically equivalent to cap rate, making it far more reliable for comparing investment opportunities.
No. Net rental yield excludes mortgage payments by design. It measures the unleveraged return the property itself generates, independent of how it is financed. To evaluate return after debt service, use cash-on-cash return or DSCR instead. Excluding debt makes net yield a clean apples-to-apples metric across properties with different financing structures.
Net rental yield varies dramatically by market, driven mostly by home prices rather than rental revenue. AirROI data shows Nashville generates a 4.7% implied net yield while San Francisco produces just 1.2%, despite San Francisco earning $10,000 more in median annual STR revenue — because San Francisco homes cost three times as much. Cash-flow markets with lower home prices consistently deliver higher net yields.