
What Is Gross Booking Revenue in Short-Term Rentals
Gross booking revenue is the total amount a guest pays for a single reservation — nightly rates multiplied by number of nights, plus cleaning fees, extra-guest charges, pet fees, and any taxes collected by the host — before any platform commissions or operating costs are deducted. It is the complete transaction value of one booking: every dollar that crosses the guest's card for that stay.
Key Takeaways
- Formula: Gross Booking Revenue = (Nightly Rate × Nights) + Cleaning Fee + Ancillary Fees + Taxes Collected
- Represents the full guest payment for a single reservation, not just nightly rate revenue
- Cleaning fees and ancillary charges routinely add 15–40% on top of the base nightly total
- Directly related to Average Transaction Value (ATV) — gross booking revenue per booking and ATV are the same metric
- Length of stay is the single biggest lever: a 7-night booking can generate 3–4× the gross booking revenue of a 2-night stay even at a lower nightly rate
- Tracking it at the reservation level — not just the monthly rollup — reveals which booking types actually drive revenue
How to Calculate Gross Booking Revenue
Formula:
Gross Booking Revenue = (Nightly Rate × Number of Nights) + Cleaning Fee + Ancillary Fees + Taxes Collected
Example — 4-night booking:
| Component | Amount |
|---|---|
| Nightly rate (4 nights × $195) | $780 |
| Cleaning fee | $130 |
| Extra guest fee (1 guest × 4 nights × $15) | $60 |
| Pet fee | $50 |
| Gross Booking Revenue | $1,020 |
Gross Booking Revenue by Length of Stay
Cleaning fees are fixed per reservation, so their dilution effect on per-night economics changes dramatically as stay length grows:
| Stay Length | Nightly Rate | Cleaning Fee | Gross Booking Revenue | Revenue Per Night |
|---|---|---|---|---|
| 1 night | $200 | $130 | $330 | $330 |
| 2 nights | $200 | $130 | $530 | $265 |
| 3 nights | $190 | $130 | $700 | $233 |
| 5 nights | $180 | $130 | $1,030 | $206 |
| 7 nights | $165 | $130 | $1,285 | $184 |
| 14 nights | $145 | $130 | $2,160 | $154 |
Real-Market Gross Booking Revenue at Scale
Gross booking revenue compounds across hundreds of reservations per year. AirROI's trailing-12-month data reveals how dramatically annual gross booking volume differs by market:
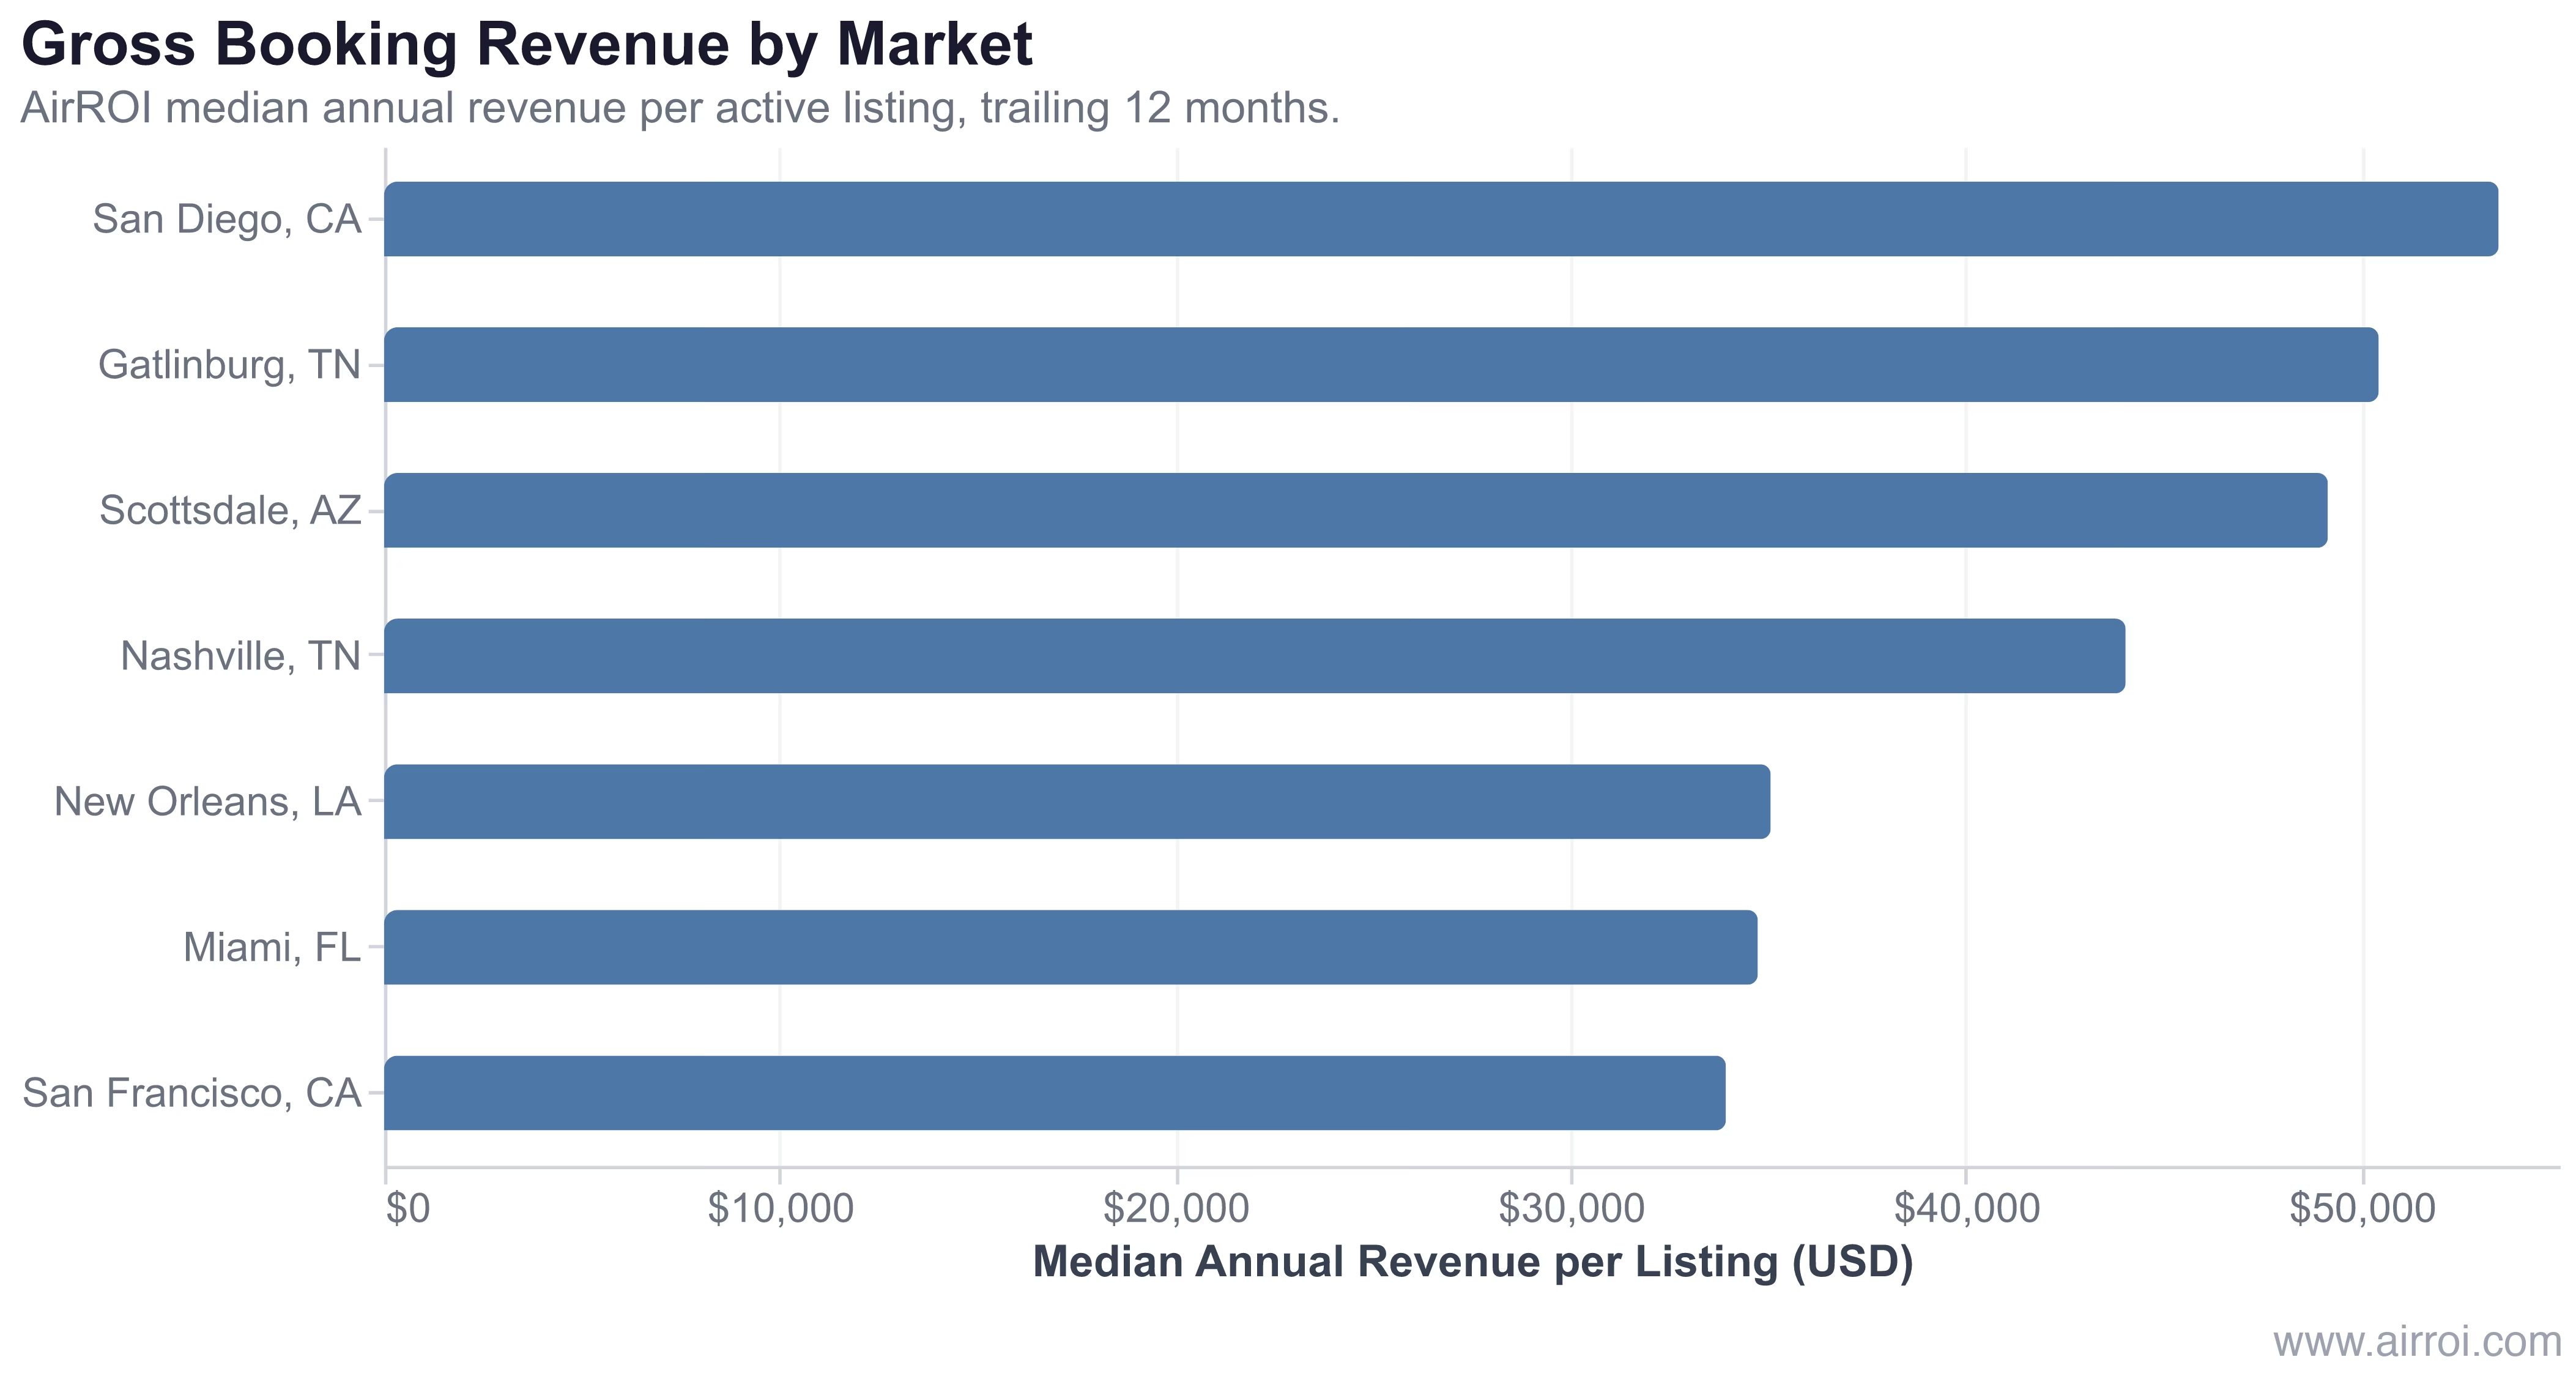
The markets with the highest gross booking revenue per listing are rarely the ones with the highest nightly rate — they are the ones that combine strong ADR with a cleaning fee structure that encourages stays long enough to amortize it.
Why Gross Booking Revenue Matters for Airbnb Hosts
True booking value. Looking at nightly rate alone understates each reservation's worth. A $150/night property with a $130 cleaning fee generates $430 gross booking revenue on a 2-night stay — not $300. Reporting and forecasting off nightly rate introduces a persistent downward bias.
Minimum-stay strategy. Once you know your per-reservation gross booking revenue at different stay lengths, you can calculate the exact minimum nights threshold where a shorter booking becomes uneconomical. Most hosts set minimums by feel; a quick gross-booking-revenue analysis by stay length makes the decision precise.
How to Optimize Gross Booking Revenue
Use length-of-stay discounts that raise total gross booking revenue. A 15% weekly discount on a $200/night listing drops the nightly rate to $170, but a 7-night stay at $170 plus a $130 cleaning fee yields $1,320 in gross booking revenue — versus $530 for a 2-night stay at full rate. Calibrate discounts against your actual cost structure, not a round percentage.
Add ancillary fees for premium services. Early check-in, late checkout, premium amenity packages, and extra guests are under-monetized by most hosts. Each incremental fee adds directly to gross booking revenue without requiring an additional reservation.
Frequently Asked Questions
Gross booking revenue includes everything the guest pays for a single reservation: nightly rates for all nights booked, cleaning fees, extra guest fees, pet fees, service fees, and any applicable taxes collected by the host. It represents the total transaction value of each booking.
Gross booking revenue refers to the total collected for a single reservation, while gross revenue is the sum of all booking revenues over a period. Gross revenue is essentially the aggregate of all individual gross booking revenues for a month, quarter, or year.
Tracking gross booking revenue per reservation helps you understand the true value of each booking. A 2-night stay at $200/night with a $150 cleaning fee generates $550 in gross booking revenue, while a 5-night stay at $180/night with the same cleaning fee generates $1,050. This insight helps optimize minimum stays and pricing.
Average daily rate (ADR) measures only the nightly rate component. Gross booking revenue is broader — it includes the cleaning fee, extra guest charges, pet fees, and taxes on top of ADR. Dividing a reservation's gross booking revenue by the number of nights booked always yields a figure higher than the listed nightly rate.
It varies by market and stay length. In AirROI's trailing-12-month data, median annual revenue per active listing ranges from roughly $34,000 in Miami to over $53,000 in San Diego — implying per-reservation gross booking revenue in the $400–$1,200 range depending on average length of stay and cleaning fee structure.