
Average Daily Rate (ADR)
Key Takeaways
- ADR = Total Rental Revenue ÷ Number of Occupied Nights (booked nights only)
- ADR reflects pricing power, not overall revenue performance — occupancy determines how many times you earn that rate
- AirROI trailing-12-month medians range from $221 (Denver) to $421 (Scottsdale) across major US markets
- Maximizing ADR without tracking occupancy can reduce total revenue — optimize for RevPAR, not ADR in isolation
- Market benchmarking is the only reliable way to know whether your ADR is competitive or underpriced
How to Calculate ADR
Formula:
ADR = Total Rental Revenue ÷ Number of Booked Nights
Example:
A property earns $6,300 in rental revenue across 30 booked nights in a month:
ADR = $6,300 ÷ 30 = $210 per night
| Metric | Formula | What it captures |
|---|---|---|
| ADR | Revenue ÷ Occupied nights | Pricing strength on booked nights |
| Occupancy | Booked nights ÷ Available nights | Calendar fill rate |
| RevPAR | ADR × Occupancy rate | Revenue efficiency across all nights |
Real ADR Benchmarks by Market
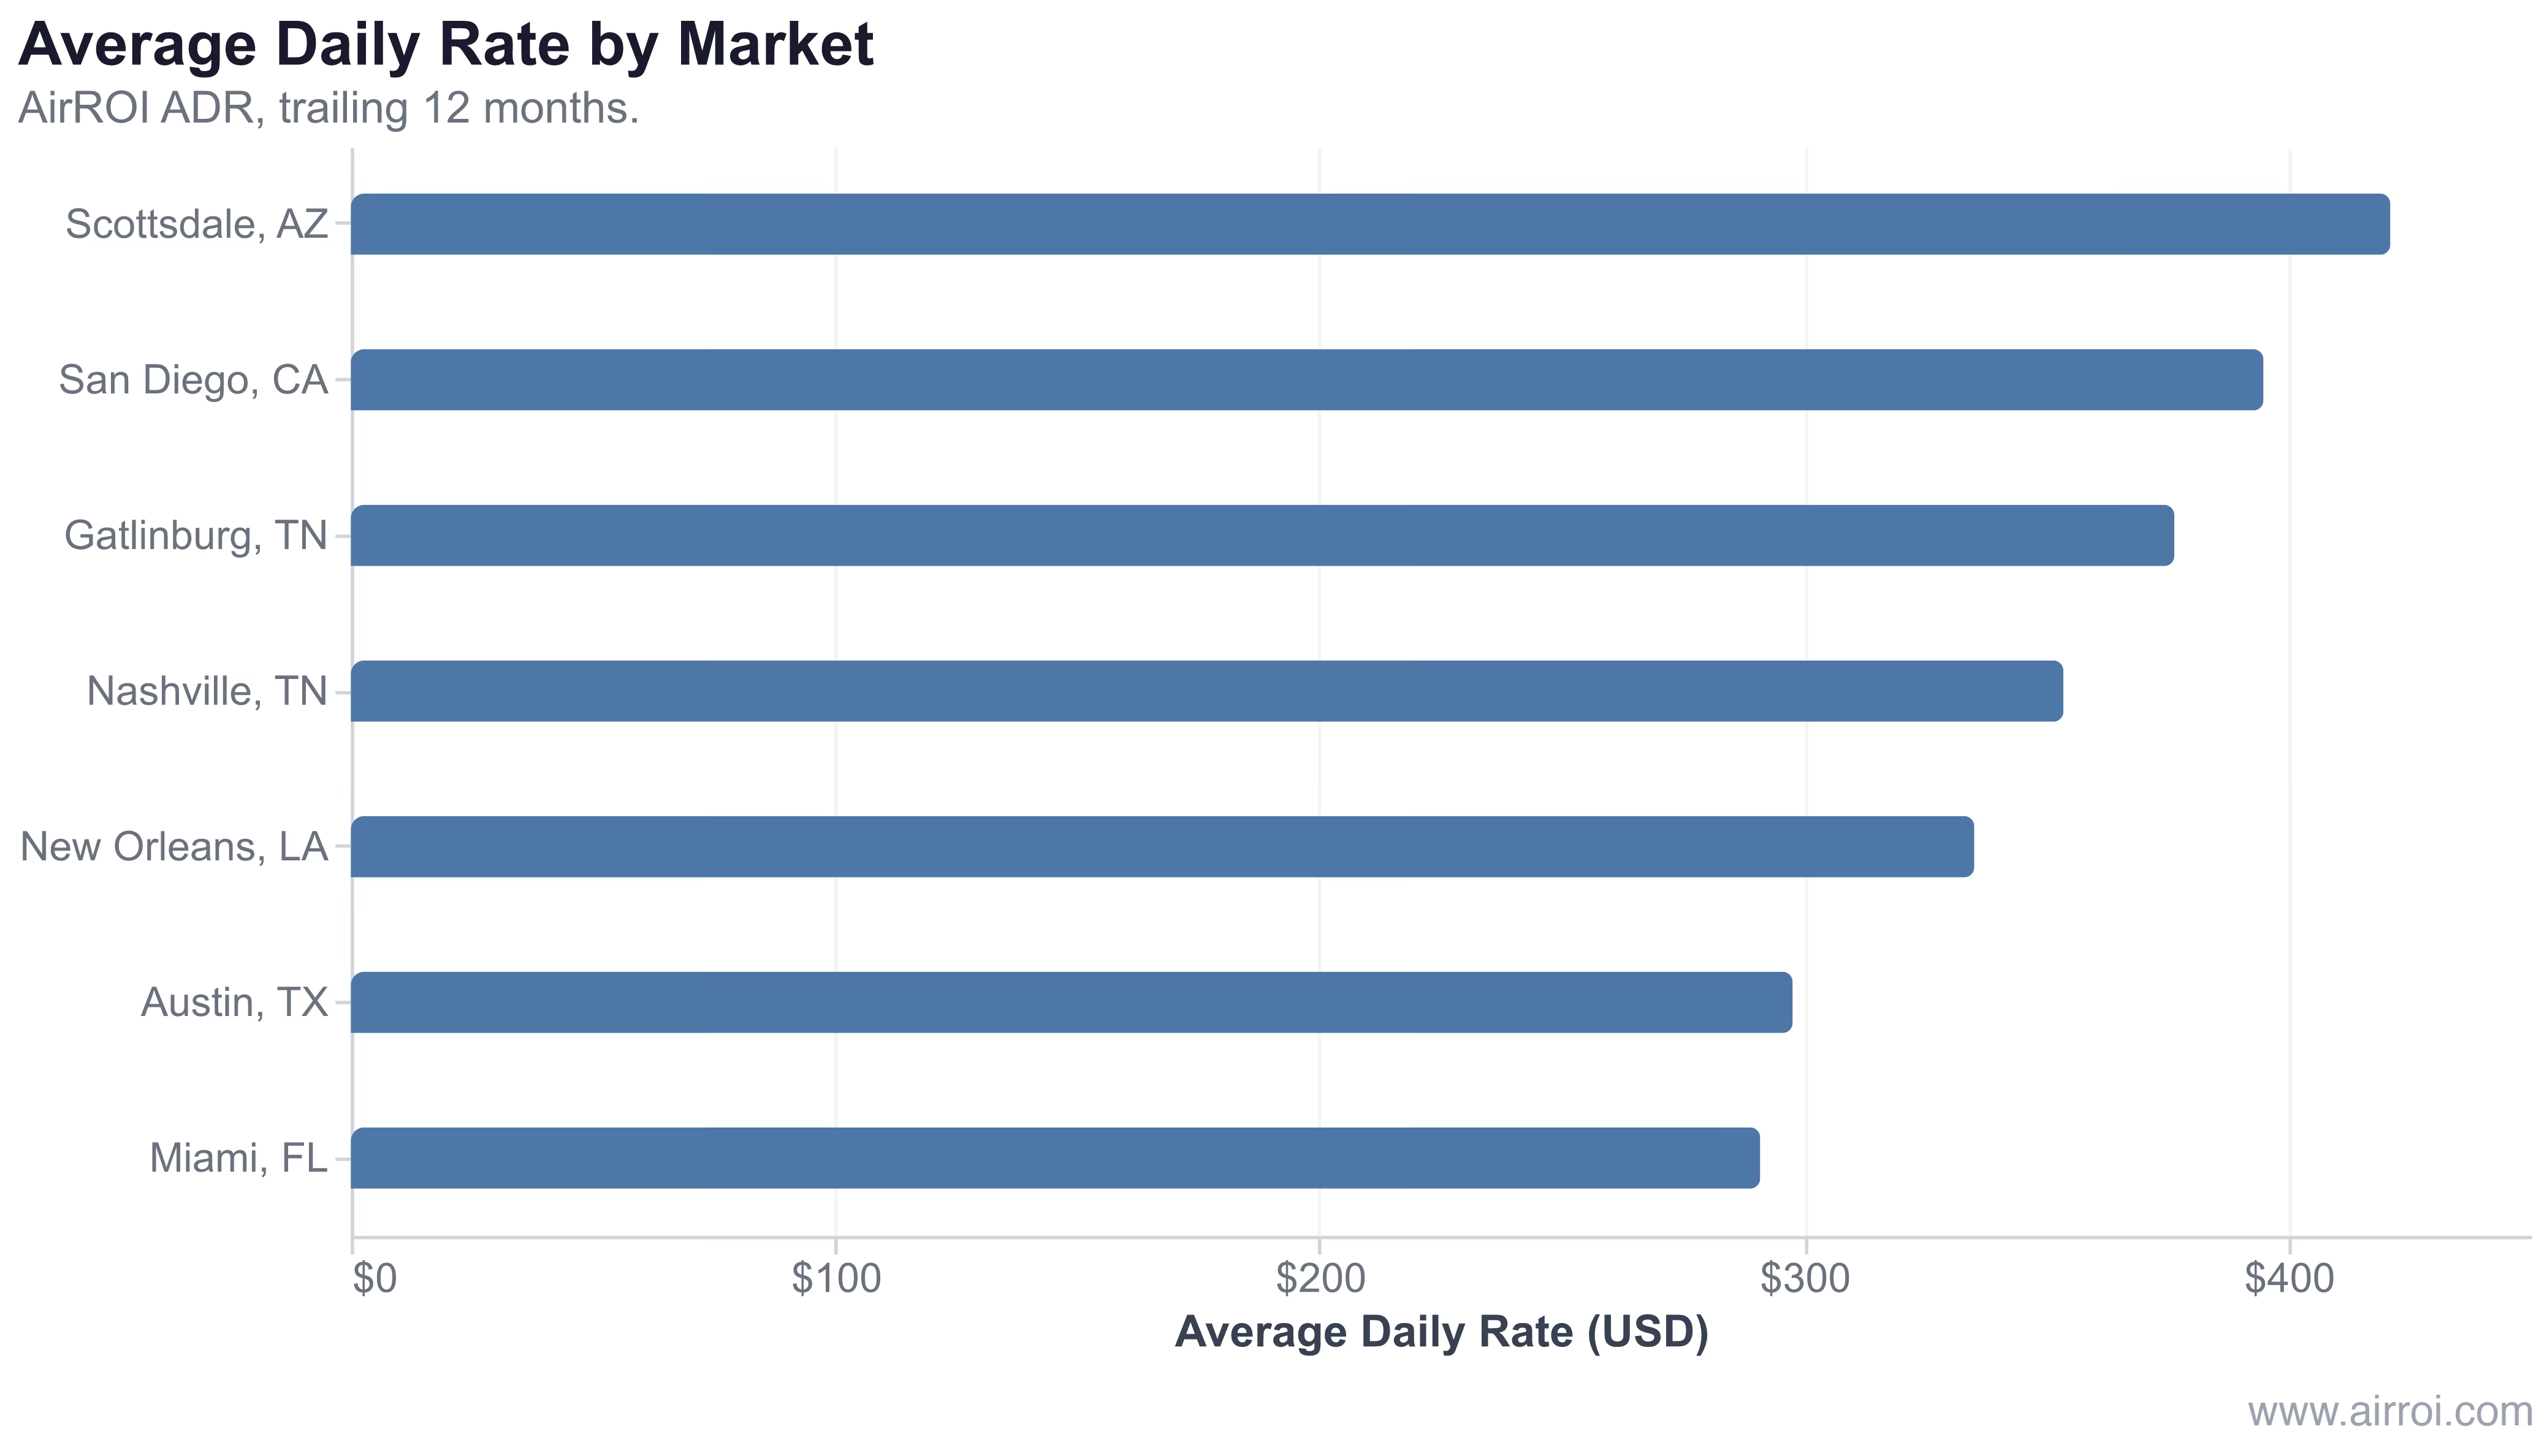
In AirROI's analysis of 45,343 active listings across seven US markets, ADR spans a $130 range — from $291 in Miami to $421 in Scottsdale — with the spread driven by property mix, market maturity, and local demand patterns rather than geography alone.
| Market | ADR (T12M) | Occupancy | RevPAR |
|---|---|---|---|
| Scottsdale, AZ | $421 | 49% | $210 |
| San Diego, CA | $395 | 53% | $212 |
| Gatlinburg, TN | $377 | 47% | $178 |
| Nashville, TN | $354 | 47% | $160 |
| New Orleans, LA | $335 | 44% | $146 |
| Austin, TX | $298 | 44% | $130 |
| Miami, FL | $291 | 49% | $143 |
AirROI data, trailing 12 months. Medians across all active listings per market.
The ADR table alone is misleading. Scottsdale leads on rate but San Diego leads on RevPAR — because San Diego's 4-point occupancy advantage converts its slightly lower rate into more total revenue per available night.
Why ADR Matters for Airbnb Hosts
ADR is the most direct read on your pricing strategy. A rising ADR — without a proportional occupancy decline — confirms that guests find your listing worth more than they paid before. A stagnating ADR in a market where comps have moved up signals lost revenue.
ADR vs. RevPAR: When to Use Each
ADR answers the question "how much do I earn per guest night?" RevPAR answers "how much do I earn per available night?" Both matter, but they diagnose different problems:
- ADR is low relative to comps: Your pricing is behind the market. Revisit your base rate, seasonal adjustments, and weekend premiums.
- RevPAR is low despite a strong ADR: Occupancy is the problem, not pricing. Your rates may be too high for your booking window, or your listing quality is suppressing conversion.
- Both are low: The market itself may be softening, or your listing is under-optimized across multiple dimensions.
How to Improve Your ADR
Price to the comp set, not to your costs. Your mortgage and operating expenses are irrelevant to what guests will pay. Pull your market's median ADR from AirROI or a similar tool, find the top quartile for listings comparable to yours, and set your base rate there. A listing with superior photos, amenities, and reviews should be in the top 25% of its comp set — not the median.
Optimize for longer stays during slower periods. A 5-night booking at $200/night captures $1,000 revenue and requires one cleaning turnover. Two separate 2-night bookings at $220/night require two turnovers and may produce $880. Length-of-stay discounts that bring in longer bookings during soft demand periods can raise effective ADR (net of cleaning costs) even while reducing the gross nightly rate.
Frequently Asked Questions
A good ADR depends entirely on your market. AirROI data shows trailing-12-month medians ranging from $221 in Denver to $421 in Scottsdale. The right benchmark is your local comp set, not a national average — a $250 ADR underperforms in San Diego ($395 median) but outperforms in Nashville ($354 median).
ADR equals total rental revenue divided by total occupied nights. If you earned $4,500 from 25 booked nights, your ADR is $180. ADR excludes unbooked nights — that is what separates it from RevPAR, which spreads revenue across all available nights.
ADR measures revenue only on nights guests actually stayed. RevPAR (Revenue Per Available Night) multiplies ADR by occupancy rate, so it penalizes vacancy. A listing with a high ADR but low occupancy can have a lower RevPAR than a competitor charging less but staying fuller.
No. Raising your nightly rate can reduce bookings enough to lower total revenue if your occupancy drops faster than your rate rises. The optimal price maximizes RevPAR — the product of ADR and occupancy — not ADR in isolation.
ADR is the primary driver of gross rental revenue, which is the starting point for net operating income (NOI). A higher ADR, held constant for occupancy, raises NOI and therefore the implied cap rate. Even a $30 ADR increase on 180 booked nights adds $5,400 to annual revenue.