
What Is Seasonality in Short-Term Rentals
Key Takeaways
- Seasonality creates annual demand cycles that repeat with enough regularity to model and price around in advance
- In coastal markets like San Diego, AirROI data shows RevPAR ranging from $149 in January to $323 in July — a 117% seasonal swing
- Most STR markets have three distinct windows: peak season, shoulder season, and off-season, each requiring different pricing and segmentation tactics
- Dynamic pricing tools encode seasonal multipliers automatically, but static-rate hosts systematically underprice peak months
- Investment pro formas built on annual average occupancy are misleading — month-by-month seasonality modeling is the only accurate way to underwrite STR cash flow
Common Seasonal Patterns by Market Type
| Market Type | Peak Season | Shoulder Season | Off-Season |
|---|---|---|---|
| Beach/coastal | June–August | April–May, September–October | November–March |
| Ski/mountain | December–March | October–November, April | May–September |
| Urban/business | Convention and event calendar | Spring and fall travel | Mid-winter, mid-summer |
| Tropical/warm climate | December–April (winter escape) | May, November | June–October (hurricane/rainy) |
| College town | Football season, graduation | Academic year | Summer break |
How Seasonality Moves the Revenue Numbers
San Diego is a textbook coastal market — warm year-round but with a clear summer peak driven by beach tourism, family travel, and Comic-Con demand. AirROI's trailing-12-month data across roughly 9,900 to 11,400 active listings shows the full seasonal curve:
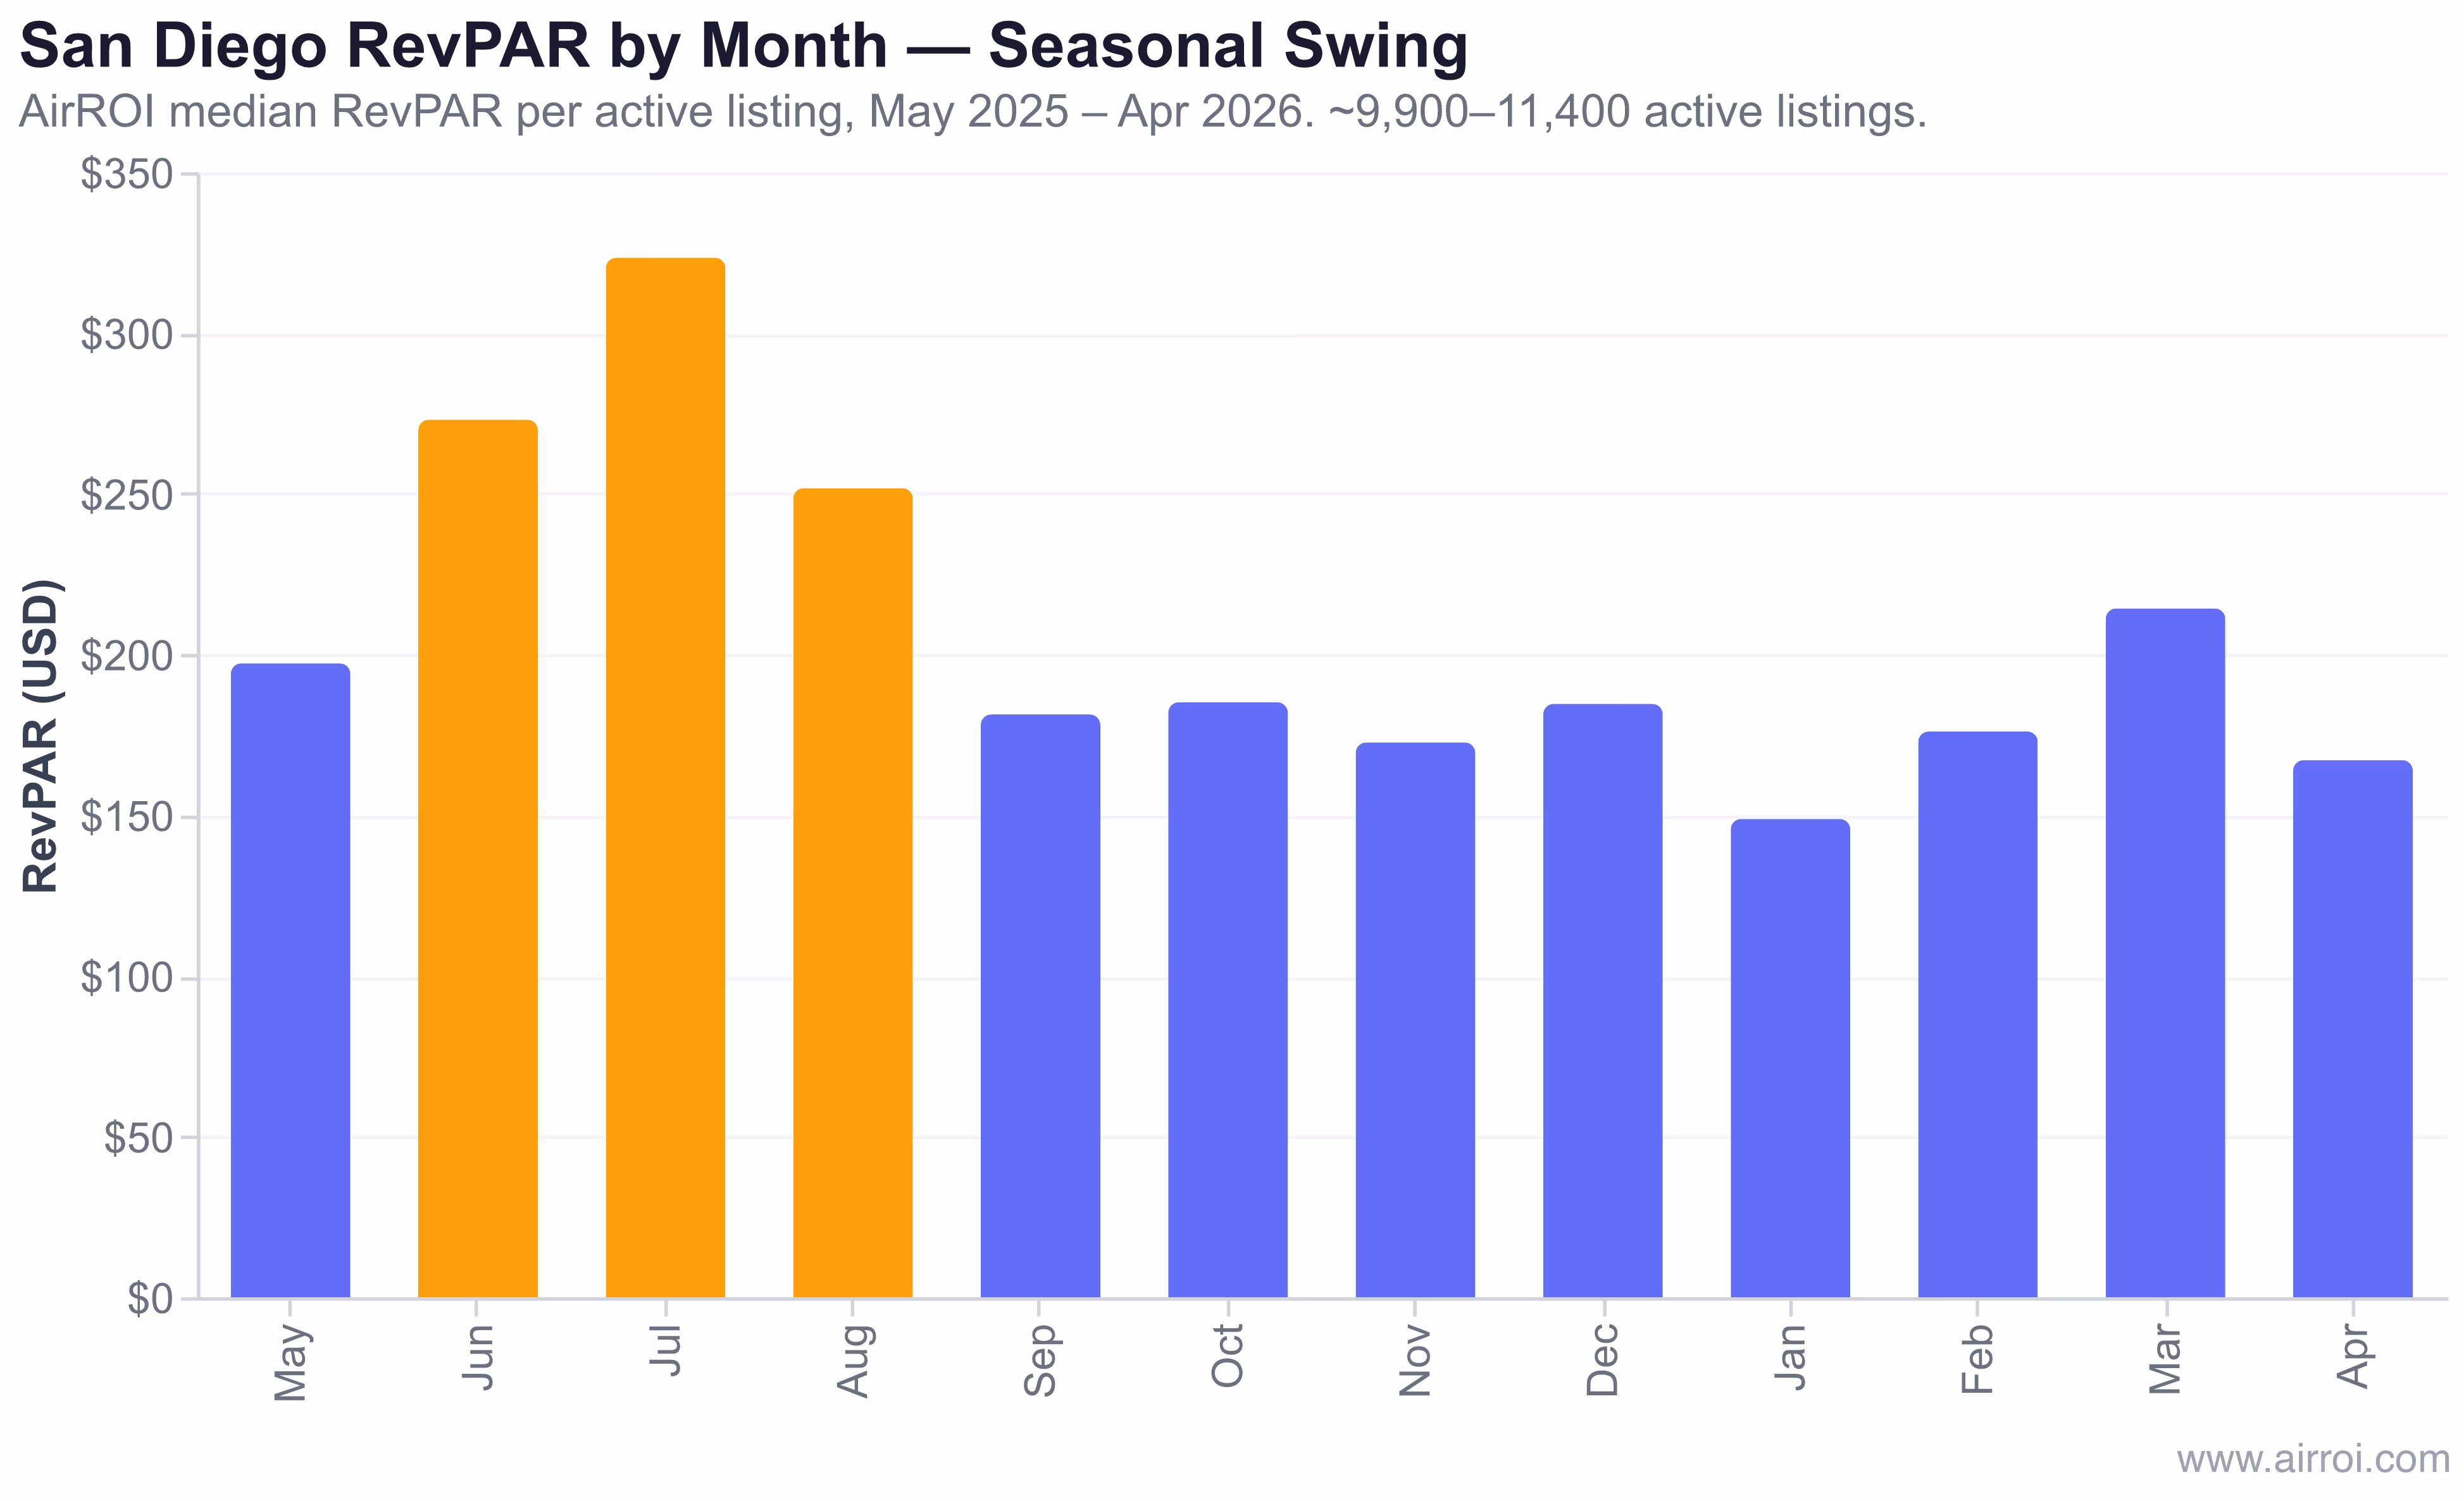
In AirROI's analysis of San Diego's ~10,600 active listings across the trailing 12 months, median RevPAR peaked at $323 in July and troughed at $149 in January. ADR followed the same arc — $471 in July versus $349 in January — while occupancy swung from 66% at the July peak to 44% in the January trough. The combined effect of higher rates and higher occupancy in summer is what makes peak-season revenue so disproportionate.
In a beach market, seasonality is not a risk to manage — it is a structural feature to price around. The hosts who win are those who capture the full July RevPAR premium and then engineer a reason to stay open profitably in January.
Seasonal Revenue Impact: Why Annual Averages Mislead
| Season | Months | Avg Nightly Rate | Occupancy | Monthly RevPAR |
|---|---|---|---|---|
| Peak (Jun–Jul) | 2 | $461 | 62% | $298 |
| Shoulder (May, Aug–Oct, Mar) | 5 | $392 | 53% | $208 |
| Off-season (Nov–Feb, Apr) | 5 | $365 | 48% | $175 |
(San Diego AirROI trailing-12-month medians, May 2025 – Apr 2026.)
A host who quotes the annual average occupancy of 53% to a lender or a buyer hides the fact that January occupancy is 44% — and that January is the month that tests whether the property covers its fixed costs. The seasonal floor, not the seasonal ceiling, determines whether an STR investment is viable.
Why Seasonality Matters for Pricing and Investment
Cash flow planning. In highly seasonal markets, 50–60% of annual revenue may arrive in 3–4 peak months. Hosts must build operating reserves during peak to cover fixed costs — mortgage, insurance, HOA — through the off-season without cutting rates below a sustainable floor.
Strategies for Managing Seasonal Revenue Swings
- Deploy dynamic pricing with market-calibrated seasonal multipliers — the tool encodes the demand curve automatically, but you must set appropriate minimum and maximum price bounds for each season.
- Segment by guest type per season. Business travelers and remote workers fill shoulder and off-season gaps; vacationing families fill peak slots. Adjust your listing, amenities, and minimum-stay rules to attract the right segment at each point in the year.
- Offer length-of-stay discounts during slow months to attract weekly and monthly renters, reducing turnover costs and vacancy simultaneously.
- Reduce orphan days in shoulder seasons by lowering minimum-stay requirements — a 3-night gap between two 7-night bookings that generates $0 is worse than a 3-night booking at a modest rate.
- Invest in amenities that broaden seasonal appeal. Hot tubs, fireplaces, and home-office setups attract off-season guests who wouldn't otherwise book a beach property in February.
- Build a peak-season reserve. Size your operating buffer for 3–5 months of fixed costs, not 1, so that a soft January doesn't force distressed pricing decisions.
Frequently Asked Questions
Seasonality drives nightly rates and occupancy up in peak months and down in the off-season. In San Diego, AirROI data shows median RevPAR reaches $323 in July versus $149 in January — a 117% swing — while ADR moves from $471 in July to $349 in January. Dynamic pricing tools encode these seasonal multipliers automatically, but hosts who set static rates leave the peak-season premium on the table.
Pull 12 months of occupancy and RevPAR data for your specific market using AirROI's Atlas tool. Look for the months where occupancy exceeds your trailing-12-month average — those are your peak and shoulder windows. Beach and coastal markets typically peak June–August; mountain and ski markets peak December–March; event-driven urban markets show spikes around convention calendars and festivals rather than a smooth curve.
Yes. Effective strategies include targeting business and remote-work travelers during the off-season, offering weekly or monthly length-of-stay discounts to attract mid-term renters in slow months, lowering minimum-stay requirements during shoulder periods to eliminate orphan days, and investing in year-round amenities like hot tubs or home-office setups. Dynamic pricing alone cannot overcome a structural demand gap — segmentation and amenity strategy fill it.
Peak season is the window of highest demand when occupancy and ADR both reach their annual maximum — typically 2–4 months long. Shoulder season is the transitional period on either side of peak, where demand is moderate and pricing flexibility matters most. Off-season is the lowest-demand window, when revenue falls and hosts must decide between holding rates and accepting vacancy or discounting to maintain cash flow.
Never size your financing or operating reserves around peak-month revenue. Model full-year cash flow by applying market-specific occupancy and ADR for each month, then stress-test the off-season months against your fixed costs — mortgage, insurance, and property taxes don't pause in January. AirROI's market metrics provide month-by-month RevPAR percentiles so you can build a conservative, season-aware pro forma.