
Off-Season / Low Season
Key Takeaways
- Off-season is the lowest-demand trough in a market's annual seasonal cycle — not just slower, but structurally different in guest type and booking behavior
- In strongly seasonal markets, occupancy can fall 25–30 percentage points from peak to off-season, compounding with lower ADR to produce 50–70% revenue drops
- Minimum price floors become the primary financial safeguard — without them, dynamic pricing tools can push rates below profitability
- Different market types have different off-seasons: desert resorts go quiet in summer, coastal markets in winter, ski areas in late spring
- Strategic adjustments to minimum stay, guest segmentation, and length-of-stay discounts can convert a near-zero off-season into a modest but meaningful revenue stream
Off-Season by Market Type
| Market Type | Typical Off-Season | Primary Driver |
|---|---|---|
| Beach / coastal | November–March | Cold weather, no beach activity |
| Desert resort | June–September | Extreme heat, no outdoor activity |
| Ski / mountain | May–September | No snow, limited summer draw |
| Urban / metro | January–February | Post-holiday travel lull |
| Tropical | June–October | Rainy / hurricane season |
| Lake / rural | October–April | Cold weather, limited recreation |
Scottsdale, AZ: Off-Season in the Data
Scottsdale is a textbook desert resort market with a clear, measurable off-season from June through September — when Phoenix-area temperatures routinely exceed 110°F and leisure travel collapses.
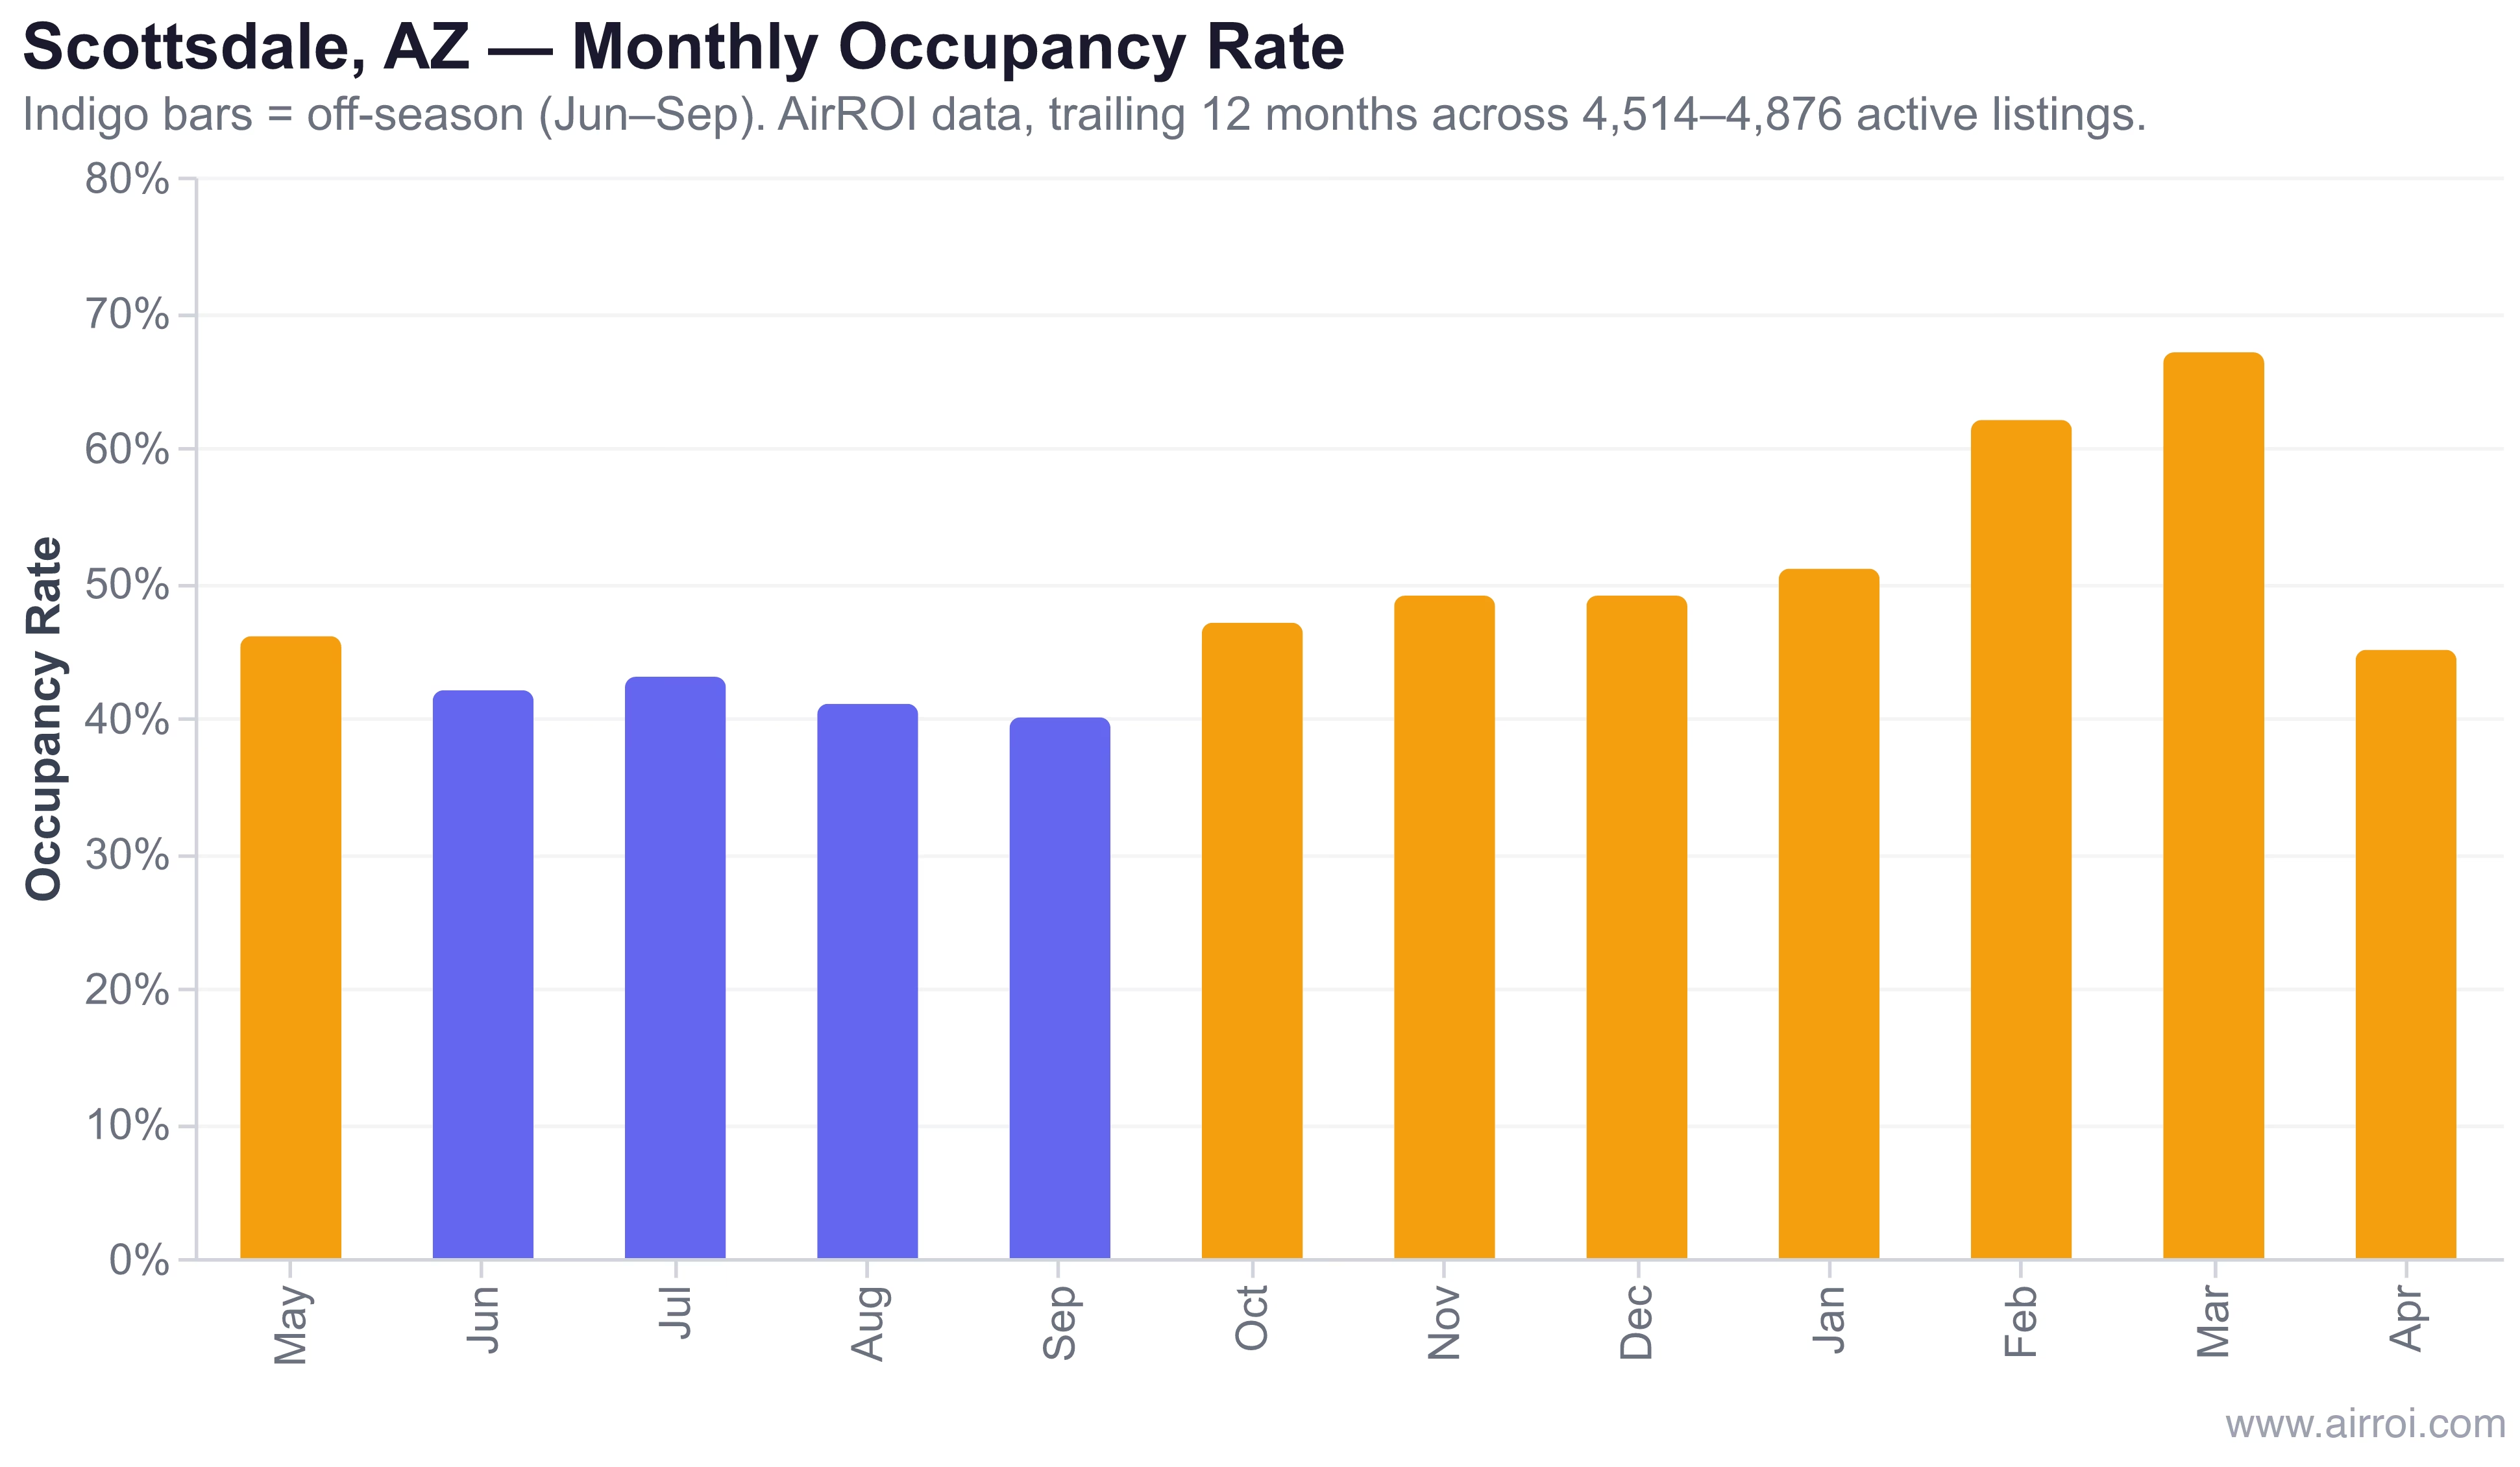
In AirROI's analysis of 4,514–4,876 active Scottsdale listings across 12 months, average monthly occupancy bottomed at 40% in September and peaked at 67% in March — a 27 percentage-point swing driven almost entirely by climate. ADR followed the same arc: $312 in July versus $567 in February, a 45% difference. Because occupancy and ADR both compress simultaneously during off-season, the compounding effect on monthly revenue is severe: March's average revenue per listing ($11,929) is roughly 3× July's ($4,021).
Off-season is not just a demand problem — it is a unit-economics problem. When both rate and occupancy fall at once, revenue declines geometrically, not arithmetically.
Why Off-Season Hits Revenue So Hard
The financial mechanics are straightforward but worth quantifying. Consider a listing earning $400 ADR at 75% occupancy in peak season — $9,000 in monthly revenue. In off-season the same listing may see $220 ADR at 42% occupancy, producing $2,772 — a 69% drop, even though rates only fell 45%. That amplification is what makes off-season the highest-leverage period for management decisions.
| Metric | Peak Season | Off-Season | Change |
|---|---|---|---|
| Avg nightly rate (ADR) | $400 | $220 | −45% |
| Occupancy | 75% | 42% | −33 pp |
| Monthly revenue (30-night month) | $9,000 | $2,772 | −69% |
| RevPAR | $300 | $92 | −69% |
Strategies for Off-Season Revenue
- Enable and calibrate dynamic pricing — let it float down toward but never below your minimum-price floor; tools like PriceLabs and Wheelhouse have off-season-specific modes that hold rates more aggressively once a floor is set
- Lower minimum stay to 1–2 nights — off-season guests often take spontaneous short trips; a 3-night minimum that made sense in peak season forfeits those bookings entirely
- Add length-of-stay discounts — weekly (10–15%) and monthly (25–40%) rates attract remote workers and extended-stay guests who fill long stretches of otherwise empty calendar; see length-of-stay discount for structure
- Target year-round guest segments — business travelers, digital nomads, relocating families, and medical travelers have demand that ignores leisure seasonality
- Update listing copy and photos — swap summer pool photos for fireplace or cozy interior shots; write headline copy that speaks to off-season use cases ("work-from-home retreat," "quiet winter getaway")
- Deploy last-minute discounts strategically — a 10–15% discount applied 3–7 days out can fill otherwise empty nights without training guests to wait for deals; keep the discount window short and the discount modest
- Schedule maintenance and deep renovations during the slowest weeks — deferred maintenance completed in off-season costs nothing in lost revenue and raises listing quality before the shoulder-season ramp
Off-Season vs. Shoulder Season
Internal Links
Frequently Asked Questions
Lower your nightly rate to your minimum-price floor, reduce minimum stay requirements to 1–2 nights, offer length-of-stay discounts (weekly 10–15%, monthly 25–40%), and target remote workers, business travelers, and medical travelers who book year-round. Update your listing to spotlight off-season amenities — fireplace, heated pool, proximity to indoor attractions — so the listing reads as seasonally appropriate rather than simply discounted.
Not usually. Even at reduced rates, off-season bookings offset fixed costs — mortgage, insurance, HOA fees, and utilities — that continue regardless of occupancy. Temporary closure makes sense only when off-season rates barely cover variable costs (cleaning, supplies, utilities) and bookings are rare; in that case, use the downtime for renovations or personal use and reopen before the shoulder season ramp begins.
In strongly seasonal markets, ADR drops 30–50% from peak to off-season. AirROI data for Scottsdale, AZ shows average monthly ADR ranging from $312 in July to $567 in February — a 45% swing — while occupancy falls from 67% in March to 40% in September. Urban markets with year-round demand typically see smaller swings of 15–25%.
Off-season is the lowest-demand trough — the weeks or months when bookings and rates hit their annual floor. Shoulder season sits between off-season and peak season: demand is recovering (or fading), rates are moderate, and flexible pricing can capture last-minute bookings that peak-season travelers book far in advance. Many hosts find shoulder season offers the best revenue-per-effort ratio because competition is lower than peak but volume is higher than true off-season.
No. Off-season timing, depth, and duration vary significantly by market type. Desert resort markets like Scottsdale see their sharpest occupancy dips in summer heat (June–September). Coastal beach markets go quiet November–March. Ski and mountain markets face a shoulder period May–September when snow is gone. Urban metros have mild seasonality with only a 10–20 percentage-point occupancy swing, often driven by conventions and holidays rather than weather.