
Dynamic Pricing
Key Takeaways
- Dynamic pricing algorithms raise rates when demand is high and reduce them when demand is soft, maximizing revenue across the calendar
- Hosts who switch from static to dynamic pricing typically see annual revenue gains of 10–40%
- The core inputs are demand factors, competitor rates, seasonality patterns, day-of-week effects, and booking lead time
- Hosts retain control by setting a minimum price floor and a maximum price ceiling around which the algorithm operates
- Third-party tools (PriceLabs, Beyond, Wheelhouse) consistently outperform Airbnb's built-in Smart Pricing on revenue per booking
How Dynamic Pricing Works
- Market demand signals — local event calendars, search volume, and booking pace relative to historical norms for the same dates
- Comparable listings — real-time rates for similar properties in your market, adjusted for amenities and listing quality
- Seasonality patterns — historical peak, shoulder, and off-season baselines specific to your market
- Day-of-week effects — weekends and holidays in high-demand markets command a consistent premium over midweek nights
- Lead time — rates may drop via last-minute discounts as check-in approaches or rise when early bookings signal strong forward demand
The formula is straightforward: the engine multiplies your base price by a demand factor (e.g., 1.4× for a sold-out weekend, 0.85× for a slow Tuesday) and clips the result to your minimum and maximum price bounds. The rate updates automatically — some tools reprice multiple times per day.
RevPAR by Market — Dynamic Pricing Impact
RevPAR (revenue per available night) is the single number that shows how well a market's pricing power translates to actual income. High RevPAR markets reward disciplined dynamic pricing; low RevPAR markets often signal underpricing or oversupply — both problems dynamic pricing directly addresses.
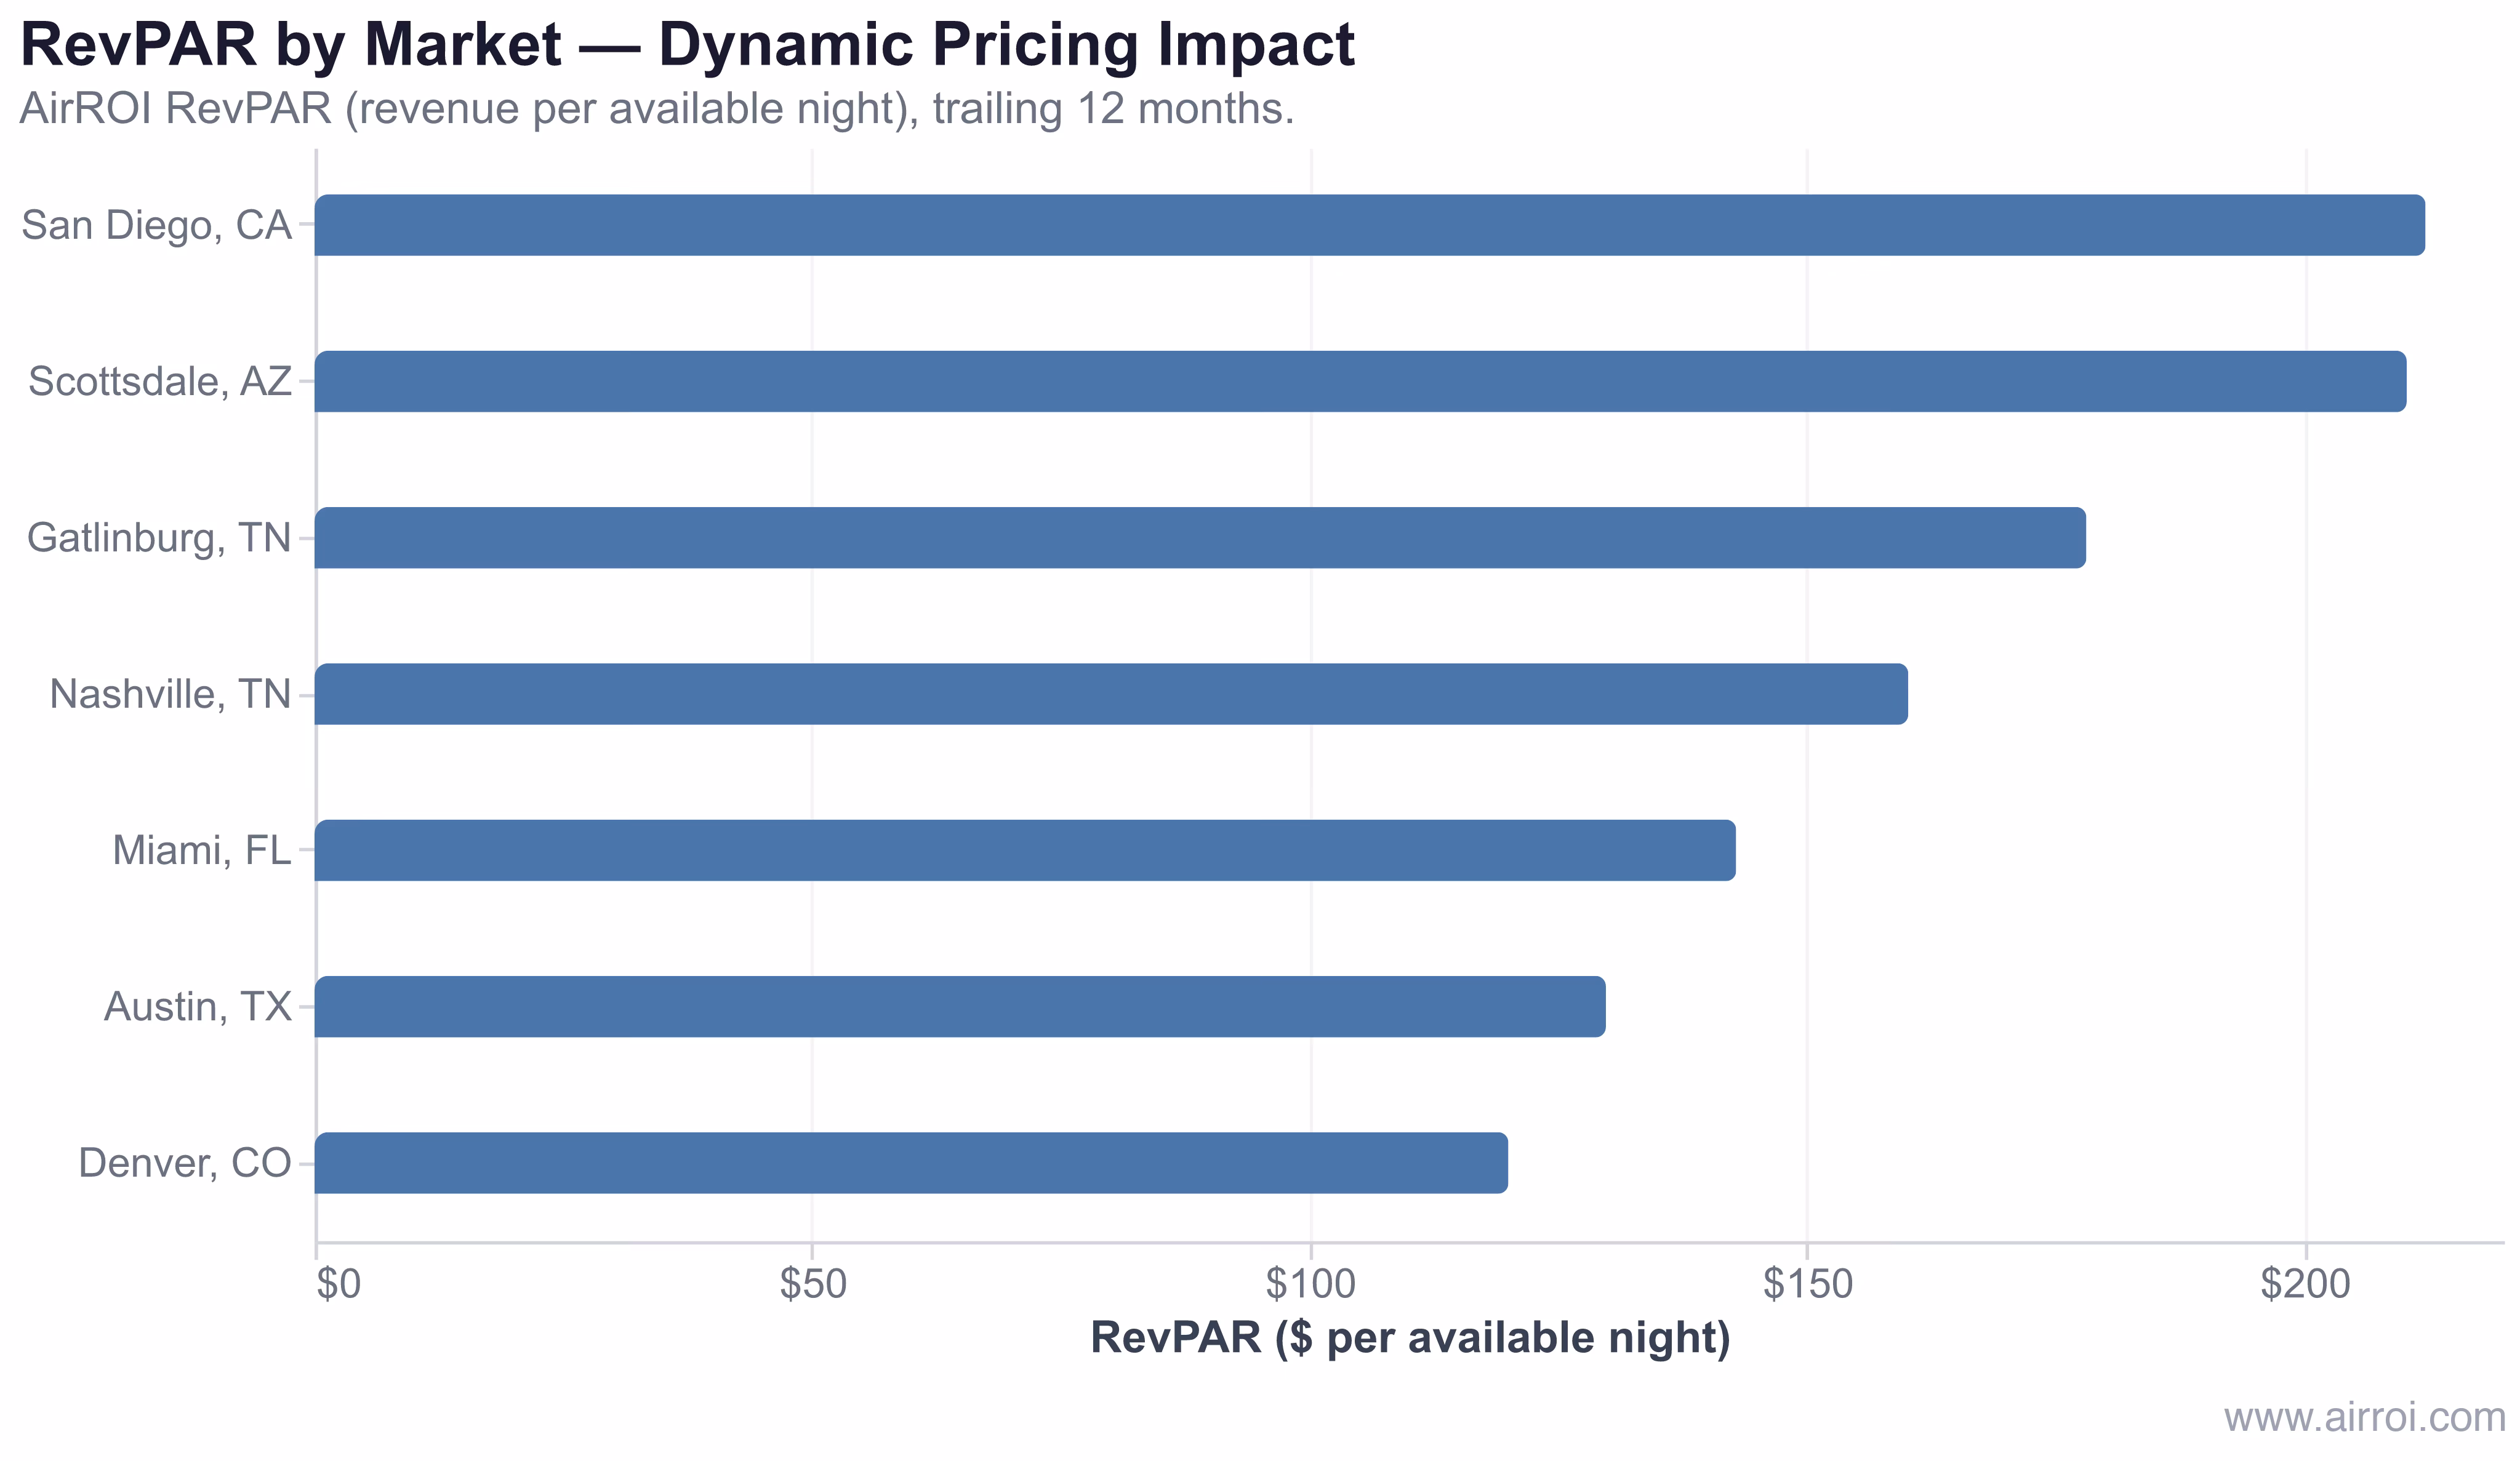
In AirROI's analysis of more than 43,000 active listings across these seven US markets, RevPAR ranges from $120 in Denver to $212 in San Diego — a 77% spread on a single metric. The gap between the top and bottom of this chart is precisely the opportunity dynamic pricing closes: a Denver host pricing at San Diego-equivalent efficiency on peak nights moves the needle materially on annual revenue.
| Market | RevPAR | ADR | Occupancy |
|---|---|---|---|
| San Diego, CA | $212 | $395 | 53% |
| Scottsdale, AZ | $210 | $421 | 49% |
| Gatlinburg, TN | $178 | $377 | 47% |
| Nashville, TN | $160 | $354 | 47% |
| Austin, TX | $130 | $298 | 44% |
| Miami, FL | $143 | $291 | 49% |
| Denver, CO | $120 | $222 | 54% |
The RevPAR spread between San Diego and Denver is $92 per available night. Over 365 nights, that gap represents $33,580 in potential revenue — and the single biggest lever closing it is systematic, data-driven rate management.
Why Dynamic Pricing Matters
- Revenue maximization: Capturing rate premiums during peak demand directly boosts ADR and RevPAR — the two metrics that determine whether an STR investment pencils out
- Occupancy protection: Lowering rates during soft demand windows fills orphan days and reduces vacancy drag on annual revenue
- Competitive alignment: Real-time rate adjustments keep your listing priced relative to comparable properties, preventing both overpricing (lost bookings) and underpricing (lost revenue)
- Time efficiency: Automated repricing eliminates the daily manual work of monitoring competitor rates and updating your calendar
Dynamic Pricing Tools Compared
| Tool | Pricing model | Key strength | Best for |
|---|---|---|---|
| Airbnb Smart Pricing | Free | Zero setup, built-in | Beginners, single listings |
| PriceLabs | ~$20/mo | Customization, market data | Data-driven hosts |
| Beyond | ~1% of revenue | Ease of use, PMS integrations | Property managers |
| Wheelhouse | ~1% of revenue | Flexible strategies | Portfolio optimization |
| DPGO | ~$1/night | Granular control | Advanced multi-unit hosts |
The critical distinction: Airbnb Smart Pricing optimizes for the platform's booking volume, not your revenue. Independent analyses — including a 2023 study published in the Journal of Revenue and Pricing Management — have consistently found that third-party tools produce 5–15% higher annual revenue than Smart Pricing alone, because they apply tighter RevPAR targeting and honor host-defined rate floors.
Practical Tips for Getting the Most from Dynamic Pricing
- Set a realistic minimum price that covers your per-night operating cost (cleaning, utilities, management fees) — the algorithm will never go below it
- Review your base price quarterly — every seasonal shift alters what a correct base looks like, and a stale base skews all automated rates
- Layer in length-of-stay discounts alongside dynamic pricing to pull longer bookings that smooth occupancy and reduce turnover cost
- Override manually for major events — large local events (concerts, conferences, sporting events) often drive demand that outpaces the algorithm's forecast; add manual minimums for those dates
- Benchmark monthly against your market's ADR and occupancy to confirm your dynamic tool is performing, not just repricing randomly
Frequently Asked Questions
Yes. Dynamic pricing consistently increases annual STR revenue by 10–40% compared to static pricing. It captures peak-demand premiums you would otherwise miss and fills low-demand gaps that would stay vacant at a fixed rate, directly improving both ADR and RevPAR.
Dynamic pricing tools analyze real-time data — local demand signals, competitor rates, seasonality, day of week, and booking lead time — and automatically calculate an optimal nightly rate, sometimes updating multiple times per day, anchored to your base price and bounded by your minimum and maximum price settings.
Airbnb Smart Pricing prioritizes platform booking volume over host revenue, which tends to push rates lower. Third-party tools like PriceLabs, Beyond, and Wheelhouse give hosts granular control over pricing rules, rate floors, and market-data inputs, which typically yields higher revenue per booking.
Markets with high RevPAR variance — where demand swings sharply between peak and shoulder periods — benefit most. San Diego ($212 RevPAR) and Scottsdale ($210 RevPAR) show the ceiling; markets like Denver ($120 RevPAR) and Austin ($130 RevPAR) have more room to close the gap through disciplined rate management.
Set your base price at the rate you would comfortably accept on a median midweek night in shoulder season. If your base is too high, the algorithm underbooks slow periods; too low and it gives away peak nights. Review and adjust your base price at least quarterly as the market shifts.