
Booking Curve
Booking curve (also called booking pace) is a real-time demand signal that plots cumulative reservations against days before check-in for a future date. When your curve runs ahead of its historical average, your dates are filling faster than usual — a clear directive to raise rates. When it lags, you are overpriced relative to current demand and need to act before the date passes at low or no occupancy.
Key Takeaways
- A booking curve plots cumulative reservations from the moment a date opens until check-in; the shape and position relative to history reveal true demand
- Curves ahead of historical pace signal underpricing — raise rates immediately to capture the demand premium
- Dynamic pricing tools use booking curve data as a primary input for demand multipliers
- AirROI data shows average booking lead times ranging from 35 days (Miami, Austin) to 58 days (Gatlinburg, New Orleans) — market type determines the natural curve shape
- Event spikes — a single date filling far faster than its neighbors — are the most actionable booking curve signals for immediate rate increases
- Understanding your market's typical curve is the prerequisite for applying early-bird and last-minute discount strategies correctly
How to Read a Booking Curve
A booking curve has days-before-check-in on the X-axis (decreasing left to right, so the right edge is check-in day) and cumulative bookings or occupancy percentage on the Y-axis. The critical reference is not the curve's absolute position but its position relative to the same date's historical average:
| Curve Position | Demand Signal | Recommended Action |
|---|---|---|
| Above historical average | Demand stronger than normal | Raise rates; remove discounts |
| On historical average | Normal demand | Hold current pricing |
| Below historical average | Demand weaker than normal | Review comps; lower rates before resorting to last-minute discounts |
The slope matters as much as the position. A curve that was on pace but suddenly steepens signals a late-breaking demand driver — a newly announced event, a competitor's calendar gap, or a regional surge in travel. That inflection point is when rate increases have the highest leverage.
Booking Lead Time by Market: Real Data
The average booking lead time — how many days in advance guests book their stay — defines the natural width of the booking curve. Markets with short lead times compress all demand into the final two to three weeks; markets with long lead times give hosts weeks or months of pricing runway.
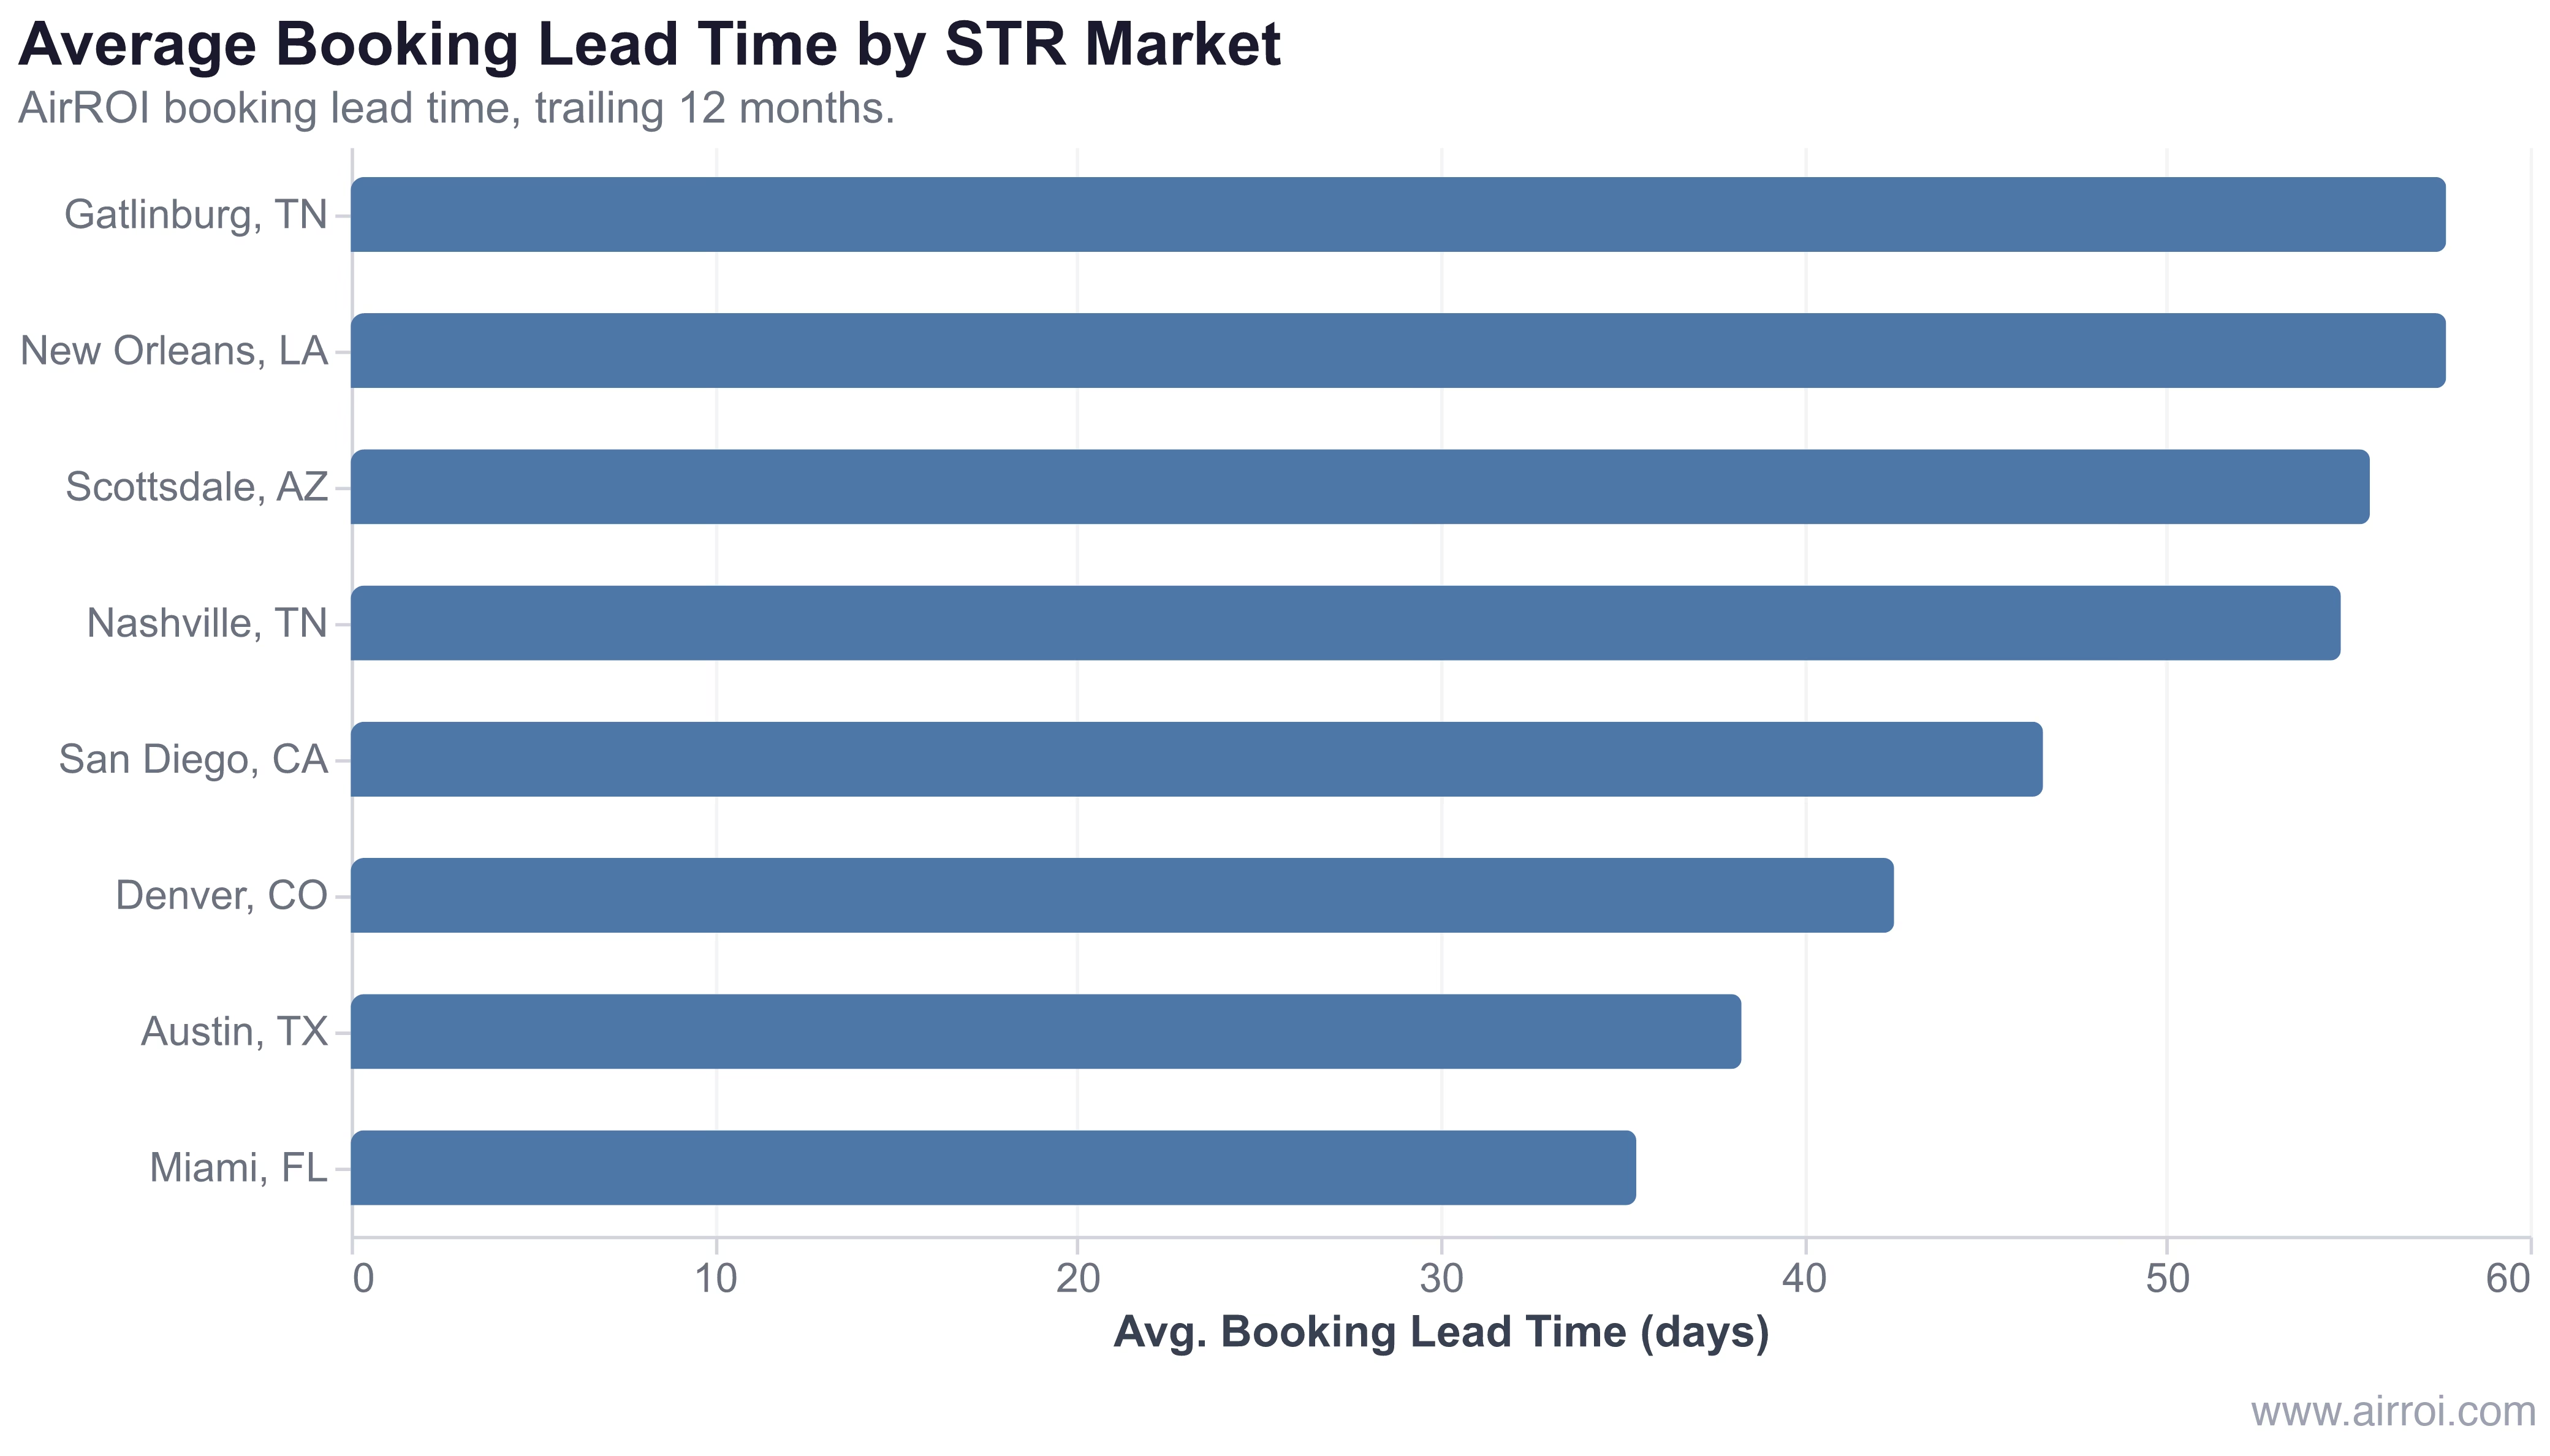
In AirROI's analysis of more than 50,000 active listings across eight US markets, average booking lead time ranges from 35 days in Miami to 58 days in Gatlinburg — a gap that fundamentally changes how a host should structure their pricing calendar.
| Market | Avg. Lead Time | Active Listings | Booking Curve Type |
|---|---|---|---|
| Gatlinburg, TN | 57.7 days | 3,622 | Early-loading, gradual slope |
| New Orleans, LA | 57.7 days | 5,007 | Early-loading, event-driven spikes |
| Scottsdale, AZ | 55.6 days | 4,310 | Early-loading, sharp winter peak |
| Nashville, TN | 54.8 days | 6,165 | Moderate-early, weekend spikes |
| San Diego, CA | 46.6 days | 9,560 | Moderate, summer front-loading |
| Denver, CO | 42.5 days | 3,739 | Moderate, ski/summer bimodal |
| Austin, TX | 38.3 days | 8,774 | Late-loading, event-heavy |
| Miami, FL | 35.4 days | 7,905 | Late-loading, short-stay dominant |
Gatlinburg books 64% further in advance than Miami. A host who prices both markets with the same discount trigger timeline is systematically leaving revenue on the table in one of them.
Why Market Type Determines Curve Shape
Leisure travelers plan further ahead because flexibility is lower and competition for top properties is higher, especially around holidays and school breaks. Business and urban travelers book closer to the check-in date because itineraries change. This structural difference creates two distinct booking curve archetypes:
Strategies Based on Booking Curve Analysis
When dates book slower than normal: Audit your rate against direct comparables before touching discounts. A rate 15% above market will produce a lagging curve; a 10% cut often returns the curve to pace without the deeper discount that a panic move creates.
When a single date spikes: A specific date booking 3-4x faster than its neighbors almost always means a local event. Check event calendars, raise that date immediately, and consider blocking surrounding dates if minimum-night controls allow you to capture the full event stay.
Frequently Asked Questions
A booking curve is a graph that plots the cumulative percentage of bookings for a future date or period over time. It shows how reservations accumulate from the moment a date opens for booking until check-in, helping hosts understand whether bookings are ahead of, on, or behind pace compared to historical patterns.
If your booking curve is ahead of pace (dates filling faster than normal), raise your rates — demand is strong and you are likely underpriced. If the curve is behind pace, consider lowering rates or adding last-minute discounts to stimulate bookings. Dynamic pricing tools use this data automatically.
Average booking lead time varies by market: urban markets average 35-47 days, while leisure and event-destination markets like Gatlinburg and New Orleans average nearly 58 days. Compare your lead time to your market average using analytics tools to determine if you are booking too early (underpriced) or too late (overpriced).
Leisure travelers plan further ahead to secure the best properties and prices, especially for holiday periods and events. Urban business travelers book much closer to the stay date because travel plans are less predictable. This structural difference drives distinct booking curve shapes — gradual and early-loading for vacation markets, steep and late-loading for urban ones.
Yes. An unexpected spike in reservations for a specific date — while surrounding dates remain flat — is a reliable signal that a local event has been announced. Hosts who monitor their booking curve can raise rates for that date before the market adjusts, capturing the full demand premium.