
Demand Factor / Demand Multiplier
Key Takeaways
- Demand factor is a multiplier (typically 0.5 to 3.0+) applied to your base price every time pricing algorithms recalculate rates
- Values above 1.0 signal strong demand and raise your rate; values below 1.0 reduce it to protect occupancy
- It is the primary lever through which dynamic pricing tools translate market signals into nightly price changes
- Multiple demand signals — seasonality, events, competitor rates, and booking pace — feed into a single composite multiplier
- Your minimum and maximum price guardrails cap the real-world effect of any demand factor the algorithm produces
How Demand Factor Works
Formula:
Adjusted Rate = Base Price × Demand Factor
The demand factor itself is a composite of several sub-factors that pricing engines calculate simultaneously:
| Sub-Factor | What It Measures | Example Impact |
|---|---|---|
| Market demand | Search volume and booking pressure | +0.2 during high-demand week |
| Competitor pricing | Rates of comparable nearby listings | +0.1 if comps raised rates |
| Seasonality | Time-of-year demand patterns | +0.3 during peak season |
| Day of week | Weekend vs. weekday demand | +0.15 for Friday/Saturday |
| Lead time | How far out the date is | −0.1 for same-week availability |
| Event proximity | Local events, holidays, festivals | +0.5 for major concert weekend |
Example: A $180 base price with a composite demand factor of 1.45 (strong weekend demand during shoulder season near a local festival) produces an adjusted rate of $261 per night. The same property in deep off-season with a factor of 0.75 would price at $135 — capturing the booking rather than sitting vacant.
Demand Factor Ranges by Demand Level
| Demand Level | Factor Range | Scenario Example |
|---|---|---|
| Very low | 0.5–0.7 | Deep off-season, mid-week, no events |
| Low | 0.7–0.9 | Off-season weekend or shoulder season weekday |
| Normal | 0.9–1.1 | Average demand, no special drivers |
| High | 1.1–1.5 | Peak season weekend, moderate event |
| Very high | 1.5–2.0 | Major holiday, sold-out event nearby |
| Extreme | 2.0–3.0+ | Super Bowl, New Year's Eve, once-a-year events |
How Demand Factor Drives ADR Across Markets
The clearest proof that demand factor works is the gap in average daily rate between high-demand and moderate-demand markets. In AirROI's analysis of 36,170 active listings across six US markets, ADR swings nearly $200 between the highest and lowest performers — a spread that algorithmic demand-factor pricing is specifically designed to capture.
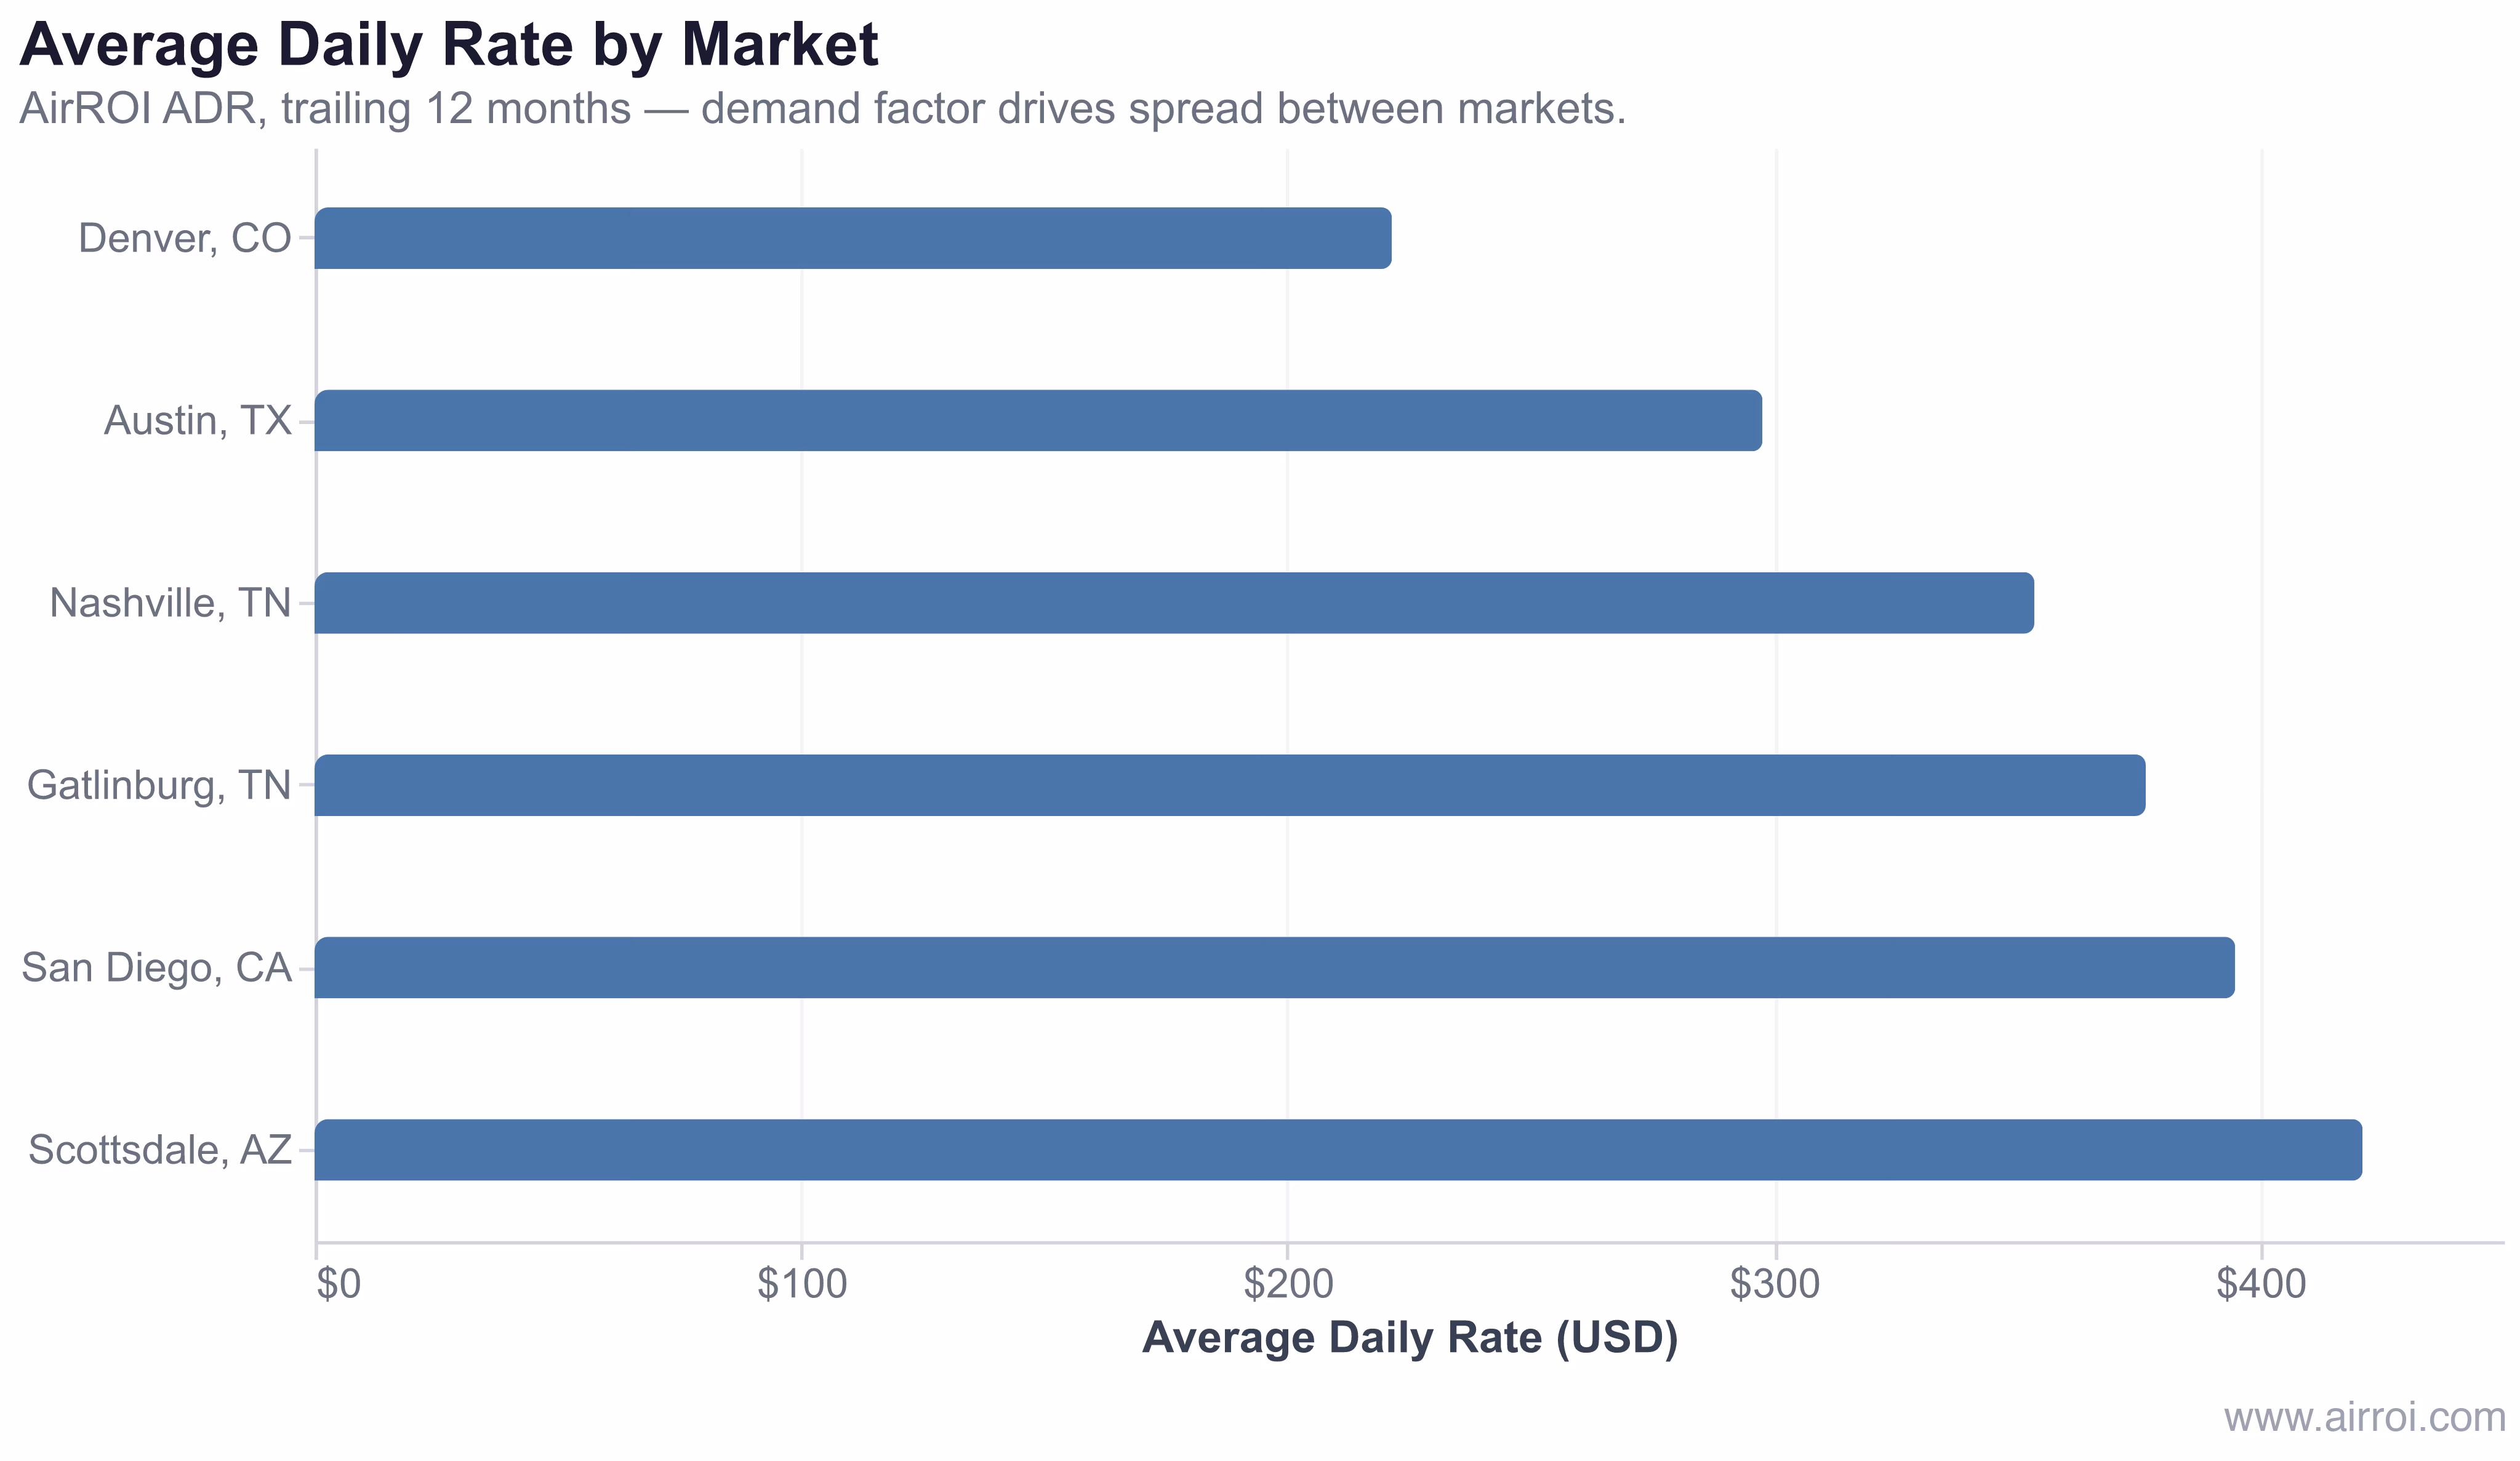
| Market | Median ADR | Active Listings |
|---|---|---|
| Scottsdale, AZ | $421.1 | 4,310 |
| San Diego, CA | $394.9 | 9,560 |
| Gatlinburg, TN | $376.5 | 3,622 |
| Nashville, TN | $353.6 | 6,165 |
| Austin, TX | $297.7 | 8,774 |
| Denver, CO | $221.5 | 3,739 |
Markets like Scottsdale and San Diego sustain ADRs above $390 because their pricing algorithms are responding to consistently high demand factors — compressed supply, strong leisure travel patterns, and event calendars that keep multipliers elevated through large portions of the year. Denver's lower ADR reflects more moderate demand signals, not inferior properties.
The demand factor does not invent demand — it measures it. Scottsdale's $421 ADR is what the market will bear; the multiplier's job is to find that ceiling in real time rather than leaving it as lost revenue.
Why Demand Factor Matters for Airbnb Hosts
- Revenue capture: Without demand-based adjustments, you charge the same rate on a high-demand Saturday in July as a slow Tuesday in January, consistently leaving revenue on the table.
- Occupancy balance: The demand factor lowers rates during soft periods, reducing orphan days and improving calendar efficiency. Research from STR analytics providers consistently shows that dynamic pricing lifts annual revenue 10–40% versus static pricing for hosts who calibrate their base price and guardrails correctly.
- Market responsiveness: Demand factors react to real-time changes — a competitor delisting, a weather event rerouting travel, or a concert announced last week — faster than any manual review cadence.
- Pricing precision: A single multiplier simplifies complex, multi-variable market dynamics into one actionable rate adjustment per date.
Tips for Working with Demand Factors
- Understand your tool's multiplier range so you can set appropriate min/max price guardrails — a factor of 2.5 on a $100 base price is $250; make sure your max is high enough to allow it.
- Review demand factor trends weekly to spot patterns the algorithm is detecting before they appear in your booking calendar.
- Use manual overrides sparingly — the algorithm typically outperforms gut instinct on ordinary dates; reserve overrides for events you know about and the algorithm cannot yet see.
- Combine with length-of-stay discounts to attract longer bookings even during high-demand periods, converting one high-factor night into a multi-night stay.
- Pair with competitor rate monitoring: demand factor is only as accurate as the comp-set data feeding it — verify that your pricing tool is tracking the right comparable listings.
Frequently Asked Questions
A demand factor is a numerical multiplier (e.g., 1.3 or 0.8) applied to your base price to reflect current market demand. A factor above 1.0 raises the rate because demand is strong; a factor below 1.0 lowers it because demand is weak. It is the core mechanism behind dynamic pricing rate adjustments.
Dynamic pricing tools calculate it using signals like local search volume, booking pace, competitor occupancy, event calendars, and historical demand patterns. The exact formula varies by tool but generally combines these inputs into a single multiplier between roughly 0.5 and 3.0.
Yes. Most dynamic pricing tools allow manual overrides for specific dates. If you know a major local event will drive exceptional demand, you can set a custom rate or multiplier for those dates that exceeds what the algorithm calculates.
Peak-season demand factors typically run 1.1 to 1.5 for moderate events and strong seasonal pressure, climbing to 1.5–2.0 for major holidays and sold-out events. Extreme occasions like New Year's Eve or the Super Bowl can push multipliers above 2.0 in the markets closest to the event.
No. A demand factor above 1.0 raises rates, which can reduce booking probability if it prices you above comparable listings. The algorithm balances rate and occupancy; your minimum and maximum price guardrails determine the ceiling and floor, so the factor itself cannot override those limits.