
Supply
Key Takeaways
- Supply equals the count of active listings (or total available nights) in a market at a given point in time
- Rising supply without proportional demand growth pushes occupancy and ADR down, accelerating market saturation
- Regulations are the single most powerful supply shock: New York City's 30-day minimum rule cut active listings by roughly 60% between 2023 and 2026
- Track supply at the submarket level — a surge in studios does not directly compete with a 4-bedroom cabin
- Year-over-year supply growth rate is more informative than absolute listing count; compare it against demand growth to gauge trajectory
How Supply Is Measured
There are two primary ways to quantify short-term rental supply:
| Measurement | Definition | Best For |
|---|---|---|
| Active listing count | Number of active listings with at least one booking or calendar update in the past 12 months | Quick market sizing and growth tracking |
| Total available nights | Sum of all available nights across every active listing | Granular capacity and absorption analysis |
Example: A market with 500 active listings, each blocking an average of 25 nights per month, carries a monthly supply of 12,500 available nights — a number that scales naturally when comparing markets of different sizes.
Supply Depth Across Major US Markets
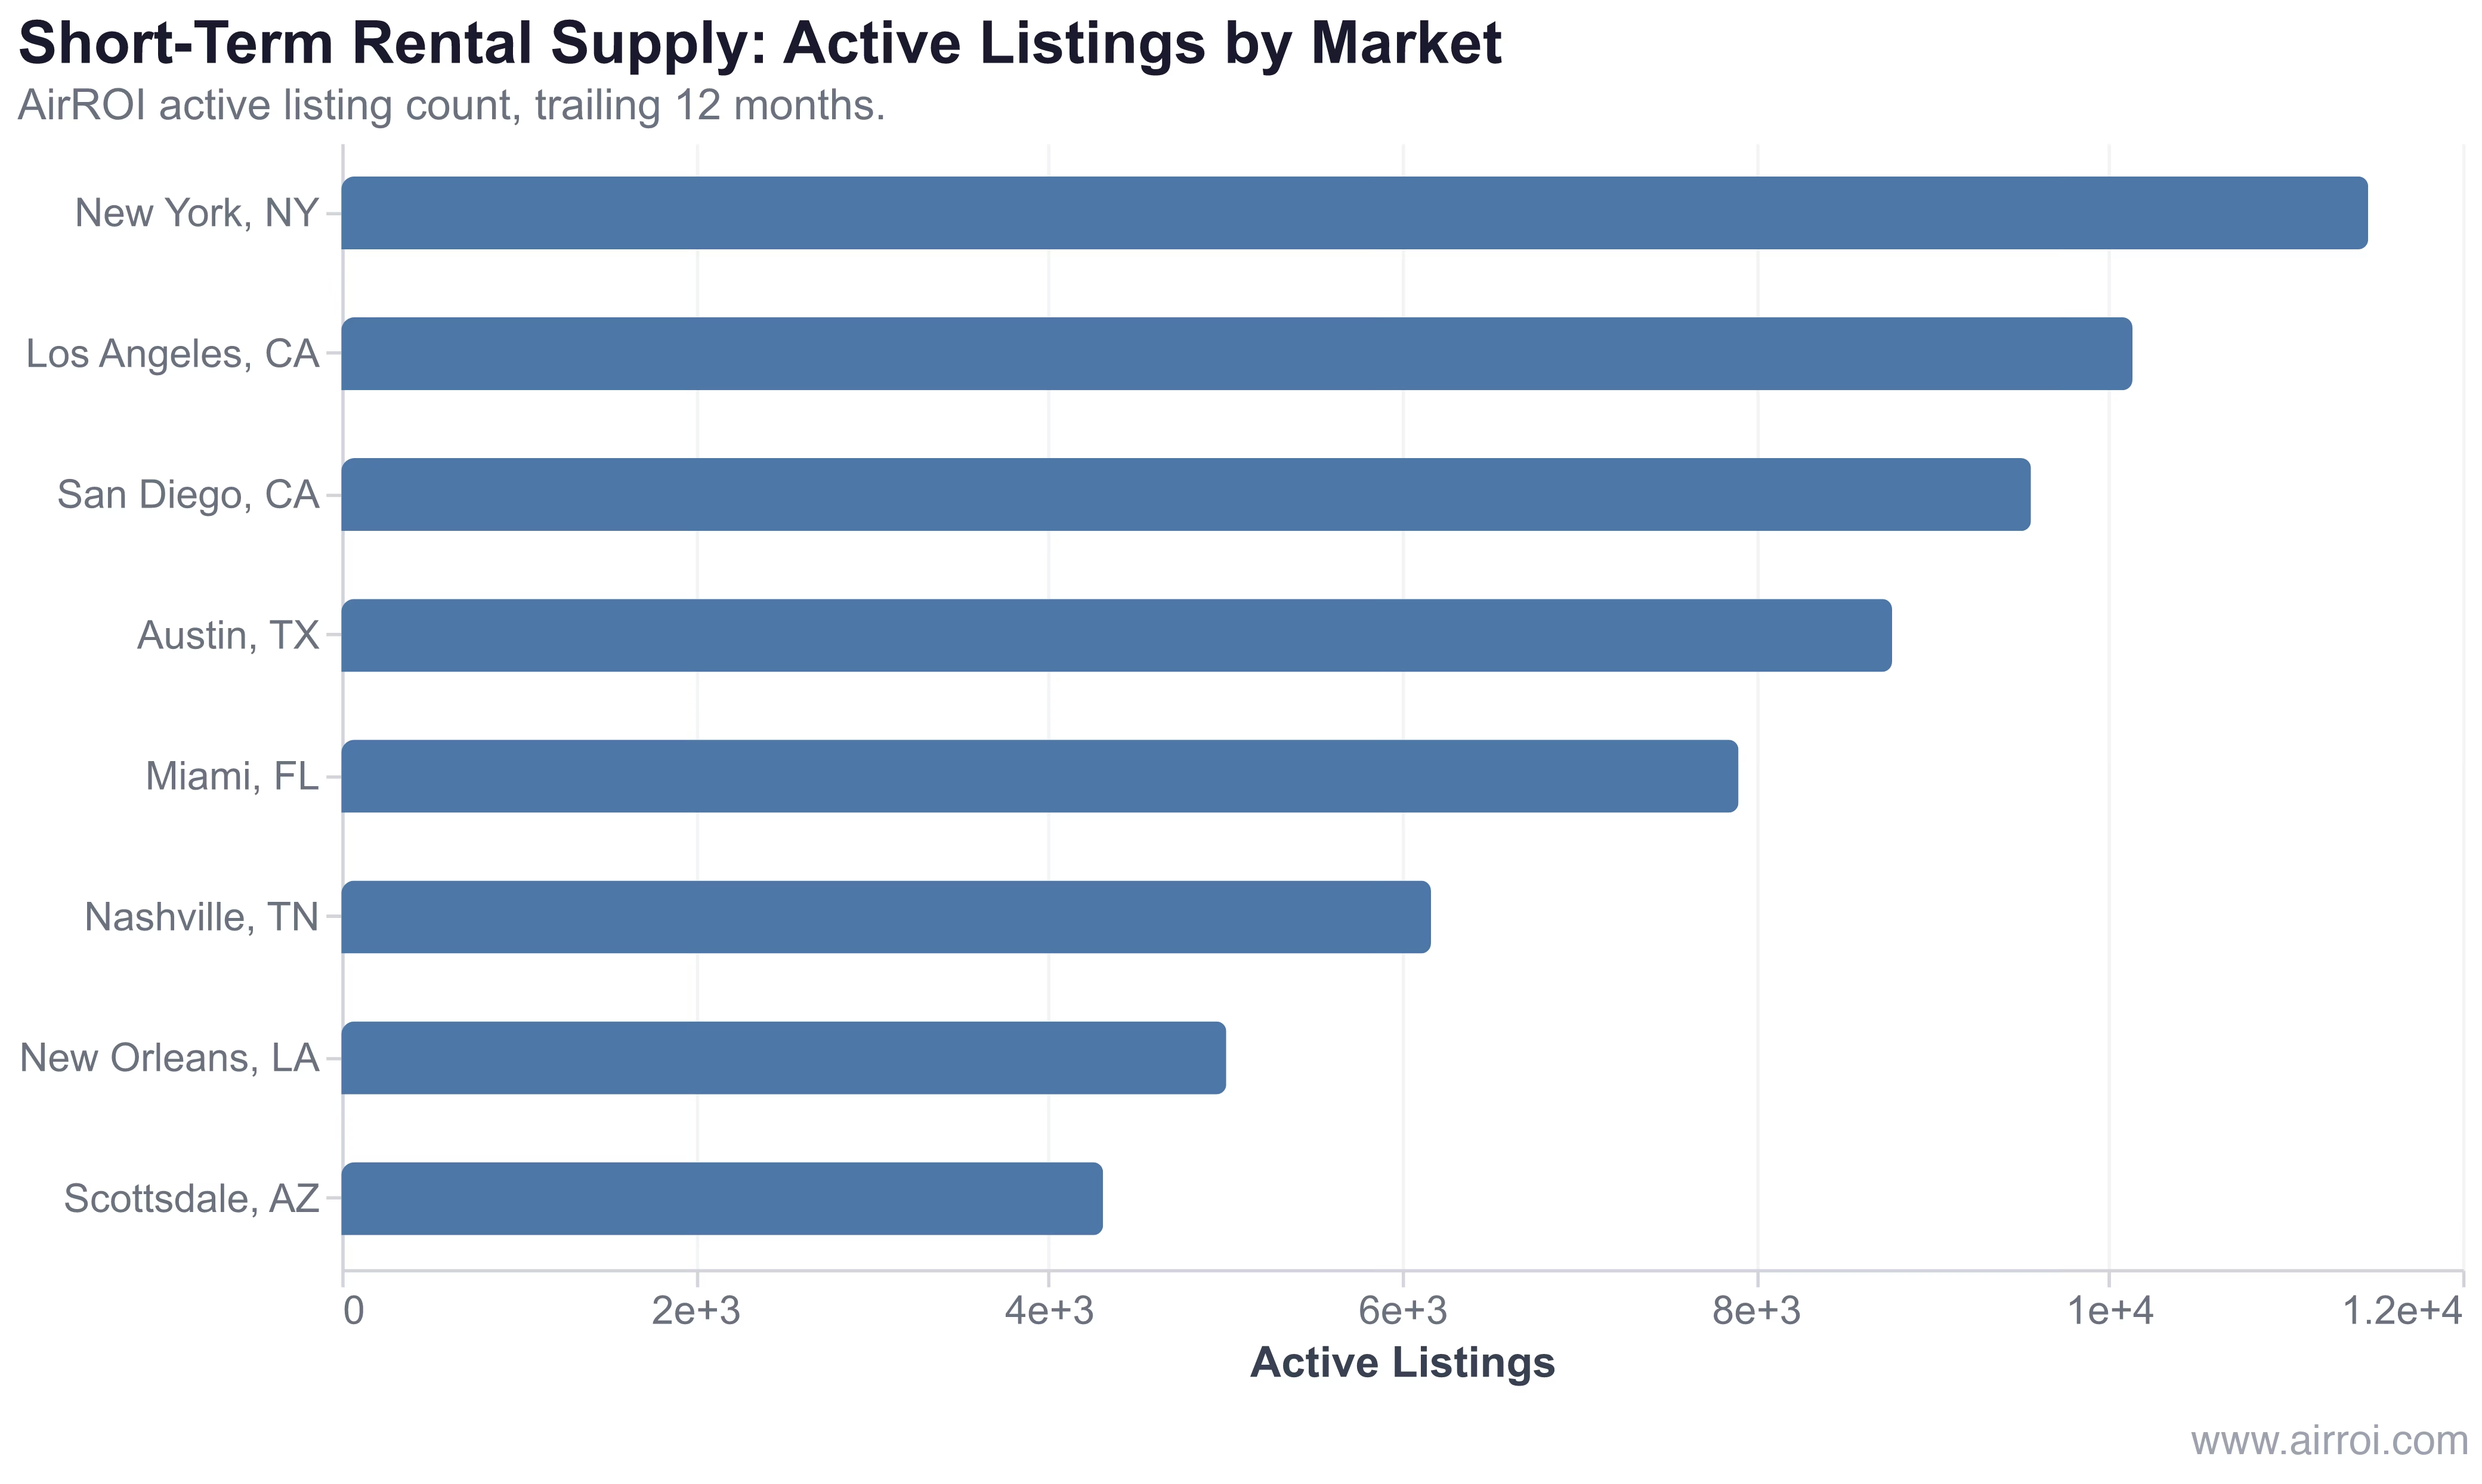
In AirROI's analysis of 63,323 active listings across eight US markets, supply depth ranges from over 11,000 listings in New York to around 4,300 in Scottsdale — a 2.7× spread driven by metro size, tourism volume, and regulatory environment. Critically, high listing count does not translate into high performance: New York and Los Angeles lead on supply yet post some of the lowest occupancy rates in the basket (49% and 48%), while compact resort markets like Scottsdale (49% occupancy, $421 ADR) extract far more revenue per listing despite fewer total units.
High supply is not inherently bearish — what matters is the ratio of supply to demand. A market with 10,000 listings and surging traveler nights can outperform one with 2,000 listings and stagnant bookings. Always read supply alongside occupancy and RevPAR.
Why Supply Matters for Airbnb Hosts
Supply dynamics directly shape your earning potential across four dimensions:
- Pricing power: When supply is limited relative to demand, hosts command higher ADR. Scottsdale's 4,310-listing market averages $421 per night; Los Angeles's 10,134-listing market averages $312, reflecting greater competitive pressure per dollar of demand.
- Competition intensity: Rapid supply growth in your comp set means more alternatives for guests. Differentiation — through amenities, response speed, and review scores — becomes essential when the market is adding inventory faster than it is adding guests.
- Investment viability: Supply growth rate is a critical input when underwriting future occupancy and revenue for a potential acquisition. A market at 8% annual supply growth with flat demand growth will price-erode within two to three years.
- Regulatory risk: Markets experiencing rapid supply growth attract regulatory attention fastest. Second-tier cities have accelerated their STR ordinance cycles, and supply-shock regulations — permit caps, minimum-night requirements, licensing freezes — can compress inventory overnight.
Supply Growth Benchmarks
| Annual Growth Rate | Market Condition | Host Implication |
|---|---|---|
| 0–5% | Stable / mature | Steady competition; focus on optimization and quality differentiation |
| 5–15% | Healthy growth | Increasing competition; track submarket-level absorption rate |
| 15–25% | Rapid expansion | Monitor saturation signals; stress-test revenue projections |
| 25%+ | Potential oversupply | Elevated risk of declining occupancy and ADR; review investment thesis |
The Regulation Effect: New York as a Supply-Shock Case Study
New York City's Local Law 18, enforced from September 2023, required hosts to register in person and prohibited short stays unless the host was physically present — effectively banning most entire-home short-term rentals. AirROI data shows active listings falling from roughly 26,775 in September 2023 to approximately 10,500 by early 2026, a 60% decline. Short-stay listings specifically dropped around 90%. The median minimum-night requirement in the NYC market is now 25.8 nights, reflecting a near-total shift to 30-day stays.
How to Track and Respond to Supply Changes
- Monitor listing counts monthly using a market dashboard to spot supply trends before they compress your revenue
- Segment by property type — a surge in studio apartments does not directly compete with your 4-bedroom lakehouse
- Track absorption rate to determine whether new supply is being absorbed by growing demand or accumulating as excess inventory
- Compare supply growth vs. demand growth — if supply is expanding at 20% annually but demand only at 5%, saturation is approaching and rate pressure will follow
- Watch seasonal supply patterns — hosts who list only during peak season temporarily inflate supply and competition precisely when you most want pricing power; knowing the seasonal supply curve helps you optimize pricing windows
Frequently Asked Questions
STR supply is measured by counting active listings in a market over a defined period. An active listing is one that has received at least one booking or calendar update in the trailing 12 months. Supply can also be expressed as total available nights — the sum of all open calendar nights across every active listing in the market.
Growth rates vary sharply by market. Heavily regulated metros like New York City saw supply collapse after Local Law 18 took effect in September 2023, dropping from roughly 26,775 active listings to around 10,500 by early 2026 — a 60% decline. Meanwhile, lighter-touch markets in the Sun Belt and mountain destinations continue to see meaningful supply growth.
Rising supply without matching demand growth intensifies competition, compressing occupancy rates and nightly rates. In AirROI's data, the highest-supply markets — New York (11,468 listings) and Los Angeles (10,134) — also carry some of the lowest occupancy rates, at 49% and 48% respectively. Monitoring supply trends helps you anticipate pricing pressure before it hits revenue.
The terms are often used interchangeably. "Supply" typically refers to active listing count or available nights at a point in time. "Inventory" can include listed but blocked or paused properties. For practical market analysis, active listing count is the most actionable measure because it reflects real competition.
Regulations are the most powerful supply-shock mechanism in the STR market. New York City's 30-day minimum-night rule effectively eliminated short-stay listings, cutting supply by roughly 60%. Markets under heavy regulatory regimes consistently show lower active listing counts and, where demand holds, higher ADR and RevPAR for remaining compliant hosts.