Hockenheim Airbnb Market Analysis 2026: Short Term Rental Data & Vacation Rental Statistics in Baden-Württemberg, Germany
Is Airbnb profitable in Hockenheim in 2026? Explore comprehensive Airbnb analytics for Hockenheim, Baden-Württemberg, Germany to uncover income potential. This 2026 STR market report for Hockenheim, based on AirROI data from January 2025 to December 2025, reveals key trends in the niche market of 23 active listings.
Whether you're considering an Airbnb investment in Hockenheim, optimizing your existing vacation rental, or exploring rental arbitrage opportunities, understanding the Hockenheim Airbnb data is crucial. Leveraging the low regulation environment is key to maximizing your short term rental income potential. Let's dive into the specifics.
Key Hockenheim Airbnb Performance Metrics Overview
Monthly Airbnb Revenue Variations & Income Potential in Hockenheim (2026)
Understanding the monthly revenue variations for Airbnb listings in Hockenheim is key to maximizing your short term rental income potential. Seasonality significantly impacts earnings. Our analysis, based on data from the past 12 months, shows that the peak revenue month for STRs in Hockenheim is typically December, while October often presents the lowest earnings, highlighting opportunities for strategic pricing adjustments during shoulder and low seasons. Explore the typical Airbnb income in Hockenheim across different performance tiers:
- Best-in-class properties (Top 10%) achieve $2,847+ monthly, often utilizing dynamic pricing and superior guest experiences.
- Strong performing properties (Top 25%) earn $1,743 or more, indicating effective management and desirable locations/amenities.
- Typical properties (Median) generate around $1,035 per month, representing the average market performance.
- Entry-level properties (Bottom 25%) see earnings around $584, often with potential for optimization.
Average Monthly Airbnb Earnings Trend in Hockenheim
Hockenheim Airbnb Occupancy Rate Trends (2026)
Maximize your bookings by understanding the Hockenheim STR occupancy trends. Seasonal demand shifts significantly influence how often properties are booked. Typically, Junesees the highest demand (peak season occupancy), while February experiences the lowest (low season). Effective strategies, like adjusting minimum stays or offering promotions, can boost occupancy during slower periods. Here's how different property tiers perform in Hockenheim:
- Best-in-class properties (Top 10%) achieve 79%+ occupancy, indicating high desirability and potentially optimized availability.
- Strong performing properties (Top 25%) maintain 60% or higher occupancy, suggesting good market fit and guest satisfaction.
- Typical properties (Median) have an occupancy rate around 37%.
- Entry-level properties (Bottom 25%) average 19% occupancy, potentially facing higher vacancy.
Average Monthly Occupancy Rate Trend in Hockenheim
Average Daily Rate (ADR) Airbnb Trends in Hockenheim (2026)
Effective short term rental pricing strategy in Hockenheim involves understanding monthly ADR fluctuations. The Average Daily Rate (ADR) for Airbnb in Hockenheim typically peaks in November and dips lowest during February. Leveraging Airbnb dynamic pricing tools or strategies based on this seasonality can significantly boost revenue. Here's a look at the typical nightly rates achieved:
- Best-in-class properties (Top 10%) command rates of $345+ per night, often due to premium features or locations.
- Strong performing properties (Top 25%) achieve nightly rates of $138 or more.
- Typical properties (Median) charge around $93 per night.
- Entry-level properties (Bottom 25%) earn around $68 per night.
Average Daily Rate (ADR) Trend by Month in Hockenheim
Get Live Hockenheim Market Intelligence 👇

Explore Real-time Analytics
Airbnb Seasonality Analysis & Trends in Hockenheim (2025)
Peak Season (December, August, November)
- Revenue averages $1,757 per month
- Occupancy rates average 42.7%
- Daily rates average $157
Shoulder Season
- Revenue averages $1,431 per month
- Occupancy maintains around 41.3%
- Daily rates hold near $138
Low Season (January, September, October)
- Revenue drops to average $1,187 per month
- Occupancy decreases to average 39.4%
- Daily rates adjust to average $147
Seasonality Insights for Hockenheim
- The Airbnb seasonality in Hockenheim shows moderate seasonality with distinct peak and low periods. While the sections above show seasonal averages, it's also insightful to look at the extremes:
- During the high season, the absolute peak month showcases Hockenheim's highest earning potential, with monthly revenues capable of climbing to $1,946, occupancy reaching a high of 50.0%, and ADRs peaking at $163.
- Conversely, the slowest single month of the year, typically falling within the low season, marks the market's lowest point. In this month, revenue might dip to $1,097, occupancy could drop to 29.3%, and ADRs may adjust down to $132.
- Understanding both the seasonal averages and these monthly peaks and troughs in revenue, occupancy, and ADR is crucial for maximizing your Airbnb profit potential in Hockenheim.
Seasonal Strategies for Maximizing Profit
- Peak Season: Maximize revenue through premium pricing and potentially longer minimum stays. Ensure high availability.
- Low Season: Offer competitive pricing, special promotions (e.g., extended stay discounts), and flexible cancellation policies. Target off-season travelers like remote workers or budget-conscious guests.
- Shoulder Seasons: Implement dynamic pricing that balances peak and low rates. Target weekend travelers or specific events. Offer slightly more flexible terms than peak season.
- Regularly analyze your own performance against these Hockenheim seasonality benchmarks and adjust your pricing and availability strategy accordingly.
Best Areas for Airbnb Investment in Hockenheim (2026)
Exploring the top neighborhoods for short-term rentals in Hockenheim? This section highlights key areas, outlining why they are attractive for hosts and guests, along with notable local attractions. Consider these locations based on your target guest profile and investment strategy.
| Neighborhood / Area | Why Host Here? (Target Guests & Appeal) | Key Attractions & Landmarks |
|---|---|---|
| City Center | Hockenheim's city center offers a vibrant atmosphere with shops, restaurants, and cultural sites. Perfect for tourists looking to explore the local culture and amenities. | Hockenheimring, Museum Hockenheim, Local markets, Restaurants and cafes, Cultural events |
| Hockenheimring | Famous for hosting motorsport events, the Hockenheimring attracts many visitors throughout the year, making it an ideal spot for Airbnb hosting during events. | Hockenheimring racetrack, Motorsport events, Auto museums, Nearby parks |
| Hockenheim Historic Town | This area features historical architecture and charming streets. It attracts visitors interested in history and local experiences, ideal for those looking for a peaceful stay. | Historic buildings, Local cafés, Town square, Walking trails, Parks |
| Reilingen | A neighboring town known for its quiet residential areas, perfect for families and travelers looking for a peaceful stay while being close to Hockenheim. | Local parks, Family-friendly atmosphere, Cafés and restaurants |
| Local Parks | Hockenheim's parks provide a tranquil escape from the urban environment, making them popular with nature lovers and families. Close proximity to nature can attract visitors. | Hockenheimer Wald, Parks for walking and picnics, Birdwatching, Cycling trails |
| Nearby Mannheim | Mannheim is a city close to Hockenheim offering more urban attractions, broadening the appeal of staying in Hockenheim while being close to city life. | Luisenpark Mannheim, Mannheim Palace, Shopping centers, Cultural events |
| Ladenburg | A picturesque historic town near Hockenheim that draws visitors interested in history and charming architecture, making it a great option for Airbnb hosting. | Ladenburg Roman ruins, Old town charm, Riverside walks |
| Heidelberg | While slightly further away, Heidelberg's reputation as a tourist hotspot makes Hockenheim an excellent base for visitors wanting to explore the region. | Heidelberg Castle, Philosopher's Walk, Old Bridge, University of Heidelberg |
Understanding Airbnb License Requirements & STR Laws in Hockenheim (2026)
While Hockenheim, Baden-Württemberg, Germany currently shows low STR regulations, specific Airbnb license requirements might still exist or change. Always verify the latest short term rental regulations and Airbnb license requirements directly with local government authorities for Hockenheim to ensure full compliance before hosting.
(Source: AirROI data, 2026, finding no licensed listings among those analyzed)
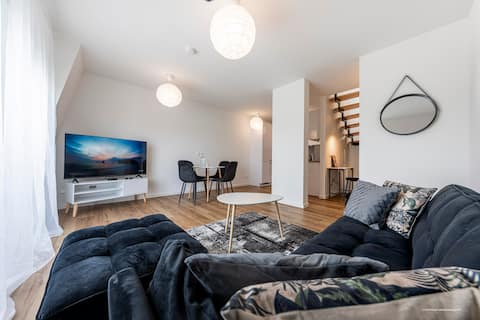
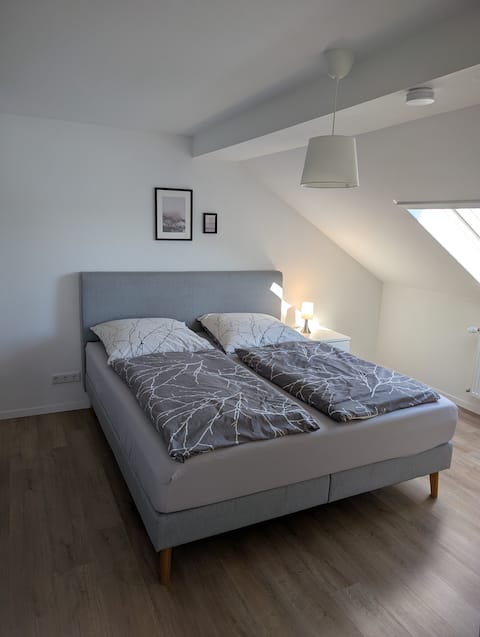
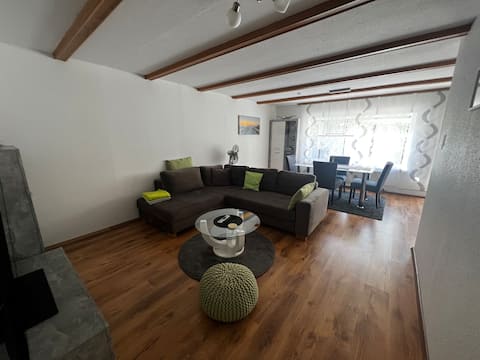
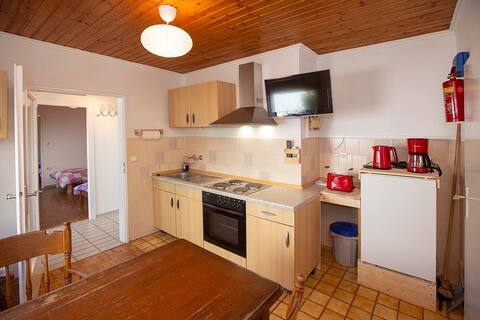
Top Performing Airbnb Properties in Hockenheim (2026)
Benchmark your potential! Explore examples of top-performing Airbnb properties in Hockenheimbased on Trailing Twelve Month (TTM) revenue. Analyze their characteristics, revenue, occupancy rate, and ADR to understand what drives success in this market.

nidusROOMS Suite Hockenheim
Entire Place • 3 bedrooms
Artdesign 8 Pers Nähe Speyer Mannheim Heidelberg
Entire Place • 3 bedrooms
Cosy 3 room apartment near Hockenheimring
Entire Place • 2 bedrooms
Bright basement apartment in Hockenheim
Entire Place • 1 bedroom
Guesthouse in Hockenheim
Entire Place • 2 bedrooms

Bright two-room flat
Entire Place • 1 bedroom
Note: Performance varies based on location, size, amenities, seasonality, and management quality. Data reflects the past 12 months.
Top Performing Airbnb Hosts in Hockenheim (2026)
Learn from the best! This table showcases top-performing Airbnb hosts in Hockenheim based on the number of properties managed and estimated total revenue over the past year. Analyze their scale and performance metrics.
| Host Name | Properties | Grossing Revenue | Stay Reviews | Avg Rating |
|---|---|---|---|---|
| Matthias | 1 | $43,837 | 12 | 4.92/5.0 |
| Blogger Homes GmbH | 1 | $34,212 | 22 | 4.77/5.0 |
| Anika | 1 | $23,058 | 81 | 4.98/5.0 |
| Dominik | 1 | $20,243 | 52 | 5.00/5.0 |
| Erika | 1 | $18,784 | 146 | 4.52/5.0 |
| Dominik | 1 | $16,556 | 176 | 4.94/5.0 |
| Georg | 1 | $14,036 | 29 | 4.93/5.0 |
| Larissa | 1 | $13,926 | 90 | 4.86/5.0 |
| Benjamin | 3 | $13,629 | 4 | Not Rated |
| Jan | 1 | $12,891 | 175 | 4.93/5.0 |
Analyzing the strategies of top hosts, such as their property selection, pricing, and guest communication, can offer valuable lessons for optimizing your own Airbnb operations in Hockenheim.
Dive Deeper: Advanced Hockenheim STR Market Data (2026)
Ready to unlock more insights? AirROI provides access to advanced metrics and comprehensive Airbnb data for Hockenheim. Explore detailed analytics beyond this report to refine your investment strategy, optimize pricing, and maximize your vacation rental profits.
Explore Advanced MetricsHockenheim Short-Term Rental Market Composition (2026): Property & Room Types
Room Type Distribution
Property Type Distribution
Market Composition Insights for Hockenheim
- The Hockenheim Airbnb market composition is heavily skewed towards Entire Home/Apt listings, which make up 78.3% of the 23 active rentals. This indicates strong guest preference for privacy and space.
- Looking at the property type distribution in Hockenheim, Apartment/Condo properties are the most common (87%), reflecting the local real estate landscape.
Hockenheim Airbnb Room Capacity Analysis (2026): Bedroom Distribution
Distribution of Listings by Number of Bedrooms
Room Capacity Insights for Hockenheim
- The dominant room capacity in Hockenheim is 1 bedroom listings, making up 39.1% of the market. This suggests a strong demand for properties suitable for couples or solo travelers.
- Together, 1 bedroom and 2 bedrooms properties represent 65.2% of the active Airbnb listings in Hockenheim, indicating a high concentration in these sizes.
Hockenheim Vacation Rental Guest Capacity Trends (2026)
Distribution of Listings by Guest Capacity
Guest Capacity Insights for Hockenheim
- The most common guest capacity trend in Hockenheim vacation rentals is listings accommodating 2 guests (26.1%). This suggests the primary traveler segment is likely couples or solo travelers.
- Properties designed for 2 guests and 4 guests dominate the Hockenheim STR market, accounting for 47.8% of listings.
- 21.6% of properties accommodate 6+ guests, serving the market segment for larger families or group travel in Hockenheim.
- On average, properties in Hockenheim are equipped to host 3.5 guests.
Hockenheim Airbnb Booking Patterns (2026): Available vs. Booked Days
Available Days Distribution
Booked Days Distribution
Booking Pattern Insights for Hockenheim
- The most common availability pattern in Hockenheim falls within the 271-366 days range, representing 47.8% of listings. This suggests many properties have significant open periods on their calendars.
- Approximately 82.6% of listings show high availability (181+ days open annually), indicating potential for increased bookings or specific owner usage patterns.
- For booked days, the 91-180 days range is most frequent in Hockenheim (34.8%), reflecting common guest stay durations or potential owner blocking patterns.
- A notable 17.3% of properties secure long booking periods (181+ days booked per year), highlighting successful long-term rental strategies or significant owner usage.
Hockenheim Airbnb Minimum Stay Requirements Analysis
Distribution of Listings by Minimum Night Requirement
1 Night
4 listings
17.4% of total
2 Nights
7 listings
30.4% of total
3 Nights
2 listings
8.7% of total
4-6 Nights
2 listings
8.7% of total
30+ Nights
8 listings
34.8% of total
Key Insights
- The most prevalent minimum stay requirement in Hockenheim is 30+ Nights, adopted by 34.8% of listings. This highlights the market's preference for longer commitments.
- A significant segment (34.8%) caters to monthly stays (30+ nights) in Hockenheim, pointing to opportunities in the extended-stay market.
Recommendations
- Align with the market by considering a 30+ Nights minimum stay, as 34.8% of Hockenheim hosts use this setting.
- If feasible, allowing 1-night stays, especially midweek or during low season, could capture last-minute bookings, as only 17.4% currently do.
- A 2-night minimum appears standard (30.4%). Consider this for weekends or peak periods.
- Explore offering discounts for stays of 30+ nights to attract the 34.8% of the market seeking extended stays.
- Adjust minimum nights based on seasonality – potentially shorter during low season and longer during peak demand periods in Hockenheim.
Hockenheim Airbnb Cancellation Policy Trends Analysis (2026)
Super Strict 60 Days
1 listings
4.3% of total
Flexible
8 listings
34.8% of total
Moderate
9 listings
39.1% of total
Firm
3 listings
13% of total
Strict
2 listings
8.7% of total
Cancellation Policy Insights for Hockenheim
- The prevailing Airbnb cancellation policy trend in Hockenheim is Moderate, used by 39.1% of listings.
- The market strongly favors guest-friendly terms, with 73.9% of listings offering Flexible or Moderate policies. This suggests guests in Hockenheim may expect booking flexibility.
- Strict cancellation policies are quite rare (8.7%), potentially making listings with this policy less competitive unless justified by high demand or property type.
Recommendations for Hosts
- Consider adopting a Moderate policy to align with the 39.1% market standard in Hockenheim.
- Using a Strict policy might deter some guests, as only 8.7% of listings use it. Evaluate if potential revenue protection outweighs possible lower booking rates.
- Regularly review your cancellation policy against competitors and market demand shifts in Hockenheim.
Hockenheim STR Booking Lead Time Analysis (2026)
Average Booking Lead Time by Month
Booking Lead Time Insights for Hockenheim
- The overall average booking lead time for vacation rentals in Hockenheim is 78 days.
- Guests book furthest in advance for stays during September (average 138 days), likely coinciding with peak travel demand or local events.
- The shortest booking windows occur for stays in January (average 23 days), indicating more last-minute travel plans during this time.
- Seasonally, Fall (100 days avg.) sees the longest lead times, while Winter (45 days avg.) has the shortest, reflecting typical travel planning cycles.
Recommendations for Hosts
- Use the overall average lead time (78 days) as a baseline for your pricing and availability strategy in Hockenheim.
- For September stays, consider implementing length-of-stay discounts or slightly higher rates for bookings made less than 138 days out to capitalize on advance planning.
- Target marketing efforts for the Fall season well in advance (at least 100 days) to capture early planners.
- Monitor your own booking lead times against these Hockenheim averages to identify opportunities for dynamic pricing adjustments.
Popular & Essential Airbnb Amenities in Hockenheim (2026)
Amenity Prevalence
Amenity Insights for Hockenheim
- Essential amenities in Hockenheim that guests expect include: Wifi, Dishes and silverware, Heating, Refrigerator, Bed linens, Smoke alarm, TV. Lacking these (any) could significantly impact bookings.
- Popular amenities like Coffee maker, Kitchen, Stove are common but not universal. Offering these can provide a competitive edge.
Recommendations for Hosts
- Ensure your listing includes all essential amenities for Hockenheim: Wifi, Dishes and silverware, Heating, Refrigerator, Bed linens, Smoke alarm, TV.
- Prioritize adding missing essentials: Refrigerator, Bed linens, Smoke alarm, TV.
- Consider adding popular differentiators like Coffee maker or Kitchen to increase appeal.
- Highlight unique or less common amenities you offer (e.g., hot tub, dedicated workspace, EV charger) in your listing description and photos.
- Regularly check competitor amenities in Hockenheim to stay competitive.
Hockenheim Airbnb Guest Demographics & Profile Analysis (2026)
Guest Profile Summary for Hockenheim
- The typical guest profile for Airbnb in Hockenheim consists of primarily domestic travelers (65%), often arriving from nearby Mainz, typically belonging to the Post-2000s (Gen Z/Alpha) group (50%), primarily speaking English or German.
- Domestic travelers account for 65.3% of guests.
- Key international markets include Germany (65.3%) and United States (5.3%).
- Top languages spoken are English (38.2%) followed by German (34.6%).
- A significant demographic segment is the Post-2000s (Gen Z/Alpha) group, representing 50% of guests.
Recommendations for Hosts
- Target domestic marketing efforts towards travelers from Mainz and Munich.
- Tailor amenities and listing descriptions to appeal to the dominant Post-2000s (Gen Z/Alpha) demographic (e.g., highlight fast WiFi, smart home features, local guides).
- Highlight unique local experiences or amenities relevant to the primary guest profile.
- Consider seasonal promotions aligned with peak travel times for key origin markets.
Nearby Short-Term Rental Market Comparison
How does the Hockenheim Airbnb market stack up against its neighbors? Compare key performance metrics like average monthly revenue, ADR, and occupancy rates in surrounding areas to understand the broader regional STR landscape.
| Market | Active Properties | Monthly Revenue | Daily Rate | Avg. Occupancy |
|---|---|---|---|---|
| Ittenheim | 20 | $6,360 | $398.74 | 42% |
| Furdenheim | 15 | $5,877 | $449.73 | 46% |
| Le Valtin | 12 | $4,263 | $386.06 | 46% |
| Kruft | 13 | $3,302 | $261.52 | 36% |
| Kusterdingen | 10 | $3,132 | $223.64 | 45% |
| Griesheim-près-Molsheim | 18 | $3,098 | $276.36 | 39% |
| Le Saulcy | 10 | $2,986 | $256.81 | 48% |
| Rust | 178 | $2,841 | $199.16 | 54% |
| Dettwiller | 13 | $2,807 | $222.23 | 39% |
| Hurtigheim | 11 | $2,775 | $236.46 | 40% |