Bad Waldsee Airbnb Market Analysis 2026: Short Term Rental Data & Vacation Rental Statistics in Baden-Württemberg, Germany
Is Airbnb profitable in Bad Waldsee in 2026? Explore comprehensive Airbnb analytics for Bad Waldsee, Baden-Württemberg, Germany to uncover income potential. This 2026 STR market report for Bad Waldsee, based on AirROI data from February 2025 to January 2026, reveals key trends in the niche market of 31 active listings.
Whether you're considering an Airbnb investment in Bad Waldsee, optimizing your existing vacation rental, or exploring rental arbitrage opportunities, understanding the Bad Waldsee Airbnb data is crucial. Leveraging the low regulation environment is key to maximizing your short term rental income potential. Let's dive into the specifics.
Key Bad Waldsee Airbnb Performance Metrics Overview
Monthly Airbnb Revenue Variations & Income Potential in Bad Waldsee (2026)
Understanding the monthly revenue variations for Airbnb listings in Bad Waldsee is key to maximizing your short term rental income potential. Seasonality significantly impacts earnings. Our analysis, based on data from the past 12 months, shows that the peak revenue month for STRs in Bad Waldsee is typically July, while November often presents the lowest earnings, highlighting opportunities for strategic pricing adjustments during shoulder and low seasons. Explore the typical Airbnb income in Bad Waldsee across different performance tiers:
- Best-in-class properties (Top 10%) achieve $1,875+ monthly, often utilizing dynamic pricing and superior guest experiences.
- Strong performing properties (Top 25%) earn $1,233 or more, indicating effective management and desirable locations/amenities.
- Typical properties (Median) generate around $733 per month, representing the average market performance.
- Entry-level properties (Bottom 25%) see earnings around $408, often with potential for optimization.
Average Monthly Airbnb Earnings Trend in Bad Waldsee
Bad Waldsee Airbnb Occupancy Rate Trends (2026)
Maximize your bookings by understanding the Bad Waldsee STR occupancy trends. Seasonal demand shifts significantly influence how often properties are booked. Typically, Augustsees the highest demand (peak season occupancy), while January experiences the lowest (low season). Effective strategies, like adjusting minimum stays or offering promotions, can boost occupancy during slower periods. Here's how different property tiers perform in Bad Waldsee:
- Best-in-class properties (Top 10%) achieve 65%+ occupancy, indicating high desirability and potentially optimized availability.
- Strong performing properties (Top 25%) maintain 45% or higher occupancy, suggesting good market fit and guest satisfaction.
- Typical properties (Median) have an occupancy rate around 25%.
- Entry-level properties (Bottom 25%) average 14% occupancy, potentially facing higher vacancy.
Average Monthly Occupancy Rate Trend in Bad Waldsee
Average Daily Rate (ADR) Airbnb Trends in Bad Waldsee (2026)
Effective short term rental pricing strategy in Bad Waldsee involves understanding monthly ADR fluctuations. The Average Daily Rate (ADR) for Airbnb in Bad Waldsee typically peaks in October and dips lowest during March. Leveraging Airbnb dynamic pricing tools or strategies based on this seasonality can significantly boost revenue. Here's a look at the typical nightly rates achieved:
- Best-in-class properties (Top 10%) command rates of $187+ per night, often due to premium features or locations.
- Strong performing properties (Top 25%) achieve nightly rates of $108 or more.
- Typical properties (Median) charge around $88 per night.
- Entry-level properties (Bottom 25%) earn around $69 per night.
Average Daily Rate (ADR) Trend by Month in Bad Waldsee
Get Live Bad Waldsee Market Intelligence 👇

Explore Real-time Analytics
Airbnb Seasonality Analysis & Trends in Bad Waldsee (2026)
Peak Season (July, August, December)
- Revenue averages $1,332 per month
- Occupancy rates average 36.5%
- Daily rates average $121
Shoulder Season
- Revenue averages $975 per month
- Occupancy maintains around 34.2%
- Daily rates hold near $107
Low Season (January, October, November)
- Revenue drops to average $642 per month
- Occupancy decreases to average 20.6%
- Daily rates adjust to average $139
Seasonality Insights for Bad Waldsee
- The Airbnb seasonality in Bad Waldsee shows highly seasonal trends requiring careful strategy. While the sections above show seasonal averages, it's also insightful to look at the extremes:
- During the high season, the absolute peak month showcases Bad Waldsee's highest earning potential, with monthly revenues capable of climbing to $1,500, occupancy reaching a high of 43.3%, and ADRs peaking at $141.
- Conversely, the slowest single month of the year, typically falling within the low season, marks the market's lowest point. In this month, revenue might dip to $544, occupancy could drop to 17.4%, and ADRs may adjust down to $101.
- Understanding both the seasonal averages and these monthly peaks and troughs in revenue, occupancy, and ADR is crucial for maximizing your Airbnb profit potential in Bad Waldsee.
Seasonal Strategies for Maximizing Profit
- Peak Season: Maximize revenue through premium pricing and potentially longer minimum stays. Ensure high availability.
- Low Season: Offer competitive pricing, special promotions (e.g., extended stay discounts), and flexible cancellation policies. Target off-season travelers like remote workers or budget-conscious guests.
- Shoulder Seasons: Implement dynamic pricing that balances peak and low rates. Target weekend travelers or specific events. Offer slightly more flexible terms than peak season.
- Regularly analyze your own performance against these Bad Waldsee seasonality benchmarks and adjust your pricing and availability strategy accordingly.
Best Areas for Airbnb Investment in Bad Waldsee (2026)
Exploring the top neighborhoods for short-term rentals in Bad Waldsee? This section highlights key areas, outlining why they are attractive for hosts and guests, along with notable local attractions. Consider these locations based on your target guest profile and investment strategy.
| Neighborhood / Area | Why Host Here? (Target Guests & Appeal) | Key Attractions & Landmarks |
|---|---|---|
| Old Town | The picturesque Old Town of Bad Waldsee offers charming streets, historical buildings, and a unique ambiance. It's desirable for tourists who appreciate culture and history, making it a prime location for Airbnb hosting. | St. Peter's Church, Historical Museum, Town Hall, Bad Waldsee Historical Market Square, Thermal Baths |
| Thermal Baths Area | Bad Waldsee is famous for its thermal baths, attracting wellness tourists seeking relaxation and health benefits. Listing properties close to the baths can cater to this niche market. | Bad Waldsee Thermal Baths, Spa Hotel, Wellness Resorts, Natural Swimming Pool |
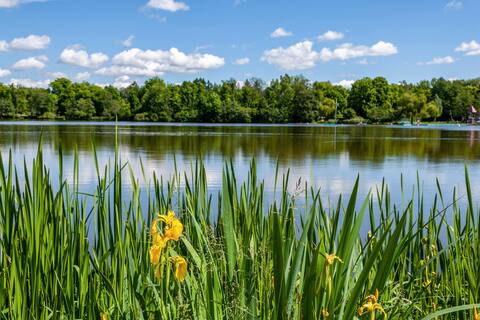
| Lake Bad Waldsee | The scenic beauty of Lake Bad Waldsee draws visitors for outdoor activities and relaxation. Properties near the lake can benefit from the natural draw of water sports and scenic views. | Lake Bad Waldsee, Boat Rentals, Walking Trails, Fishing Spots, Picnic Areas |
| Nature Park Area | Proximity to the surrounding nature parks offers hiking and outdoor adventures, appealing to nature lovers and families. Investing here is great for Airbnb targeting eco-tourists. | Nature Park Obere Donau, Hiking Trails, Cycling Routes, Wildlife Viewing |
| Cultural Events Venue | Hosting in areas close to venues for local cultural events can attract visitors during festivals and fairs. This area is perfect for those looking to experience local traditions. | Bad Waldsee Cultural Center, Annual Festivals, Local Craft Fairs |
| Shopping District | The central shopping district is appealing to those who enjoy urban amenities and convenience. Properties in this area can attract business travelers and shoppers. | Local Shops, Cafés, Restaurants, Markets |
| Family-Friendly Area | Catering to families looking for comfortable lodgings near parks and schools can be a profitable strategy. Properties suited for families can attract longer-term stays. | Family Parks, Playgrounds, Cultural Institutions |
| Sports and Recreation Zone | This area focuses on recreational activities like cycling and water sports, appealing to active tourists and sports enthusiasts. | Cycling Trails, Water Sports Facilities, Recreational Parks |
Understanding Airbnb License Requirements & STR Laws in Bad Waldsee (2026)
While Bad Waldsee, Baden-Württemberg, Germany currently shows low STR regulations, specific Airbnb license requirements might still exist or change. Always verify the latest short term rental regulations and Airbnb license requirements directly with local government authorities for Bad Waldsee to ensure full compliance before hosting.
(Source: AirROI data, 2026, finding no licensed listings among those analyzed)
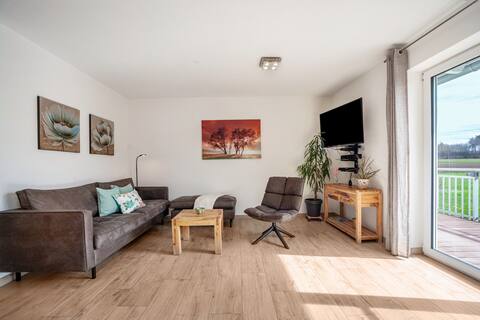
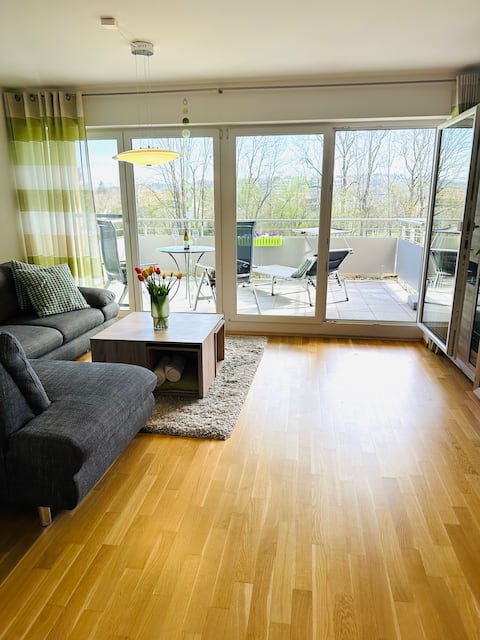
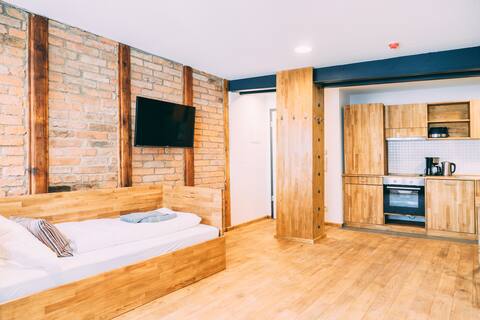
Top Performing Airbnb Properties in Bad Waldsee (2026)
Benchmark your potential! Explore examples of top-performing Airbnb properties in Bad Waldseebased on Trailing Twelve Month (TTM) revenue. Analyze their characteristics, revenue, occupancy rate, and ADR to understand what drives success in this market.
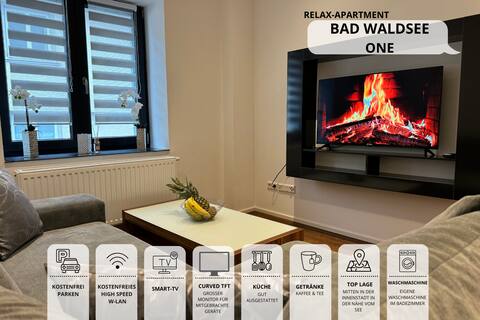
Relax Apartments Bad Waldsee One
Entire Place • 1 bedroom
Fewo at Stadtsee - Bad Waldsee
Entire Place • 1 bedroom

Large family studio with old town flair
Entire Place • N/A
Vacation home 1
Entire Place • 2 bedrooms
Kathrins holiday flat in best location
Entire Place • 1 bedroom
Amtshaus Boutique Apartments "Suite Deluxe OG"
Entire Place • 1 bedroom
Note: Performance varies based on location, size, amenities, seasonality, and management quality. Data reflects the past 12 months.
Top Performing Airbnb Hosts in Bad Waldsee (2026)
Learn from the best! This table showcases top-performing Airbnb hosts in Bad Waldsee based on the number of properties managed and estimated total revenue over the past year. Analyze their scale and performance metrics.
| Host Name | Properties | Grossing Revenue | Stay Reviews | Avg Rating |
|---|---|---|---|---|
| Wolfgang | 10 | $81,149 | 709 | 4.77/5.0 |
| Holidu | 2 | $34,961 | 3 | Not Rated |
| Eduard | 1 | $26,748 | 16 | 4.63/5.0 |
| Flavio | 2 | $21,368 | 35 | 4.92/5.0 |
| Stephan | 1 | $15,443 | 170 | 4.79/5.0 |
| Kathrin | 1 | $14,272 | 17 | 4.94/5.0 |
| Catherine | 1 | $10,716 | 16 | 4.75/5.0 |
| Bernhard | 1 | $9,943 | 52 | 4.96/5.0 |
| Dilaras FeWo | 1 | $9,733 | 28 | 4.54/5.0 |
| Matthias | 1 | $9,675 | 49 | 4.94/5.0 |
Analyzing the strategies of top hosts, such as their property selection, pricing, and guest communication, can offer valuable lessons for optimizing your own Airbnb operations in Bad Waldsee.
Dive Deeper: Advanced Bad Waldsee STR Market Data (2026)
Ready to unlock more insights? AirROI provides access to advanced metrics and comprehensive Airbnb data for Bad Waldsee. Explore detailed analytics beyond this report to refine your investment strategy, optimize pricing, and maximize your vacation rental profits.
Explore Advanced MetricsBad Waldsee Short-Term Rental Market Composition (2026): Property & Room Types
Room Type Distribution
Property Type Distribution
Market Composition Insights for Bad Waldsee
- The Bad Waldsee Airbnb market composition is heavily skewed towards Entire Home/Apt listings, which make up 93.5% of the 31 active rentals. This indicates strong guest preference for privacy and space.
- Looking at the property type distribution in Bad Waldsee, Apartment/Condo properties are the most common (87.1%), reflecting the local real estate landscape.
Bad Waldsee Airbnb Room Capacity Analysis (2026): Bedroom Distribution
Distribution of Listings by Number of Bedrooms
Room Capacity Insights for Bad Waldsee
- The dominant room capacity in Bad Waldsee is 1 bedroom listings, making up 64.5% of the market. This suggests a strong demand for properties suitable for couples or solo travelers.
- Together, 1 bedroom and 2 bedrooms properties represent 74.2% of the active Airbnb listings in Bad Waldsee, indicating a high concentration in these sizes.
- With over half the market (64.5%) consisting of studios or 1-bedroom units, Bad Waldsee is particularly well-suited for individuals or couples.
- Listings with 3+ bedrooms (3.2%) represent a smaller niche, potentially indicating an underserved market for larger group accommodations in Bad Waldsee.
Bad Waldsee Vacation Rental Guest Capacity Trends (2026)
Distribution of Listings by Guest Capacity
Guest Capacity Insights for Bad Waldsee
- The most common guest capacity trend in Bad Waldsee vacation rentals is listings accommodating 4 guests (32.3%). This suggests the primary traveler segment is likely small families or groups.
- Properties designed for 4 guests and 2 guests dominate the Bad Waldsee STR market, accounting for 61.3% of listings.
- On average, properties in Bad Waldsee are equipped to host 3.3 guests.
Bad Waldsee Airbnb Booking Patterns (2026): Available vs. Booked Days
Available Days Distribution
Booked Days Distribution
Booking Pattern Insights for Bad Waldsee
- The most common availability pattern in Bad Waldsee falls within the 271-366 days range, representing 58.1% of listings. This suggests many properties have significant open periods on their calendars.
- Approximately 96.8% of listings show high availability (181+ days open annually), indicating potential for increased bookings or specific owner usage patterns.
- For booked days, the 31-90 days range is most frequent in Bad Waldsee (41.9%), reflecting common guest stay durations or potential owner blocking patterns.
- A notable 6.5% of properties secure long booking periods (181+ days booked per year), highlighting successful long-term rental strategies or significant owner usage.
Bad Waldsee Airbnb Minimum Stay Requirements Analysis
Distribution of Listings by Minimum Night Requirement
1 Night
16 listings
51.6% of total
2 Nights
4 listings
12.9% of total
4-6 Nights
3 listings
9.7% of total
7-29 Nights
2 listings
6.5% of total
30+ Nights
6 listings
19.4% of total
Key Insights
- The most prevalent minimum stay requirement in Bad Waldsee is 1 Night, adopted by 51.6% of listings. This highlights the market's preference for shorter, flexible bookings.
- A strong majority (64.5%) of the Bad Waldsee Airbnb data shows acceptance of very short stays (1-2 nights), indicating a dynamic, high-turnover market.
- A significant segment (19.4%) caters to monthly stays (30+ nights) in Bad Waldsee, pointing to opportunities in the extended-stay market.
Recommendations
- Align with the market by considering a 1 Night minimum stay, as 51.6% of Bad Waldsee hosts use this setting.
- Explore offering discounts for stays of 30+ nights to attract the 19.4% of the market seeking extended stays.
- Adjust minimum nights based on seasonality – potentially shorter during low season and longer during peak demand periods in Bad Waldsee.
Bad Waldsee Airbnb Cancellation Policy Trends Analysis (2026)
Super Strict 60 Days
1 listings
3.2% of total
Flexible
10 listings
32.3% of total
Moderate
8 listings
25.8% of total
Firm
12 listings
38.7% of total
Cancellation Policy Insights for Bad Waldsee
- The prevailing Airbnb cancellation policy trend in Bad Waldsee is Firm, used by 38.7% of listings.
- There's a relatively balanced mix between guest-friendly (58.1%) and stricter (38.7%) policies, offering choices for different guest needs.
Recommendations for Hosts
- Consider adopting a Firm policy to align with the 38.7% market standard in Bad Waldsee.
- Regularly review your cancellation policy against competitors and market demand shifts in Bad Waldsee.
Bad Waldsee STR Booking Lead Time Analysis (2026)
Average Booking Lead Time by Month
Booking Lead Time Insights for Bad Waldsee
- The overall average booking lead time for vacation rentals in Bad Waldsee is 35 days.
- Guests book furthest in advance for stays during August (average 53 days), likely coinciding with peak travel demand or local events.
- The shortest booking windows occur for stays in January (average 16 days), indicating more last-minute travel plans during this time.
- Seasonally, Summer (42 days avg.) sees the longest lead times, while Winter (24 days avg.) has the shortest, reflecting typical travel planning cycles.
Recommendations for Hosts
- Use the overall average lead time (35 days) as a baseline for your pricing and availability strategy in Bad Waldsee.
- For August stays, consider implementing length-of-stay discounts or slightly higher rates for bookings made less than 53 days out to capitalize on advance planning.
- Target marketing efforts for the Summer season well in advance (at least 42 days) to capture early planners.
- Monitor your own booking lead times against these Bad Waldsee averages to identify opportunities for dynamic pricing adjustments.
Popular & Essential Airbnb Amenities in Bad Waldsee (2026)
Amenity Prevalence
Amenity Insights for Bad Waldsee
- Essential amenities in Bad Waldsee that guests expect include: Wifi, Heating, Dishes and silverware, Smoke alarm. Lacking these (any) could significantly impact bookings.
- Popular amenities like Kitchen, Hair dryer, Hot water are common but not universal. Offering these can provide a competitive edge.
Recommendations for Hosts
- Ensure your listing includes all essential amenities for Bad Waldsee: Wifi, Heating, Dishes and silverware, Smoke alarm.
- Prioritize adding missing essentials: Heating, Dishes and silverware, Smoke alarm.
- Consider adding popular differentiators like Kitchen or Hair dryer to increase appeal.
- Highlight unique or less common amenities you offer (e.g., hot tub, dedicated workspace, EV charger) in your listing description and photos.
- Regularly check competitor amenities in Bad Waldsee to stay competitive.
Bad Waldsee Airbnb Guest Demographics & Profile Analysis (2026)
Guest Profile Summary for Bad Waldsee
- The typical guest profile for Airbnb in Bad Waldsee consists of a mix of domestic (65%) and international guests, often arriving from nearby Munich, typically belonging to the Post-2000s (Gen Z/Alpha) group (50%), primarily speaking English or German.
- Domestic travelers account for 64.7% of guests.
- Key international markets include Germany (64.7%) and Netherlands (9.8%).
- Top languages spoken are English (34.4%) followed by German (32%).
- A significant demographic segment is the Post-2000s (Gen Z/Alpha) group, representing 50% of guests.
Recommendations for Hosts
- Target domestic marketing efforts towards travelers from Munich and Saarbrücken.
- Tailor amenities and listing descriptions to appeal to the dominant Post-2000s (Gen Z/Alpha) demographic (e.g., highlight fast WiFi, smart home features, local guides).
- Highlight unique local experiences or amenities relevant to the primary guest profile.
- Consider seasonal promotions aligned with peak travel times for key origin markets.
Nearby Short-Term Rental Market Comparison
How does the Bad Waldsee Airbnb market stack up against its neighbors? Compare key performance metrics like average monthly revenue, ADR, and occupancy rates in surrounding areas to understand the broader regional STR landscape.
| Market | Active Properties | Monthly Revenue | Daily Rate | Avg. Occupancy |
|---|---|---|---|---|
| Brienzwiler | 11 | $7,335 | $514.27 | 60% |
| Grindelwald | 513 | $5,587 | $396.62 | 56% |
| Bassersdorf | 16 | $5,337 | $431.59 | 46% |
| Balderschwang | 10 | $5,253 | $304.03 | 58% |
| Vitznau | 31 | $4,688 | $425.43 | 45% |
| Lucerne | 329 | $4,288 | $310.00 | 53% |
| Ingenbohl | 14 | $4,251 | $219.49 | 63% |
| Brienz (BE) | 157 | $4,232 | $331.88 | 50% |
| Flüelen | 11 | $3,911 | $313.02 | 57% |
| Schwanden bei Brienz | 21 | $3,891 | $254.22 | 63% |