Schliengen Airbnb Market Analysis 2025: Short Term Rental Data & Vacation Rental Statistics in Baden-Württemberg, Germany
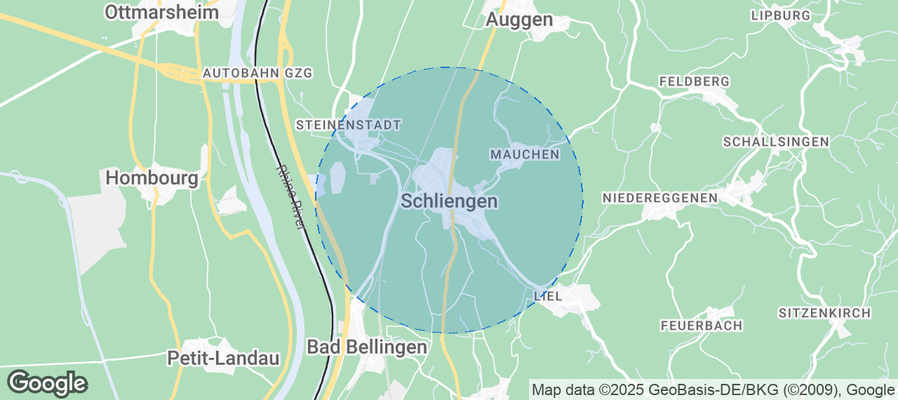
Is Airbnb profitable in Schliengen in 2025? Explore comprehensive Airbnb analytics for Schliengen, Baden-Württemberg, Germany to uncover income potential. This 2025 STR market report for Schliengen, based on AirROI data from November 2024 to October 2025, reveals key trends in the niche market of 17 active listings.
Whether you're considering an Airbnb investment in Schliengen, optimizing your existing vacation rental, or exploring rental arbitrage opportunities, understanding the Schliengen Airbnb data is crucial. Leveraging the low regulation environment is key to maximizing your short term rental income potential. Let's dive into the specifics.
Key Schliengen Airbnb Performance Metrics Overview
Monthly Airbnb Revenue Variations & Income Potential in Schliengen (2025)
Understanding the monthly revenue variations for Airbnb listings in Schliengen is key to maximizing your short term rental income potential. Seasonality significantly impacts earnings. Our analysis, based on data from the past 12 months, shows that the peak revenue month for STRs in Schliengen is typically August, while November often presents the lowest earnings, highlighting opportunities for strategic pricing adjustments during shoulder and low seasons. Explore the typical Airbnb income in Schliengen across different performance tiers:
- Best-in-class properties (Top 10%) achieve $2,708+ monthly, often utilizing dynamic pricing and superior guest experiences.
- Strong performing properties (Top 25%) earn $1,901 or more, indicating effective management and desirable locations/amenities.
- Typical properties (Median) generate around $1,298 per month, representing the average market performance.
- Entry-level properties (Bottom 25%) see earnings around $757, often with potential for optimization.
Average Monthly Airbnb Earnings Trend in Schliengen
Schliengen Airbnb Occupancy Rate Trends (2025)
Maximize your bookings by understanding the Schliengen STR occupancy trends. Seasonal demand shifts significantly influence how often properties are booked. Typically, Augustsees the highest demand (peak season occupancy), while November experiences the lowest (low season). Effective strategies, like adjusting minimum stays or offering promotions, can boost occupancy during slower periods. Here's how different property tiers perform in Schliengen:
- Best-in-class properties (Top 10%) achieve 82%+ occupancy, indicating high desirability and potentially optimized availability.
- Strong performing properties (Top 25%) maintain 57% or higher occupancy, suggesting good market fit and guest satisfaction.
- Typical properties (Median) have an occupancy rate around 37%.
- Entry-level properties (Bottom 25%) average 21% occupancy, potentially facing higher vacancy.
Average Monthly Occupancy Rate Trend in Schliengen
Average Daily Rate (ADR) Airbnb Trends in Schliengen (2025)
Effective short term rental pricing strategy in Schliengen involves understanding monthly ADR fluctuations. The Average Daily Rate (ADR) for Airbnb in Schliengen typically peaks in September and dips lowest during April. Leveraging Airbnb dynamic pricing tools or strategies based on this seasonality can significantly boost revenue. Here's a look at the typical nightly rates achieved:
- Best-in-class properties (Top 10%) command rates of $194+ per night, often due to premium features or locations.
- Strong performing properties (Top 25%) achieve nightly rates of $145 or more.
- Typical properties (Median) charge around $112 per night.
- Entry-level properties (Bottom 25%) earn around $78 per night.
Average Daily Rate (ADR) Trend by Month in Schliengen
Get Live Schliengen Market Intelligence 👇
Explore Real-time Analytics
Airbnb Seasonality Analysis & Trends in Schliengen (2025)
Peak Season (August, September, May)
- Revenue averages $2,027 per month
- Occupancy rates average 57.5%
- Daily rates average $123
Shoulder Season
- Revenue averages $1,488 per month
- Occupancy maintains around 42.7%
- Daily rates hold near $119
Low Season (January, February, November)
- Revenue drops to average $834 per month
- Occupancy decreases to average 27.6%
- Daily rates adjust to average $116
Seasonality Insights for Schliengen
- The Airbnb seasonality in Schliengen shows highly seasonal trends requiring careful strategy. While the sections above show seasonal averages, it's also insightful to look at the extremes:
- During the high season, the absolute peak month showcases Schliengen's highest earning potential, with monthly revenues capable of climbing to $2,346, occupancy reaching a high of 67.3%, and ADRs peaking at $128.
- Conversely, the slowest single month of the year, typically falling within the low season, marks the market's lowest point. In this month, revenue might dip to $688, occupancy could drop to 23.3%, and ADRs may adjust down to $114.
- Understanding both the seasonal averages and these monthly peaks and troughs in revenue, occupancy, and ADR is crucial for maximizing your Airbnb profit potential in Schliengen.
Seasonal Strategies for Maximizing Profit
- Peak Season: Maximize revenue through premium pricing and potentially longer minimum stays. Ensure high availability.
- Low Season: Offer competitive pricing, special promotions (e.g., extended stay discounts), and flexible cancellation policies. Target off-season travelers like remote workers or budget-conscious guests.
- Shoulder Seasons: Implement dynamic pricing that balances peak and low rates. Target weekend travelers or specific events. Offer slightly more flexible terms than peak season.
- Regularly analyze your own performance against these Schliengen seasonality benchmarks and adjust your pricing and availability strategy accordingly.
Best Areas for Airbnb Investment in Schliengen (2025)
Exploring the top neighborhoods for short-term rentals in Schliengen? This section highlights key areas, outlining why they are attractive for hosts and guests, along with notable local attractions. Consider these locations based on your target guest profile and investment strategy.
| Neighborhood / Area | Why Host Here? (Target Guests & Appeal) | Key Attractions & Landmarks |
|---|---|---|
| Schliengen City Center | The heart of Schliengen, close to shops, restaurants, and public transportation. Ideal for guests wanting convenience and access to local amenities. | Market Square, Schliengen Castle, Local cafes and eateries |
| Rhein Riverfront | Beautiful scenery along the Rhine River, popular for walking and cycling. Ideal for leisure travelers looking for a peaceful retreat with picturesque views. | Rhine River promenade, Cycling paths, Picnic spots |
| Local Vineyards | Surrounded by vineyards, Schliengen offers a unique wine tourism experience. Perfect for wine enthusiasts seeking accommodations near wine tasting tours. | Wine tasting tours, Beautiful vineyard views, Wine festivals |
| Nearby Nature Reserves | Proximity to nature reserves such as the Biosphere Reserve Entlebuch, perfect for nature lovers and outdoor activities. | Hiking trails, Nature observation, Scenic views |
| Agricultural Areas | Experience rural Germany with local farms and agricultural sites. A great choice for families looking for a quiet countryside getaway. | Farmers markets, Local produce, Countryside walks |
| Cultural Sites | Schliengen is rich in history and culture, ideal for guests interested in exploring local traditions and heritage. | Historical buildings, Local museums, Cultural festivals |
| Wellness Centers | Wellness resorts and spas in the area attract guests looking for relaxing stays focused on health and wellness. | Spa facilities, Health retreats, Yoga and meditation classes |
| Festivals and Events Venues | Host to various local festivals, the area thrives during event seasons, making it popular with visitors seeking a vibrant atmosphere. | Annual wine festival, Local craft fairs, Cultural celebrations |
Understanding Airbnb License Requirements & STR Laws in Schliengen (2025)
While Schliengen, Baden-Württemberg, Germany currently shows low STR regulations, specific Airbnb license requirements might still exist or change. Always verify the latest short term rental regulations and Airbnb license requirements directly with local government authorities for Schliengen to ensure full compliance before hosting.
(Source: AirROI data, 2025, finding no licensed listings among those analyzed)
Top Performing Airbnb Properties in Schliengen (2025)
Benchmark your potential! Explore examples of top-performing Airbnb properties in Schliengenbased on Trailing Twelve Month (TTM) revenue. Analyze their characteristics, revenue, occupancy rate, and ADR to understand what drives success in this market.
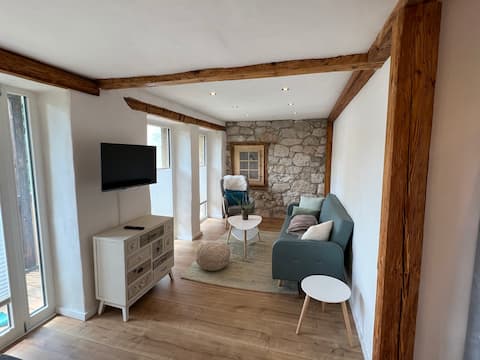
Modern dream apartment with private terrace.
Entire Place • 1 bedroom

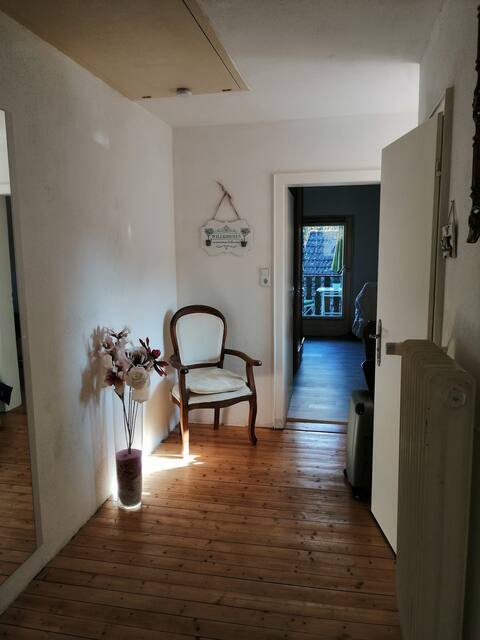
Fully furnished 3-room Vacation rental. Pets welcome
Entire Place • 2 bedrooms
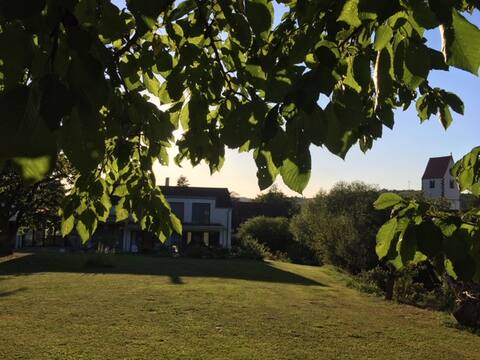
Peaceful oasis in the cherry blossom valley
Entire Place • 1 bedroom
Endes Three-Sides- Courtyard / Apartment
Entire Place • 2 bedrooms
Rosengarten Vacation Rental
Entire Place • 1 bedroom
Beautiful apartment in Markgräflerland
Entire Place • 2 bedrooms
Note: Performance varies based on location, size, amenities, seasonality, and management quality. Data reflects the past 12 months.
Top Performing Airbnb Hosts in Schliengen (2025)
Learn from the best! This table showcases top-performing Airbnb hosts in Schliengen based on the number of properties managed and estimated total revenue over the past year. Analyze their scale and performance metrics.
| Host Name | Properties | Grossing Revenue | Stay Reviews | Avg Rating |
|---|---|---|---|---|
| Katja Und Bernd | 1 | $32,262 | 43 | 5.00/5.0 |
| Corina | 8 | $18,767 | 23 | 4.96/5.0 |
| Sheryl-Anne | 1 | $17,983 | 12 | 4.83/5.0 |
| Jan | 1 | $17,054 | 55 | 4.95/5.0 |
| Brigida | 1 | $14,690 | 14 | 4.29/5.0 |
| Annette | 1 | $14,273 | 46 | 4.96/5.0 |
| Claus | 1 | $11,813 | 63 | 5.00/5.0 |
| Tosca Schmidt | 1 | $10,066 | 23 | 4.57/5.0 |
| Sonja | 1 | $4,895 | 18 | 5.00/5.0 |
| Murielle | 1 | $1,701 | 3 | 5.00/5.0 |
Analyzing the strategies of top hosts, such as their property selection, pricing, and guest communication, can offer valuable lessons for optimizing your own Airbnb operations in Schliengen.
Dive Deeper: Advanced Schliengen STR Market Data (2025)
Ready to unlock more insights? AirROI provides access to advanced metrics and comprehensive Airbnb data for Schliengen. Explore detailed analytics beyond this report to refine your investment strategy, optimize pricing, and maximize your vacation rental profits.
Explore Advanced MetricsSchliengen Short-Term Rental Market Composition (2025): Property & Room Types
Room Type Distribution
Property Type Distribution
Market Composition Insights for Schliengen
- The Schliengen Airbnb market composition is heavily skewed towards Entire Home/Apt listings, which make up 94.1% of the 17 active rentals. This indicates strong guest preference for privacy and space.
- Looking at the property type distribution in Schliengen, Apartment/Condo properties are the most common (70.6%), reflecting the local real estate landscape.
- Houses represent a significant 17.6% portion, catering likely to families or larger groups.
Schliengen Airbnb Room Capacity Analysis (2025): Bedroom Distribution
Distribution of Listings by Number of Bedrooms
Room Capacity Insights for Schliengen
- The dominant room capacity in Schliengen is 1 bedroom listings, making up 47.1% of the market. This suggests a strong demand for properties suitable for couples or solo travelers.
- Together, 1 bedroom and 2 bedrooms properties represent 88.3% of the active Airbnb listings in Schliengen, indicating a high concentration in these sizes.
- Listings with 3+ bedrooms (5.9%) represent a smaller niche, potentially indicating an underserved market for larger group accommodations in Schliengen.
Schliengen Vacation Rental Guest Capacity Trends (2025)
Distribution of Listings by Guest Capacity
Guest Capacity Insights for Schliengen
- The most common guest capacity trend in Schliengen vacation rentals is listings accommodating 2 guests (29.4%). This suggests the primary traveler segment is likely couples or solo travelers.
- Properties designed for 2 guests and 4 guests dominate the Schliengen STR market, accounting for 58.8% of listings.
- 29.4% of properties accommodate 6+ guests, serving the market segment for larger families or group travel in Schliengen.
- On average, properties in Schliengen are equipped to host 4.1 guests.
Schliengen Airbnb Booking Patterns (2025): Available vs. Booked Days
Available Days Distribution
Booked Days Distribution
Booking Pattern Insights for Schliengen
- The most common availability pattern in Schliengen falls within the 271-366 days range, representing 64.7% of listings. This suggests many properties have significant open periods on their calendars.
- Approximately 88.2% of listings show high availability (181+ days open annually), indicating potential for increased bookings or specific owner usage patterns.
- For booked days, the 1-30 days range is most frequent in Schliengen (52.9%), reflecting common guest stay durations or potential owner blocking patterns.
- A notable 11.8% of properties secure long booking periods (181+ days booked per year), highlighting successful long-term rental strategies or significant owner usage.
Schliengen Airbnb Minimum Stay Requirements Analysis
Distribution of Listings by Minimum Night Requirement
1 Night
3 listings
17.6% of total
2 Nights
3 listings
17.6% of total
4-6 Nights
5 listings
29.4% of total
7-29 Nights
5 listings
29.4% of total
30+ Nights
1 listings
5.9% of total
Key Insights
- The most prevalent minimum stay requirement in Schliengen is 4-6 Nights, adopted by 29.4% of listings. This highlights the market's preference for longer commitments.
Recommendations
- Align with the market by considering a 4-6 Nights minimum stay, as 29.4% of Schliengen hosts use this setting.
- If feasible, allowing 1-night stays, especially midweek or during low season, could capture last-minute bookings, as only 17.6% currently do.
- Explore offering discounts for stays of 30+ nights to attract the 5.9% of the market seeking extended stays.
- Adjust minimum nights based on seasonality – potentially shorter during low season and longer during peak demand periods in Schliengen.
Schliengen Airbnb Cancellation Policy Trends Analysis (2025)
Flexible
6 listings
35.3% of total
Moderate
3 listings
17.6% of total
Strict
8 listings
47.1% of total
Cancellation Policy Insights for Schliengen
- The prevailing Airbnb cancellation policy trend in Schliengen is Strict, used by 47.1% of listings.
- There's a relatively balanced mix between guest-friendly (52.9%) and stricter (47.1%) policies, offering choices for different guest needs.
Recommendations for Hosts
- Consider adopting a Strict policy to align with the 47.1% market standard in Schliengen.
- With 47.1% using Strict terms, this is a viable option in Schliengen, particularly for high-value properties or during peak demand periods.
- Regularly review your cancellation policy against competitors and market demand shifts in Schliengen.
Schliengen STR Booking Lead Time Analysis (2025)
Average Booking Lead Time by Month
Booking Lead Time Insights for Schliengen
- The overall average booking lead time for vacation rentals in Schliengen is 39 days.
- Guests book furthest in advance for stays during May (average 92 days), likely coinciding with peak travel demand or local events.
- The shortest booking windows occur for stays in February (average 17 days), indicating more last-minute travel plans during this time.
- Seasonally, Spring (75 days avg.) sees the longest lead times, while Winter (31 days avg.) has the shortest, reflecting typical travel planning cycles.
Recommendations for Hosts
- Use the overall average lead time (39 days) as a baseline for your pricing and availability strategy in Schliengen.
- For May stays, consider implementing length-of-stay discounts or slightly higher rates for bookings made less than 92 days out to capitalize on advance planning.
- Target marketing efforts for the Spring season well in advance (at least 75 days) to capture early planners.
- Monitor your own booking lead times against these Schliengen averages to identify opportunities for dynamic pricing adjustments.
Popular & Essential Airbnb Amenities in Schliengen (2025)
Amenity Prevalence
Amenity Insights for Schliengen
- Essential amenities in Schliengen that guests expect include: Kitchen, Wifi. Lacking these (any) could significantly impact bookings.
- Popular amenities like Smoke alarm, Hangers, TV are common but not universal. Offering these can provide a competitive edge.
Recommendations for Hosts
- Ensure your listing includes all essential amenities for Schliengen: Kitchen, Wifi.
- Consider adding popular differentiators like Smoke alarm or Hangers to increase appeal.
- Highlight unique or less common amenities you offer (e.g., hot tub, dedicated workspace, EV charger) in your listing description and photos.
- Regularly check competitor amenities in Schliengen to stay competitive.
Schliengen Airbnb Guest Demographics & Profile Analysis (2025)
Guest Profile Summary for Schliengen
- The typical guest profile for Airbnb in Schliengen consists of a mix of domestic (51%) and international guests, often arriving from nearby Berlin, typically belonging to the Post-2000s (Gen Z/Alpha) group (50%), primarily speaking English or German.
- Domestic travelers account for 51.2% of guests.
- Key international markets include Germany (51.2%) and Netherlands (18.6%).
- Top languages spoken are English (34.3%) followed by German (28.4%).
- A significant demographic segment is the Post-2000s (Gen Z/Alpha) group, representing 50% of guests.
Recommendations for Hosts
- Balance marketing efforts between domestic and international channels based on the guest mix.
- Tailor amenities and listing descriptions to appeal to the dominant Post-2000s (Gen Z/Alpha) demographic (e.g., highlight fast WiFi, smart home features, local guides).
- Highlight unique local experiences or amenities relevant to the primary guest profile.
- Consider seasonal promotions aligned with peak travel times for key origin markets.
Nearby Short-Term Rental Market Comparison
How does the Schliengen Airbnb market stack up against its neighbors? Compare key performance metrics like average monthly revenue, ADR, and occupancy rates in surrounding areas to understand the broader regional STR landscape.
| Market | Active Properties | Monthly Revenue | Daily Rate | Avg. Occupancy |
|---|---|---|---|---|
| Rothenburg | 11 | $6,193 | $312.43 | 64% |
| Lauterbrunnen | 550 | $6,144 | $517.12 | 51% |
| La Rivière-Enverse | 17 | $5,999 | $698.31 | 38% |
| Furdenheim | 15 | $5,806 | $428.67 | 45% |
| Grindelwald | 510 | $5,650 | $398.65 | 56% |
| Matten bei Interlaken | 63 | $5,549 | $346.10 | 59% |
| Ittenheim | 19 | $5,472 | $327.49 | 43% |
| Bassersdorf | 17 | $5,437 | $412.12 | 47% |
| Zermatt | 779 | $5,381 | $502.42 | 48% |
| Interlaken | 308 | $5,118 | $406.81 | 54% |