Erding Airbnb Market Analysis 2026: Short Term Rental Data & Vacation Rental Statistics in Bavaria, Germany
Is Airbnb profitable in Erding in 2026? Explore comprehensive Airbnb analytics for Erding, Bavaria, Germany to uncover income potential. This 2026 STR market report for Erding, based on AirROI data from February 2025 to January 2026, reveals key trends in the niche market of 37 active listings.
Whether you're considering an Airbnb investment in Erding, optimizing your existing vacation rental, or exploring rental arbitrage opportunities, understanding the Erding Airbnb data is crucial. Leveraging the low regulation environment is key to maximizing your short term rental income potential. Let's dive into the specifics.
Key Erding Airbnb Performance Metrics Overview
Monthly Airbnb Revenue Variations & Income Potential in Erding (2026)
Understanding the monthly revenue variations for Airbnb listings in Erding is key to maximizing your short term rental income potential. Seasonality significantly impacts earnings. Our analysis, based on data from the past 12 months, shows that the peak revenue month for STRs in Erding is typically September, while January often presents the lowest earnings, highlighting opportunities for strategic pricing adjustments during shoulder and low seasons. Explore the typical Airbnb income in Erding across different performance tiers:
- Best-in-class properties (Top 10%) achieve $4,192+ monthly, often utilizing dynamic pricing and superior guest experiences.
- Strong performing properties (Top 25%) earn $2,952 or more, indicating effective management and desirable locations/amenities.
- Typical properties (Median) generate around $1,548 per month, representing the average market performance.
- Entry-level properties (Bottom 25%) see earnings around $953, often with potential for optimization.
Average Monthly Airbnb Earnings Trend in Erding
Erding Airbnb Occupancy Rate Trends (2026)
Maximize your bookings by understanding the Erding STR occupancy trends. Seasonal demand shifts significantly influence how often properties are booked. Typically, Septembersees the highest demand (peak season occupancy), while January experiences the lowest (low season). Effective strategies, like adjusting minimum stays or offering promotions, can boost occupancy during slower periods. Here's how different property tiers perform in Erding:
- Best-in-class properties (Top 10%) achieve 85%+ occupancy, indicating high desirability and potentially optimized availability.
- Strong performing properties (Top 25%) maintain 74% or higher occupancy, suggesting good market fit and guest satisfaction.
- Typical properties (Median) have an occupancy rate around 55%.
- Entry-level properties (Bottom 25%) average 36% occupancy, potentially facing higher vacancy.
Average Monthly Occupancy Rate Trend in Erding
Average Daily Rate (ADR) Airbnb Trends in Erding (2026)
Effective short term rental pricing strategy in Erding involves understanding monthly ADR fluctuations. The Average Daily Rate (ADR) for Airbnb in Erding typically peaks in September and dips lowest during February. Leveraging Airbnb dynamic pricing tools or strategies based on this seasonality can significantly boost revenue. Here's a look at the typical nightly rates achieved:
- Best-in-class properties (Top 10%) command rates of $210+ per night, often due to premium features or locations.
- Strong performing properties (Top 25%) achieve nightly rates of $154 or more.
- Typical properties (Median) charge around $96 per night.
- Entry-level properties (Bottom 25%) earn around $69 per night.
Average Daily Rate (ADR) Trend by Month in Erding
Get Live Erding Market Intelligence 👇

Explore Real-time Analytics
Airbnb Seasonality Analysis & Trends in Erding (2026)
Peak Season (September, October, August)
- Revenue averages $3,019 per month
- Occupancy rates average 69.2%
- Daily rates average $130
Shoulder Season
- Revenue averages $2,089 per month
- Occupancy maintains around 53.4%
- Daily rates hold near $120
Low Season (January, February, November)
- Revenue drops to average $1,560 per month
- Occupancy decreases to average 42.5%
- Daily rates adjust to average $117
Seasonality Insights for Erding
- The Airbnb seasonality in Erding shows highly seasonal trends requiring careful strategy. While the sections above show seasonal averages, it's also insightful to look at the extremes:
- During the high season, the absolute peak month showcases Erding's highest earning potential, with monthly revenues capable of climbing to $3,166, occupancy reaching a high of 71.4%, and ADRs peaking at $134.
- Conversely, the slowest single month of the year, typically falling within the low season, marks the market's lowest point. In this month, revenue might dip to $1,363, occupancy could drop to 34.4%, and ADRs may adjust down to $109.
- Understanding both the seasonal averages and these monthly peaks and troughs in revenue, occupancy, and ADR is crucial for maximizing your Airbnb profit potential in Erding.
Seasonal Strategies for Maximizing Profit
- Peak Season: Maximize revenue through premium pricing and potentially longer minimum stays. Ensure high availability.
- Low Season: Offer competitive pricing, special promotions (e.g., extended stay discounts), and flexible cancellation policies. Target off-season travelers like remote workers or budget-conscious guests.
- Shoulder Seasons: Implement dynamic pricing that balances peak and low rates. Target weekend travelers or specific events. Offer slightly more flexible terms than peak season.
- Regularly analyze your own performance against these Erding seasonality benchmarks and adjust your pricing and availability strategy accordingly.
Best Areas for Airbnb Investment in Erding (2026)
Exploring the top neighborhoods for short-term rentals in Erding? This section highlights key areas, outlining why they are attractive for hosts and guests, along with notable local attractions. Consider these locations based on your target guest profile and investment strategy.
| Neighborhood / Area | Why Host Here? (Target Guests & Appeal) | Key Attractions & Landmarks |
|---|---|---|
| Erding City Center | The heart of Erding, known for its charming old town and proximity to key attractions. Ideal for travelers who want to experience local culture, shops, and restaurants. | Erding Town Hall, St. John's Church, Erding Museum, Market Square, Spargel- und Erdbeerfest |
| Therme Erding | Home to one of the largest thermal spas in Europe, this area attracts wellness tourists and families looking for relaxation and leisure activities. | Therme Erding, Galaxy Rutschen, Sauna Paradise, Spa treatments, Swimming complexes |
| Sample Area Beck | A peaceful residential area with easy access to parkland and local amenities. Suitable for long-term stays and family-friendly experiences. | Erding Park, Local markets, Family-friendly cafes, Playgrounds, Walking trails |
| Erding Industrial Park | Attracts business travelers and contractors due to its proximity to various companies and factories, offering a different market than typical vacation rentals. | Local factories, Business centers, Logistics companies |
| Waldecker Straße | A quaint, quiet neighborhood perfect for families and those looking for a peaceful stay while still being near the city center. | Family-friendly parks, Cafes, Local shops, Community events |
| St. Georg | A vibrant neighborhood with a mix of traditional and modern feel, attracting diverse travelers looking for an authentic experience. | St. Georg Church, Local dining options, Artisan shops, Cultural festivals |
| Altenerding | A suburban area with good connectivity to Erding city center and Munich, appealing to visitors looking for quieter accommodations with easy transport access. | Local parks, Suburban tranquility, Public transport links |
| Nearby Green Spaces | Regions surrounding Erding that offer nature and outdoor activities, popular among eco-conscious travelers and nature lovers. | Erdinger Moos, Nature parks, Hiking trails, Cycling paths |
Understanding Airbnb License Requirements & STR Laws in Erding (2026)
While Erding, Bavaria, Germany currently shows low STR regulations, specific Airbnb license requirements might still exist or change. Always verify the latest short term rental regulations and Airbnb license requirements directly with local government authorities for Erding to ensure full compliance before hosting.
(Source: AirROI data, 2026, finding no licensed listings among those analyzed)
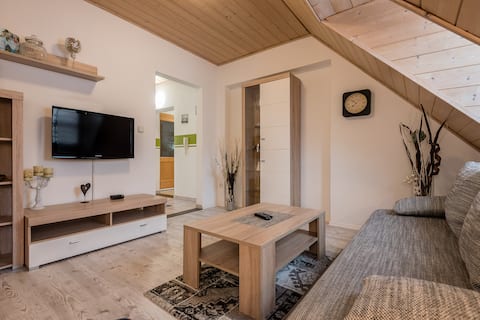
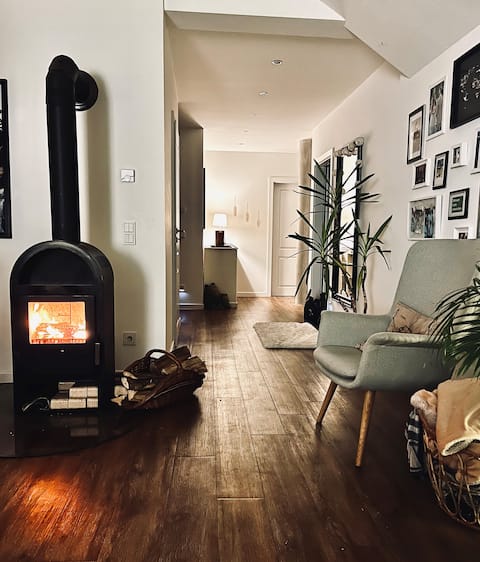
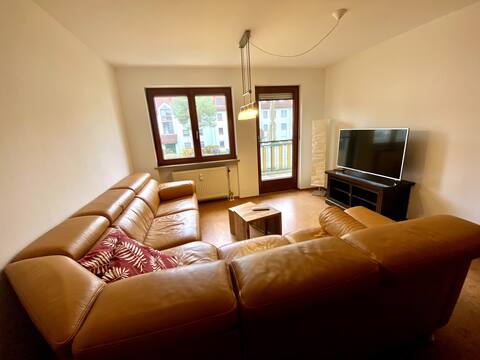
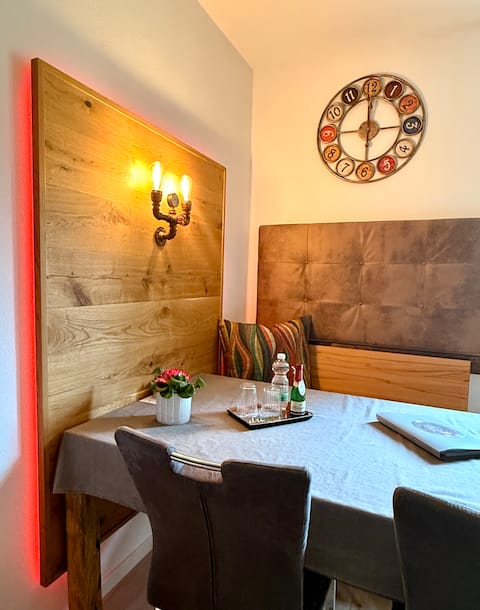
Top Performing Airbnb Properties in Erding (2026)
Benchmark your potential! Explore examples of top-performing Airbnb properties in Erdingbased on Trailing Twelve Month (TTM) revenue. Analyze their characteristics, revenue, occupancy rate, and ADR to understand what drives success in this market.

Luxury 4 Bedroom Apartment/Therme Erding/Parking
Entire Place • 4 bedrooms
Vacation home Held
Entire Place • 3 bedrooms
Feel-good oasis with pool, fireplace & large terrace
Entire Place • 3 bedrooms
4 rooms - 90 sqm - airport, spa, trade fair
Entire Place • 3 bedrooms

Modern quiet apartment
Entire Place • N/A
Central Vacation Rental Right in Erding
Entire Place • 2 bedrooms
Note: Performance varies based on location, size, amenities, seasonality, and management quality. Data reflects the past 12 months.
Top Performing Airbnb Hosts in Erding (2026)
Learn from the best! This table showcases top-performing Airbnb hosts in Erding based on the number of properties managed and estimated total revenue over the past year. Analyze their scale and performance metrics.
| Host Name | Properties | Grossing Revenue | Stay Reviews | Avg Rating |
|---|---|---|---|---|
| Flexstay | 1 | $112,281 | 46 | 4.76/5.0 |
| Victory Gästehaus | 4 | $72,777 | 24 | 4.97/5.0 |
| Siegfried | 1 | $47,231 | 375 | 4.85/5.0 |
| Chris Und Laura | 1 | $44,698 | 25 | 4.92/5.0 |
| Nicole | 1 | $44,074 | 80 | 4.75/5.0 |
| Anna | 3 | $41,733 | 1044 | 4.65/5.0 |
| Claudia | 1 | $39,226 | 154 | 4.99/5.0 |
| Karl | 1 | $39,055 | 155 | 4.97/5.0 |
| Sabine | 1 | $35,444 | 256 | 4.88/5.0 |
| Stefan | 1 | $34,075 | 23 | 4.83/5.0 |
Analyzing the strategies of top hosts, such as their property selection, pricing, and guest communication, can offer valuable lessons for optimizing your own Airbnb operations in Erding.
Dive Deeper: Advanced Erding STR Market Data (2026)
Ready to unlock more insights? AirROI provides access to advanced metrics and comprehensive Airbnb data for Erding. Explore detailed analytics beyond this report to refine your investment strategy, optimize pricing, and maximize your vacation rental profits.
Explore Advanced MetricsErding Short-Term Rental Market Composition (2026): Property & Room Types
Room Type Distribution
Property Type Distribution
Market Composition Insights for Erding
- The Erding Airbnb market composition is heavily skewed towards Entire Home/Apt listings, which make up 64.9% of the 37 active rentals. This indicates strong guest preference for privacy and space.
- However, a notable 35.1% share for Private Rooms suggests opportunities for budget-conscious travelers or hosts renting out spare rooms.
- Looking at the property type distribution in Erding, Apartment/Condo properties are the most common (59.5%), reflecting the local real estate landscape.
- The presence of 10.8% Hotel/Boutique listings indicates integration with traditional hospitality.
Erding Airbnb Room Capacity Analysis (2026): Bedroom Distribution
Distribution of Listings by Number of Bedrooms
Room Capacity Insights for Erding
- The dominant room capacity in Erding is 1 bedroom listings, making up 48.6% of the market. This suggests a strong demand for properties suitable for couples or solo travelers.
- Together, 1 bedroom and 3 bedrooms properties represent 59.4% of the active Airbnb listings in Erding, indicating a high concentration in these sizes.
Erding Vacation Rental Guest Capacity Trends (2026)
Distribution of Listings by Guest Capacity
Guest Capacity Insights for Erding
- The most common guest capacity trend in Erding vacation rentals is listings accommodating 4 guests (21.6%). This suggests the primary traveler segment is likely small families or groups.
- Properties designed for 4 guests and 2 guests dominate the Erding STR market, accounting for 37.8% of listings.
- 10.8% of properties accommodate 6+ guests, serving the market segment for larger families or group travel in Erding.
- On average, properties in Erding are equipped to host 2.7 guests.
Erding Airbnb Booking Patterns (2026): Available vs. Booked Days
Available Days Distribution
Booked Days Distribution
Booking Pattern Insights for Erding
- The most common availability pattern in Erding falls within the 181-270 days range, representing 35.1% of listings. This suggests many properties have significant open periods on their calendars.
- Approximately 56.7% of listings show high availability (181+ days open annually), indicating potential for increased bookings or specific owner usage patterns.
- For booked days, the 91-180 days range is most frequent in Erding (37.8%), reflecting common guest stay durations or potential owner blocking patterns.
- A notable 45.9% of properties secure long booking periods (181+ days booked per year), highlighting successful long-term rental strategies or significant owner usage.
Erding Airbnb Minimum Stay Requirements Analysis
Distribution of Listings by Minimum Night Requirement
1 Night
15 listings
40.5% of total
2 Nights
11 listings
29.7% of total
3 Nights
1 listings
2.7% of total
4-6 Nights
1 listings
2.7% of total
7-29 Nights
2 listings
5.4% of total
30+ Nights
7 listings
18.9% of total
Key Insights
- The most prevalent minimum stay requirement in Erding is 1 Night, adopted by 40.5% of listings. This highlights the market's preference for shorter, flexible bookings.
- A strong majority (70.2%) of the Erding Airbnb data shows acceptance of very short stays (1-2 nights), indicating a dynamic, high-turnover market.
- A significant segment (18.9%) caters to monthly stays (30+ nights) in Erding, pointing to opportunities in the extended-stay market.
Recommendations
- Align with the market by considering a 1 Night minimum stay, as 40.5% of Erding hosts use this setting.
- Explore offering discounts for stays of 30+ nights to attract the 18.9% of the market seeking extended stays.
- Adjust minimum nights based on seasonality – potentially shorter during low season and longer during peak demand periods in Erding.
Erding Airbnb Cancellation Policy Trends Analysis (2026)
Limited
2 listings
5.4% of total
Flexible
5 listings
13.5% of total
Moderate
22 listings
59.5% of total
Firm
7 listings
18.9% of total
Strict
1 listings
2.7% of total
Cancellation Policy Insights for Erding
- The prevailing Airbnb cancellation policy trend in Erding is Moderate, used by 59.5% of listings.
- The market strongly favors guest-friendly terms, with 73.0% of listings offering Flexible or Moderate policies. This suggests guests in Erding may expect booking flexibility.
- Strict cancellation policies are quite rare (2.7%), potentially making listings with this policy less competitive unless justified by high demand or property type.
Recommendations for Hosts
- Consider adopting a Moderate policy to align with the 59.5% market standard in Erding.
- Using a Strict policy might deter some guests, as only 2.7% of listings use it. Evaluate if potential revenue protection outweighs possible lower booking rates.
- Regularly review your cancellation policy against competitors and market demand shifts in Erding.
Erding STR Booking Lead Time Analysis (2026)
Average Booking Lead Time by Month
Booking Lead Time Insights for Erding
- The overall average booking lead time for vacation rentals in Erding is 57 days.
- Guests book furthest in advance for stays during July (average 79 days), likely coinciding with peak travel demand or local events.
- The shortest booking windows occur for stays in March (average 31 days), indicating more last-minute travel plans during this time.
- Seasonally, Summer (66 days avg.) sees the longest lead times, while Winter (41 days avg.) has the shortest, reflecting typical travel planning cycles.
Recommendations for Hosts
- Use the overall average lead time (57 days) as a baseline for your pricing and availability strategy in Erding.
- For July stays, consider implementing length-of-stay discounts or slightly higher rates for bookings made less than 79 days out to capitalize on advance planning.
- Target marketing efforts for the Summer season well in advance (at least 66 days) to capture early planners.
- Monitor your own booking lead times against these Erding averages to identify opportunities for dynamic pricing adjustments.
Popular & Essential Airbnb Amenities in Erding (2026)
Amenity Prevalence
Amenity Insights for Erding
- Essential amenities in Erding that guests expect include: Smoke alarm, Heating. Lacking these (any) could significantly impact bookings.
- Popular amenities like Wifi, Essentials, Hot water are common but not universal. Offering these can provide a competitive edge.
- Warning: Wifi is not universally provided but is considered essential globally. Ensure reliable Wifi is offered.
Recommendations for Hosts
- Ensure your listing includes all essential amenities for Erding: Smoke alarm, Heating.
- Prioritize adding missing essentials: Smoke alarm, Heating.
- Consider adding popular differentiators like Wifi or Essentials to increase appeal.
- Highlight unique or less common amenities you offer (e.g., hot tub, dedicated workspace, EV charger) in your listing description and photos.
- Regularly check competitor amenities in Erding to stay competitive.
Erding Airbnb Guest Demographics & Profile Analysis (2026)
Guest Profile Summary for Erding
- The typical guest profile for Airbnb in Erding consists of a mix of domestic (53%) and international guests, often arriving from nearby Frankfurt, typically belonging to the Post-2000s (Gen Z/Alpha) group (50%), primarily speaking English or German.
- Domestic travelers account for 53.4% of guests.
- Key international markets include Germany (53.4%) and United States (10.7%).
- Top languages spoken are English (43.2%) followed by German (31.1%).
- A significant demographic segment is the Post-2000s (Gen Z/Alpha) group, representing 50% of guests.
Recommendations for Hosts
- Balance marketing efforts between domestic and international channels based on the guest mix.
- Tailor amenities and listing descriptions to appeal to the dominant Post-2000s (Gen Z/Alpha) demographic (e.g., highlight fast WiFi, smart home features, local guides).
- Highlight unique local experiences or amenities relevant to the primary guest profile.
- Consider seasonal promotions aligned with peak travel times for key origin markets.
Nearby Short-Term Rental Market Comparison
How does the Erding Airbnb market stack up against its neighbors? Compare key performance metrics like average monthly revenue, ADR, and occupancy rates in surrounding areas to understand the broader regional STR landscape.
| Market | Active Properties | Monthly Revenue | Daily Rate | Avg. Occupancy |
|---|---|---|---|---|
| Scheffau am Wilden Kaiser | 12 | $6,669 | $906.83 | 30% |
| Balderschwang | 10 | $5,253 | $304.03 | 58% |
| Going am Wilden Kaiser | 27 | $3,596 | $406.50 | 37% |
| Kramsach | 12 | $3,573 | $272.32 | 48% |
| Bayrischzell | 41 | $3,550 | $389.91 | 33% |
| Krimml | 53 | $3,544 | $359.14 | 41% |
| Reith bei Kitzbühel | 49 | $3,385 | $356.25 | 34% |
| Stans | 12 | $3,115 | $255.48 | 43% |
| Pfafflar | 11 | $3,053 | $255.26 | 50% |
| Thaur | 12 | $2,954 | $152.36 | 69% |