Olching Airbnb Market Analysis 2025: Short Term Rental Data & Vacation Rental Statistics in Bavaria, Germany
Is Airbnb profitable in Olching in 2025? Explore comprehensive Airbnb analytics for Olching, Bavaria, Germany to uncover income potential. This 2025 STR market report for Olching, based on AirROI data from November 2024 to October 2025, reveals key trends in the niche market of 18 active listings.
Whether you're considering an Airbnb investment in Olching, optimizing your existing vacation rental, or exploring rental arbitrage opportunities, understanding the Olching Airbnb data is crucial. Leveraging the low regulation environment is key to maximizing your short term rental income potential. Let's dive into the specifics.
Key Olching Airbnb Performance Metrics Overview
Monthly Airbnb Revenue Variations & Income Potential in Olching (2025)
Understanding the monthly revenue variations for Airbnb listings in Olching is key to maximizing your short term rental income potential. Seasonality significantly impacts earnings. Our analysis, based on data from the past 12 months, shows that the peak revenue month for STRs in Olching is typically September, while January often presents the lowest earnings, highlighting opportunities for strategic pricing adjustments during shoulder and low seasons. Explore the typical Airbnb income in Olching across different performance tiers:
- Best-in-class properties (Top 10%) achieve $3,447+ monthly, often utilizing dynamic pricing and superior guest experiences.
- Strong performing properties (Top 25%) earn $1,879 or more, indicating effective management and desirable locations/amenities.
- Typical properties (Median) generate around $1,140 per month, representing the average market performance.
- Entry-level properties (Bottom 25%) see earnings around $574, often with potential for optimization.
Average Monthly Airbnb Earnings Trend in Olching
Olching Airbnb Occupancy Rate Trends (2025)
Maximize your bookings by understanding the Olching STR occupancy trends. Seasonal demand shifts significantly influence how often properties are booked. Typically, Junesees the highest demand (peak season occupancy), while January experiences the lowest (low season). Effective strategies, like adjusting minimum stays or offering promotions, can boost occupancy during slower periods. Here's how different property tiers perform in Olching:
- Best-in-class properties (Top 10%) achieve 79%+ occupancy, indicating high desirability and potentially optimized availability.
- Strong performing properties (Top 25%) maintain 64% or higher occupancy, suggesting good market fit and guest satisfaction.
- Typical properties (Median) have an occupancy rate around 37%.
- Entry-level properties (Bottom 25%) average 19% occupancy, potentially facing higher vacancy.
Average Monthly Occupancy Rate Trend in Olching
Average Daily Rate (ADR) Airbnb Trends in Olching (2025)
Effective short term rental pricing strategy in Olching involves understanding monthly ADR fluctuations. The Average Daily Rate (ADR) for Airbnb in Olching typically peaks in September and dips lowest during February. Leveraging Airbnb dynamic pricing tools or strategies based on this seasonality can significantly boost revenue. Here's a look at the typical nightly rates achieved:
- Best-in-class properties (Top 10%) command rates of $176+ per night, often due to premium features or locations.
- Strong performing properties (Top 25%) achieve nightly rates of $128 or more.
- Typical properties (Median) charge around $87 per night.
- Entry-level properties (Bottom 25%) earn around $68 per night.
Average Daily Rate (ADR) Trend by Month in Olching
Get Live Olching Market Intelligence 👇
Explore Real-time Analytics
Airbnb Seasonality Analysis & Trends in Olching (2025)
Peak Season (September, June, November)
- Revenue averages $2,086 per month
- Occupancy rates average 52.4%
- Daily rates average $118
Shoulder Season
- Revenue averages $1,647 per month
- Occupancy maintains around 46.4%
- Daily rates hold near $110
Low Season (January, February, March)
- Revenue drops to average $861 per month
- Occupancy decreases to average 29.1%
- Daily rates adjust to average $99
Seasonality Insights for Olching
- The Airbnb seasonality in Olching shows highly seasonal trends requiring careful strategy. While the sections above show seasonal averages, it's also insightful to look at the extremes:
- During the high season, the absolute peak month showcases Olching's highest earning potential, with monthly revenues capable of climbing to $2,235, occupancy reaching a high of 60.5%, and ADRs peaking at $133.
- Conversely, the slowest single month of the year, typically falling within the low season, marks the market's lowest point. In this month, revenue might dip to $681, occupancy could drop to 25.3%, and ADRs may adjust down to $98.
- Understanding both the seasonal averages and these monthly peaks and troughs in revenue, occupancy, and ADR is crucial for maximizing your Airbnb profit potential in Olching.
Seasonal Strategies for Maximizing Profit
- Peak Season: Maximize revenue through premium pricing and potentially longer minimum stays. Ensure high availability.
- Low Season: Offer competitive pricing, special promotions (e.g., extended stay discounts), and flexible cancellation policies. Target off-season travelers like remote workers or budget-conscious guests.
- Shoulder Seasons: Implement dynamic pricing that balances peak and low rates. Target weekend travelers or specific events. Offer slightly more flexible terms than peak season.
- Regularly analyze your own performance against these Olching seasonality benchmarks and adjust your pricing and availability strategy accordingly.
Best Areas for Airbnb Investment in Olching (2025)
Exploring the top neighborhoods for short-term rentals in Olching? This section highlights key areas, outlining why they are attractive for hosts and guests, along with notable local attractions. Consider these locations based on your target guest profile and investment strategy.
| Neighborhood / Area | Why Host Here? (Target Guests & Appeal) | Key Attractions & Landmarks |
|---|---|---|
| Olching City Center | The heart of Olching offers convenience with shops, restaurants, and easy access to public transportation. It attracts both tourists and business travelers looking for central accommodations. | Olching Town Hall, Local shops and cafes, Public transportation access, Parks and recreation areas |
| Olching Park Area | A quiet residential area close to parks and family-friendly amenities. Ideal for travelers seeking a relaxed stay in a suburban setting. | Olching Park, Playgrounds, Walking trails, Sports facilities |
| Near the S-Bahn Station | Proximity to the S-Bahn allows easy transport to Munich, making it attractive for visitors who wish to explore the city without staying in a dense urban area. | Quick access to Munich, Local restaurants, Public transport links, Weekend markets |
| Family-Friendly Neighborhoods | Olching has several family-oriented neighborhoods that are perfect for guests traveling with children, offering spacious accommodations and local amusement options. | Nearby schools and parks, Family entertainment centers, Quiet residential ambiance |
| Historic Sites | Areas near Olching's historic sites appeal to history buffs and tourists interested in local culture and heritage. | Local historical buildings, Cultural events and festivals, Guided historical tours |
| Café Street | Home to numerous cafes and eateries, this area is popular for those who enjoy a culinary experience, drawing food enthusiasts from nearby regions. | Quaint cafes, Local bakeries, Dining options, Culinary festivals |
| Nature Spots | Close to natural attractions, this area offers outdoor activities for guests who enjoy hiking and nature, making it appealing year-round. | Nearby forests, Hiking trails, Biking routes, Picnic spots |
| Shopping District | This area features various shopping options, attracting guests interested in retail therapy during their stay in Olching. | Local shops, Markets, Cafes, Seasonal events |
Understanding Airbnb License Requirements & STR Laws in Olching (2025)
While Olching, Bavaria, Germany currently shows low STR regulations, specific Airbnb license requirements might still exist or change. Always verify the latest short term rental regulations and Airbnb license requirements directly with local government authorities for Olching to ensure full compliance before hosting.
(Source: AirROI data, 2025, finding no licensed listings among those analyzed)
Top Performing Airbnb Properties in Olching (2025)
Benchmark your potential! Explore examples of top-performing Airbnb properties in Olchingbased on Trailing Twelve Month (TTM) revenue. Analyze their characteristics, revenue, occupancy rate, and ADR to understand what drives success in this market.
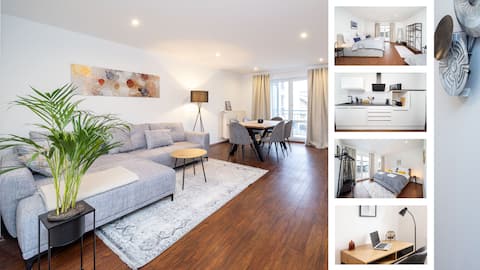
LaDolceVita I 100 m2 Modern apartment I Central
Entire Place • 2 bedrooms
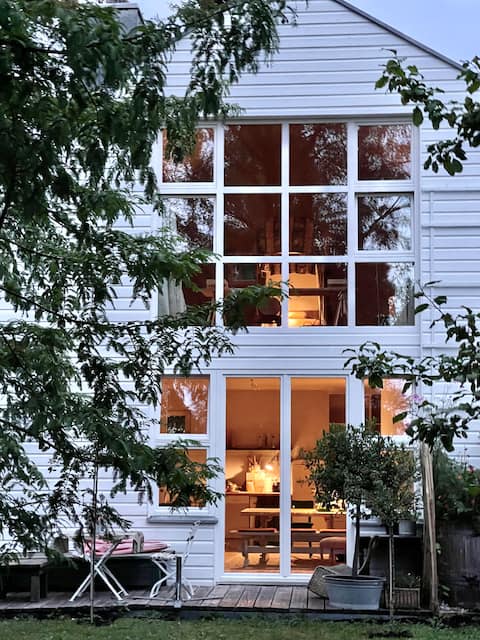
Pleasant nature-loving house near the city
Entire Place • 2 bedrooms
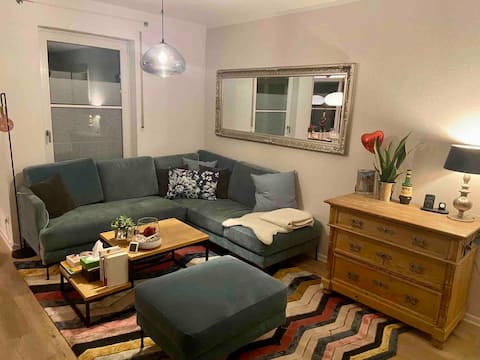
Beautiful 3-room apartment /train 20 min. directly Munich
Entire Place • 2 bedrooms
Apartment in the basement - newly renovated
Entire Place • N/A
Freundl. Zi. in EFH in Olching nähe München
Private Room • N/A

By S-Bahn in 20 minutes to the city center
Entire Place • 1 bedroom
Note: Performance varies based on location, size, amenities, seasonality, and management quality. Data reflects the past 12 months.
Top Performing Airbnb Hosts in Olching (2025)
Learn from the best! This table showcases top-performing Airbnb hosts in Olching based on the number of properties managed and estimated total revenue over the past year. Analyze their scale and performance metrics.
| Host Name | Properties | Grossing Revenue | Stay Reviews | Avg Rating |
|---|---|---|---|---|
| Leonardo | 1 | $64,400 | 61 | 4.97/5.0 |
| Carola | 1 | $35,126 | 18 | 5.00/5.0 |
| Carola | 2 | $23,858 | 73 | 4.79/5.0 |
| Kathrin | 1 | $23,623 | 21 | 4.95/5.0 |
| Hans-Jürgen Und Theresia | 1 | $15,475 | 124 | 4.94/5.0 |
| Alexander | 1 | $15,175 | 31 | 4.90/5.0 |
| Gesa | 1 | $15,150 | 100 | 4.99/5.0 |
| Konstanze | 1 | $12,709 | 254 | 4.74/5.0 |
| Thea | 2 | $11,326 | 88 | 4.96/5.0 |
| Yhonatan | 1 | $11,264 | 28 | 4.75/5.0 |
Analyzing the strategies of top hosts, such as their property selection, pricing, and guest communication, can offer valuable lessons for optimizing your own Airbnb operations in Olching.
Dive Deeper: Advanced Olching STR Market Data (2025)
Ready to unlock more insights? AirROI provides access to advanced metrics and comprehensive Airbnb data for Olching. Explore detailed analytics beyond this report to refine your investment strategy, optimize pricing, and maximize your vacation rental profits.
Explore Advanced MetricsOlching Short-Term Rental Market Composition (2025): Property & Room Types
Room Type Distribution
Property Type Distribution
Market Composition Insights for Olching
- The Olching Airbnb market composition is heavily skewed towards Entire Home/Apt listings, which make up 66.7% of the 18 active rentals. This indicates strong guest preference for privacy and space.
- However, a notable 33.3% share for Private Rooms suggests opportunities for budget-conscious travelers or hosts renting out spare rooms.
- Looking at the property type distribution in Olching, Apartment/Condo properties are the most common (66.7%), reflecting the local real estate landscape.
- Houses represent a significant 16.7% portion, catering likely to families or larger groups.
- The presence of 5.6% Hotel/Boutique listings indicates integration with traditional hospitality.
Olching Airbnb Room Capacity Analysis (2025): Bedroom Distribution
Distribution of Listings by Number of Bedrooms
Room Capacity Insights for Olching
- The dominant room capacity in Olching is 1 bedroom listings, making up 44.4% of the market. This suggests a strong demand for properties suitable for couples or solo travelers.
- Together, 1 bedroom and 2 bedrooms properties represent 61.1% of the active Airbnb listings in Olching, indicating a high concentration in these sizes.
Olching Vacation Rental Guest Capacity Trends (2025)
Distribution of Listings by Guest Capacity
Guest Capacity Insights for Olching
- The most common guest capacity trend in Olching vacation rentals is listings accommodating 2 guests (38.9%). This suggests the primary traveler segment is likely couples or solo travelers.
- Properties designed for 2 guests and 4 guests dominate the Olching STR market, accounting for 55.6% of listings.
- On average, properties in Olching are equipped to host 1.9 guests.
Olching Airbnb Booking Patterns (2025): Available vs. Booked Days
Available Days Distribution
Booked Days Distribution
Booking Pattern Insights for Olching
- The most common availability pattern in Olching falls within the 271-366 days range, representing 38.9% of listings. This suggests many properties have significant open periods on their calendars.
- Approximately 72.2% of listings show high availability (181+ days open annually), indicating potential for increased bookings or specific owner usage patterns.
- For booked days, the 91-180 days range is most frequent in Olching (27.8%), reflecting common guest stay durations or potential owner blocking patterns.
- A notable 33.4% of properties secure long booking periods (181+ days booked per year), highlighting successful long-term rental strategies or significant owner usage.
Olching Airbnb Minimum Stay Requirements Analysis
Distribution of Listings by Minimum Night Requirement
1 Night
3 listings
16.7% of total
2 Nights
6 listings
33.3% of total
3 Nights
1 listings
5.6% of total
4-6 Nights
3 listings
16.7% of total
30+ Nights
5 listings
27.8% of total
Key Insights
- The most prevalent minimum stay requirement in Olching is 2 Nights, adopted by 33.3% of listings. This highlights the market's preference for shorter, flexible bookings.
- A significant segment (27.8%) caters to monthly stays (30+ nights) in Olching, pointing to opportunities in the extended-stay market.
Recommendations
- Align with the market by considering a 2 Nights minimum stay, as 33.3% of Olching hosts use this setting.
- If feasible, allowing 1-night stays, especially midweek or during low season, could capture last-minute bookings, as only 16.7% currently do.
- A 2-night minimum appears standard (33.3%). Consider this for weekends or peak periods.
- Explore offering discounts for stays of 30+ nights to attract the 27.8% of the market seeking extended stays.
- Adjust minimum nights based on seasonality – potentially shorter during low season and longer during peak demand periods in Olching.
Olching Airbnb Cancellation Policy Trends Analysis (2025)
Flexible
1 listings
5.6% of total
Moderate
9 listings
50% of total
Firm
7 listings
38.9% of total
Strict
1 listings
5.6% of total
Cancellation Policy Insights for Olching
- The prevailing Airbnb cancellation policy trend in Olching is Moderate, used by 50% of listings.
- There's a relatively balanced mix between guest-friendly (55.6%) and stricter (44.5%) policies, offering choices for different guest needs.
- Strict cancellation policies are quite rare (5.6%), potentially making listings with this policy less competitive unless justified by high demand or property type.
Recommendations for Hosts
- Consider adopting a Moderate policy to align with the 50% market standard in Olching.
- Using a Strict policy might deter some guests, as only 5.6% of listings use it. Evaluate if potential revenue protection outweighs possible lower booking rates.
- Regularly review your cancellation policy against competitors and market demand shifts in Olching.
Olching STR Booking Lead Time Analysis (2025)
Average Booking Lead Time by Month
Booking Lead Time Insights for Olching
- The overall average booking lead time for vacation rentals in Olching is 41 days.
- Guests book furthest in advance for stays during August (average 67 days), likely coinciding with peak travel demand or local events.
- The shortest booking windows occur for stays in February (average 19 days), indicating more last-minute travel plans during this time.
- Seasonally, Fall (59 days avg.) sees the longest lead times, while Winter (26 days avg.) has the shortest, reflecting typical travel planning cycles.
Recommendations for Hosts
- Use the overall average lead time (41 days) as a baseline for your pricing and availability strategy in Olching.
- For August stays, consider implementing length-of-stay discounts or slightly higher rates for bookings made less than 67 days out to capitalize on advance planning.
- Target marketing efforts for the Fall season well in advance (at least 59 days) to capture early planners.
- Monitor your own booking lead times against these Olching averages to identify opportunities for dynamic pricing adjustments.
Popular & Essential Airbnb Amenities in Olching (2025)
Amenity Prevalence
Amenity Insights for Olching
- Essential amenities in Olching that guests expect include: Hair dryer. Lacking these (this) could significantly impact bookings.
- Popular amenities like Bed linens, Heating, Hangers are common but not universal. Offering these can provide a competitive edge.
- Warning: Wifi is not universally provided but is considered essential globally. Ensure reliable Wifi is offered.
Recommendations for Hosts
- Ensure your listing includes all essential amenities for Olching: Hair dryer.
- Consider adding popular differentiators like Bed linens or Heating to increase appeal.
- Highlight unique or less common amenities you offer (e.g., hot tub, dedicated workspace, EV charger) in your listing description and photos.
- Regularly check competitor amenities in Olching to stay competitive.
Olching Airbnb Guest Demographics & Profile Analysis (2025)
Guest Profile Summary for Olching
- The typical guest profile for Airbnb in Olching consists of a mix of domestic (45%) and international guests, with top international origins including United States, typically belonging to the Post-2000s (Gen Z/Alpha) group (50%), primarily speaking English or German.
- Domestic travelers account for 44.8% of guests.
- Key international markets include Germany (44.8%) and United States (9%).
- Top languages spoken are English (40.2%) followed by German (25.6%).
- A significant demographic segment is the Post-2000s (Gen Z/Alpha) group, representing 50% of guests.
Recommendations for Hosts
- Balance marketing efforts between domestic and international channels based on the guest mix.
- Tailor amenities and listing descriptions to appeal to the dominant Post-2000s (Gen Z/Alpha) demographic (e.g., highlight fast WiFi, smart home features, local guides).
- Highlight unique local experiences or amenities relevant to the primary guest profile.
- Consider seasonal promotions aligned with peak travel times for key origin markets.
Nearby Short-Term Rental Market Comparison
How does the Olching Airbnb market stack up against its neighbors? Compare key performance metrics like average monthly revenue, ADR, and occupancy rates in surrounding areas to understand the broader regional STR landscape.
| Market | Active Properties | Monthly Revenue | Daily Rate | Avg. Occupancy |
|---|---|---|---|---|
| Scheffau am Wilden Kaiser | 12 | $7,576 | $916.94 | 30% |
| Balderschwang | 10 | $5,422 | $312.27 | 60% |
| Bayrischzell | 40 | $4,251 | $411.48 | 33% |
| Going am Wilden Kaiser | 26 | $3,963 | $431.30 | 38% |
| Krimml | 53 | $3,875 | $362.26 | 42% |
| Reith bei Kitzbühel | 46 | $3,828 | $377.27 | 38% |
| Warth | 26 | $3,526 | $340.56 | 40% |
| Kitzbühel | 156 | $3,526 | $437.61 | 35% |
| Sankt Anton am Arlberg | 138 | $3,480 | $511.13 | 40% |
| Itter | 31 | $3,390 | $446.91 | 39% |