Naples, Campania Airbnb Market Data 2026: STR Report & Statistics
How much can you earn on Airbnb in Naples, Campania? Based on AirROI's 2026 dataset (July 2025 – June 2026), the short answer is $14,968 per year — at a $147 nightly rate, 37.9% occupancy, and a $55 RevPAR that reflects moderate rate-to-revenue efficiency with room to optimize.
Naples's 7,415 active listings and moderate demand with room for well-positioned listings to outperform make it a major short-term rental market. Supply grew 11.3% over the past year, yet revenue and nightly rates both trended upward — a signal that traveler demand is outpacing new inventory rather than being diluted by it. For hosts, pricing power remains intact even as competition increases.
Regulation is high and 89% of listings show active registration — compliance is the cost of entry. The data points to a market where fundamentals reward execution — the right property, priced well, in the right neighborhood still outperforms.

Table of Contents [hide] [show]
What Are the Key Airbnb Metrics in Naples?
In Naples, the headline Airbnb metrics are $14,968 in average annual revenue,37.9% occupancy, $147 ADR, and $55 in RevPAR, and guests book about 51 days in advance.
How Much Do Airbnb Hosts Earn Monthly in Naples?
Understanding the monthly revenue variations for Airbnb listings in Naples is key to maximizing your short term rental income potential. Seasonality significantly impacts earnings. Our analysis, based on data from the past 12 months, shows that the peak revenue month for STRs in Naples is typically April, while January often presents the lowest earnings, highlighting opportunities for strategic pricing adjustments during shoulder and low seasons. Explore the typical Airbnb income in Naples across different performance tiers:
- Best-in-class properties (Top 10%) achieve $3,727+ monthly, often utilizing dynamic pricing and superior guest experiences.
- Strong performing properties (Top 25%) earn $2,404 or more, indicating effective management and desirable locations/amenities.
- Typical properties (Median) generate around $1,435 per month, representing the average market performance.
- Entry-level properties (Bottom 25%) see earnings around $711, often with potential for optimization.
Average Monthly Airbnb Earnings Trend in Naples
What Is the Monthly Airbnb Occupancy Rate in Naples?
Maximize your bookings by understanding the Naples STR occupancy trends. Seasonal demand shifts significantly influence how often properties are booked. Typically, Septembersees the highest demand (peak season occupancy), while January experiences the lowest (low season). Effective strategies, like adjusting minimum stays or offering promotions, can boost occupancy during slower periods. Here's how different property tiers perform in Naples:
- Best-in-class properties (Top 10%) achieve 78%+ occupancy, indicating high desirability and potentially optimized availability.
- Strong performing properties (Top 25%) maintain 62% or higher occupancy, suggesting good market fit and guest satisfaction.
- Typical properties (Median) have an occupancy rate around 40%.
- Entry-level properties (Bottom 25%) average 19% occupancy, potentially facing higher vacancy.
Average Monthly Occupancy Rate Trend in Naples
What Is the Average Airbnb Nightly Rate in Naples?
Effective short term rental pricing strategy in Naples involves understanding monthly ADR fluctuations. The Average Daily Rate (ADR) for Airbnb in Naples typically peaks in May and dips lowest during November. Leveraging Airbnb dynamic pricing tools or strategies based on this seasonality can significantly boost revenue. Here's a look at the typical nightly rates achieved:
- Best-in-class properties (Top 10%) command rates of $238+ per night, often due to premium features or locations.
- Strong performing properties (Top 25%) achieve nightly rates of $158 or more.
- Typical properties (Median) charge around $114 per night.
- Entry-level properties (Bottom 25%) earn around $88 per night.
Average Daily Rate (ADR) Trend by Month in Naples
What Is the RevPAR for Airbnb in Naples?
RevPAR in Naples is currently $55. Because RevPAR combines nightly rates with realized occupancy, it is one of the cleanest ways to compare how efficiently listings turn demand into revenue across the market.
- Entry-level properties (Bottom 25%) see $26 RevPAR.
- Typical properties (Median) generate $42 RevPAR.
- Strong performers (Top 25%) earn $67 RevPAR.
- Best-in-class (Top 10%) achieve $104 RevPAR.
Average Monthly RevPAR Trend in Naples
RevPAR Insights for Naples
- The average RevPAR in Naples is $55. This metric combines nightly rates with realized occupancy, making it one of the best single-number indicators of market efficiency.
- The gap between the top 10% ($104) and bottom 25% ($26) is $79, suggesting a relatively compressed market where operational differences yield moderate returns.
- RevPAR peaks in Apr and bottoms out in Jan, mirroring the broader seasonal demand pattern and suggesting opportunities for dynamic pricing.
Recommendations for Hosts
- Track your own RevPAR monthly against these Naples benchmarks. If your RevPAR falls below the median of $42, examine whether low occupancy or low ADR is the primary drag.
- Top-quartile listings achieve $67+ RevPAR through a combination of competitive pricing, strong reviews, and strategic amenities. Target this tier through incremental improvements.
- Use RevPAR rather than revenue alone when comparing properties of different sizes — it normalizes for available nights and gives a more accurate picture of performance.
Get Live Naples Market Intelligence 👇
Explore Real-time Analytics
When Is the Peak Season for Airbnb in Naples?
Naples's peak Airbnb season falls in April, May, September, while the softest stretch is January, February, November. Overall, the market shows highly seasonal trends requiring careful strategy, which should guide pricing, minimum stays, and cash-flow planning.
Peak Season (April, May, September)
- Revenue averages $2,422 per month
- Occupancy rates average 51.5%
- Daily rates average $155
Shoulder Season
- Revenue averages $1,916 per month
- Occupancy maintains around 42.8%
- Daily rates hold near $146
Low Season (January, February, November)
- Revenue drops to average $1,219 per month
- Occupancy decreases to average 31.2%
- Daily rates adjust to average $137
Seasonality Insights for Naples
- Airbnb seasonality in Naples is pronounced. Revenue swings sharply between peak and low months, which means pricing strategy, minimum-stay settings, and cash reserves all need to account for extended slower periods.
- During the high season, the absolute peak month showcases Naples's highest earning potential, with monthly revenues climbing to $2,492, occupancy reaching 54.9%, and ADRs peaking at $162.
- Conversely, the slowest single month marks the market's lowest point — revenue may dip to $1,024, occupancy could drop to 24.9%, and ADRs may adjust to $135.
- Lower occupancy paired with meaningful seasonality means hosts in Naples need to maximize every peak-season booking and seriously consider whether off-season pricing adjustments or minimum-stay changes can capture incremental revenue.
Seasonal Strategies for Maximizing Profit
- Peak Season: Maximize revenue through premium pricing. In a high-regulation market like Naples, ensure your permit covers the number of nights you plan to book — some jurisdictions cap annual rental days.
- Low Season: Offer competitive pricing, extended-stay discounts, and flexible cancellation policies. Target off-season travelers like remote workers, budget-conscious guests, and travelers with flexible schedules.
- Shoulder Seasons: Implement dynamic pricing that bridges peak and low rates. Target weekend travelers, local events, and business visitors. Slightly more flexible terms than peak season can help maintain occupancy without deep discounting.
- In a highly seasonal market like Naples, building a cash reserve during the top months is essential for covering fixed costs during the slow period. Automated pricing tools can help capture demand shifts in real time.
Do You Need a License for Airbnb in Naples?
Yes, Naples, Campania, Italy enforces high STR regulations and 89% of active listings show registration evidence — indicating that enforcement is active and compliance is a prerequisite for operating legally. Hosts entering this market should budget for permit fees, inspections, and potential occupancy tax obligations as part of their startup costs. Always verify the latest short-term rental regulations and Airbnb license requirements directly with local government authorities for Naples to ensure full compliance before hosting.
(Source: AirROI data, 2026, based on 89% licensed listings)
What Are the Best Neighborhoods for Airbnb in Naples?
In a large, heavily regulated market like Naples, neighborhood selection is one of the strongest levers for Airbnb investment performance. Zoning rules, permitting availability, and guest demand patterns can vary block by block. The 8 neighborhoods below represent areas where short-term rental activity concentrates — understanding why each one attracts guests and hosts helps investors evaluate where their property type and budget fit best.
| Neighborhood / Area | Why Host Here? (Target Guests & Appeal) | Key Attractions & Landmarks |
|---|---|---|
| Chiaia | Elegant and historic district known for its upscale shopping, beautiful waterfront, and vibrant nightlife. A prime area for tourists looking for a mix of culture and leisure. | Lungomare Caracciolo, Parco Virgiliano, Piazza dei Martiri, Via Chiaia, Teatro di San Carlo |
| Spaccanapoli | The heart of Naples with narrow streets and rich history. Ideal for visitors wanting to explore authentic Neapolitan life, cuisine, and culture. | Naples Cathedral, Chiesa dei Santi Severino e Sossio, Piazza del Gesù Nuovo, San Gregorio Armeno, Via San Biagio dei Librai |
| Vomero | Hilly district offering stunning views of the bay and a more relaxed atmosphere. Popular among families and those seeking local experiences. | Certosa di San Martino, Vomero Castle, Piazza Vanvitelli, Metro Art Culture, Via Scarlatti |
| Centro Storico | The historic center of Naples is a UNESCO World Heritage site with rich architecture and vibrant street life. A cultural hotspot for tourists. | Royal Palace of Naples, San Carlo Theatre, Piazza Bellini, Underground Naples, Museo Archeologico Nazionale |
| Posillipo | Prestigious residential area known for its views of the Gulf of Naples. Attracts visitors seeking scenic beauty and tranquility. | Parco Virgiliano, Posillipo Hill, Lido Marechiaro, Parco della Rimembranza, Villa Donn’Anna |
| Mergellina | Charming seaside neighborhood with a picturesque promenade, good seafood restaurants, and easy access to ferries to Capria and Ischia. A favorite for both locals and tourists. | Molo Beverello, Villa Comunale, Via Caracciolo, Sant'Elmo Castle, Palazzo Donn’Anna |
| Bagnoli | Former industrial area that is gradually being redeveloped into a trendy neighborhood. Attractive for its proximity to the coast and the coming facilities. | Parco Archeologico del Pausilypon, Bagnoli Beach, Caminetto Canale, Parco Virgiliano, Piazza della Repubblica |
| Santa Lucia | Scenic coastal area with historic buildings and a vibrant maritime atmosphere. Offers a touch of old-world charm close to the waterfront. | Fountain of Neptune, Palazzo Reale, Borgo Marinari, Via Monte di Dio, Castel dell'Ovo |
Because Naples has a high regulation profile, confirming that short-term rental permits are available in your target neighborhood is a critical first step before committing to a property purchase. Regulation can vary at the neighborhood or district level even within the same city.
What Types of Properties Are on Airbnb in Naples?
Room Type Distribution
Property Type Distribution
Market Composition Insights for Naples
- The Naples Airbnb market composition is heavily skewed towards Entire Home/Apt listings, which make up 73.5% of the 7,415 active rentals. This indicates strong guest preference for privacy and space.
- Looking at the property type distribution in Naples, Apartment/Condo properties are the most common (72.6%), reflecting the local real estate landscape.
- Houses represent a significant 15.3% portion, catering likely to families or larger groups.
- The presence of 11.4% Hotel/Boutique listings indicates integration with traditional hospitality.
- Smaller segments like others, outdoor/unique (combined 0.7%) offer potential for unique stay experiences.
Naples Airbnb Room Capacity Analysis (2026): Bedroom Distribution
Distribution of Listings by Number of Bedrooms
Room Capacity Insights for Naples
- The dominant room capacity in Naples is 1 bedroom listings, making up 48.3% of the market. This suggests a strong demand for properties suitable for couples or solo travelers.
- Together, 1 bedroom and 2 bedrooms properties represent 70.8% of the active Airbnb listings in Naples, indicating a high concentration in these sizes.
- Listings with 3+ bedrooms (8.7%) represent a smaller niche, potentially indicating an underserved market for larger group accommodations in Naples.
Naples Vacation Rental Guest Capacity Trends (2026)
Distribution of Listings by Guest Capacity
Guest Capacity Insights for Naples
- The most common guest capacity trend in Naples vacation rentals is listings accommodating 4 guests (26.7%). This suggests the primary traveler segment is likely small families or groups.
- Properties designed for 4 guests and 2 guests dominate the Naples STR market, accounting for 44.5% of listings.
- 17.9% of properties accommodate 6+ guests, serving the market segment for larger families or group travel in Naples.
- On average, properties in Naples are equipped to host 3.3 guests.
How Do Listings in Naples Compare on Quality?
Listing quality in Naples can be approximated through presentation depth, bedroom count, and how often hosts disclose exact locations. These signals show how professionally the local supply base is merchandised.
Listing Quality Insights for Naples
- At 31.3 photos per listing on average, Naples hosts invest well in visual presentation. Listings with 20+ photos consistently outperform in search ranking and conversion.
- 49.6% of listings show their exact location. Lower disclosure rates can increase booking hesitation — guests want to know exactly where they are staying.
Recommendations for Hosts
- Enable exact location if possible — it removes a common source of guest uncertainty and can improve your listing's position in map-based searches.
- Use these quality indicators as a self-audit checklist. Listings that exceed the Naples averages across all three metrics are better positioned for premium pricing.
What Amenities Do Airbnb Guests Expect in Naples?
Amenity Prevalence
Amenity Insights for Naples
- Essential amenities in Naples that guests expect include: Wifi, Air conditioning. Lacking these (any) could significantly impact bookings.
- Popular amenities like TV, Hair dryer, Hot water are common but not universal. Offering these can provide a competitive edge.
Recommendations for Hosts
- Ensure your listing includes all essential amenities for Naples: Wifi, Air conditioning.
- Prioritize adding missing essentials: Wifi, Air conditioning.
- Consider adding popular differentiators like TV or Hair dryer to increase appeal.
- Highlight unique or less common amenities you offer (e.g., hot tub, dedicated workspace, EV charger) in your listing description and photos.
- Regularly check competitor amenities in Naples to stay competitive.
Which Airbnb Amenities Boost Revenue in Naples?
Not every amenity matters equally. This table focuses on the amenities most associated with higher revenue in Naples, which makes it more useful for prioritizing upgrades than a simple popularity list alone.
| Amenity | Prevalence | Revenue With | Revenue Without | Revenue Uplift |
|---|---|---|---|---|
Ocean viewHigh opportunity | 0.2% | $40,851 | $14,926 | 173.7% |
Heating | 86.9% | $16,167 | $6,992 | 131.2% |
Beach essentialsHigh opportunity | 0.8% | $34,249 | $14,813 | 131.2% |
Baby monitorHigh opportunity | 0.4% | $33,647 | $14,894 | 125.9% |
Kitchen | 77.7% | $17,065 | $7,647 | 123.2% |
SaunaHigh opportunity | 0.2% | $31,368 | $14,932 | 110.1% |
Dishes and silverware | 70.1% | $17,647 | $8,686 | 103.2% |
Theme roomHigh opportunity | 1.7% | $29,514 | $14,718 | 100.5% |
Sound systemHigh opportunity | 3.0% | $29,094 | $14,538 | 100.1% |
Sun loungers | 2.2% | $29,150 | $14,651 | 99.0% |
Revenue Impact Insights for Naples
- Ocean view tops the revenue impact list with a 173.7% uplift — listings with this amenity earn $40,851 vs. $14,926 without it.
- High-opportunity amenities — Ocean view, Beach essentials, Baby monitor — combine revenue uplift above 100% with prevalence under 10%, meaning most competitors haven't adopted them yet.
- Heating — while widespread — still correlate with meaningful revenue gains, making it table stakes rather than true differentiators.
Recommendations for Hosts
- Prioritize adding Ocean view — it has the best combination of high revenue impact and low market saturation in Naples.
- Focus your upgrade budget on amenities in the top half of this table. Below-median amenities may improve guest experience but contribute less to revenue growth.
- Highlight revenue-impacting amenities prominently in your listing title, photos, and description — guests can't value what they don't notice.
Dive Deeper: Advanced Naples STR Market Data (2026)
Ready to unlock more insights? AirROI provides access to advanced metrics and comprehensive Airbnb data for Naples. Explore detailed analytics beyond this report to refine your investment strategy, optimize pricing, and maximize your vacation rental profits.
Explore Advanced MetricsNaples Airbnb Guest Demographics & Profile Analysis (2026)
Guest Profile Summary for Naples
- The typical guest profile for Airbnb in Naples consists of predominantly international visitors (90%), with top international origins including United Kingdom, typically belonging to the Post-2000s (Gen Z/Alpha) group (50%), primarily speaking English or French.
- Domestic travelers account for 9.7% of guests.
- Key international markets include United States (19.1%) and United Kingdom (12.5%).
- Top languages spoken are English (41.4%) followed by French (12.4%).
- A significant demographic segment is the Post-2000s (Gen Z/Alpha) group, representing 50% of guests.
Recommendations for Hosts
- Focus marketing internationally, particularly towards travelers from United Kingdom.
- Tailor amenities and listing descriptions to appeal to the dominant Post-2000s (Gen Z/Alpha) demographic (e.g., highlight fast WiFi, smart home features, local guides).
- Highlight unique local experiences or amenities relevant to the primary guest profile.
- Consider seasonal promotions aligned with peak travel times for key origin markets.
What Are Airbnb Guest Ratings in Naples?
Listings in Naples average 4.75 out of 5 overall, with about 70.4 reviews per active listing and 27.9% of listings carrying the Guest Favorite badge.
Rating Breakdown by Category
Guest Rating Insights for Naples
- An average rating of 4.75 places Naples in solid territory. Most guests leave satisfied, though there is room for hosts to push toward the top tier.
- The strongest subcategory is Communication (4.86), while Value (4.7) trails behind — a useful signal for hosts looking to prioritize upgrades.
- 27.9% of listings carry the Guest Favorite badge, a strong trust signal that can meaningfully lift click-through and booking rates.
Recommendations for Hosts
- Focus improvement efforts on Value — even small gains in the weakest subcategory can lift overall ratings and search ranking.
- Encourage guests to leave reviews after checkout. Listings with more reviews rank higher in search results and convert browsers into bookers more effectively.
- With only 27.9% of listings earning Guest Favorite status, hosts who consistently exceed expectations have a clear competitive advantage.
Naples Airbnb Booking Patterns (2026): Available vs. Booked Days
Available Days Distribution
Booked Days Distribution
Booking Pattern Insights for Naples
- The most common availability pattern in Naples falls within the 271-366 days range, representing 55% of listings. This suggests many properties have significant open periods on their calendars.
- Approximately 80.7% of listings show high availability (181+ days open annually), indicating potential for increased bookings or specific owner usage patterns.
- For booked days, the 31-90 days range is most frequent in Naples (32.8%), reflecting common guest stay durations or potential owner blocking patterns.
- A notable 20.0% of properties secure long booking periods (181+ days booked per year), highlighting successful long-term rental strategies or significant owner usage.
How Far in Advance Do Guests Book Airbnb in Naples?
Average Booking Lead Time by Month
Booking Lead Time Insights for Naples
- The overall average booking lead time for vacation rentals in Naples is 51 days.
- Guests book furthest in advance for stays during May (average 62 days), likely coinciding with peak travel demand or local events.
- The shortest booking windows occur for stays in January (average 40 days), indicating more last-minute travel plans during this time.
- Seasonally, Summer (56 days avg.) sees the longest lead times, while Winter (42 days avg.) has the shortest, reflecting typical travel planning cycles.
Recommendations for Hosts
- Use the overall average lead time (51 days) as a baseline for your pricing and availability strategy in Naples.
- For May stays, consider implementing length-of-stay discounts or slightly higher rates for bookings made less than 62 days out to capitalize on advance planning.
- Target marketing efforts for the Summer season well in advance (at least 56 days) to capture early planners.
- Monitor your own booking lead times against these Naples averages to identify opportunities for dynamic pricing adjustments.
What Is the Average Length of Stay for Airbnb in Naples?
Guests in Naples stay about 3.8 nights on average, generating roughly 181,882 reservations and 24.6 bookings per listing in the latest AirROI dataset. The most common check-in time is 3:00 PM and check-out is 10:00 AM.
Monthly Length of Stay in Naples
Check-in Time Distribution
Check-out Time Distribution
Stay Pattern Insights for Naples
- A mid-range stay length points to leisure-driven demand — weekend getaways and short vacations. Hosts should optimize for quick turnover efficiency while keeping the guest experience smooth.
- At 24.6 bookings per listing, the turnover rate is high. Hosts with streamlined operations (self-check-in, automated messaging, reliable cleaners) have a structural advantage.
- Stay lengths peak in Aug (4.3 nights) and shorten in May (3.3 nights). Adjust minimum-night requirements seasonally to match.
Recommendations for Hosts
- With shorter average stays, focus on streamlining turnover. Self-check-in, reliable cleaning crews, and pre-staged amenities can reduce per-booking operational costs.
- Set your check-in time to match or beat the market standard of 3:00 PM. Offering early check-in flexibility can be a low-cost differentiator.
- Monitor length-of-stay seasonality to adjust minimum-night requirements — longer minimums during peak periods maximize revenue while shorter minimums fill gaps in shoulder seasons.
Naples Airbnb Minimum Stay Requirements Analysis
Distribution of Listings by Minimum Night Requirement
1 Night
2165 listings
29.2% of total
2 Nights
2207 listings
29.8% of total
3 Nights
238 listings
3.2% of total
4-6 Nights
92 listings
1.2% of total
7-29 Nights
163 listings
2.2% of total
30+ Nights
2546 listings
34.4% of total
Key Insights
- The most prevalent minimum stay requirement in Naples is 30+ Nights, adopted by 34.4% of listings. This highlights the market's preference for longer commitments.
- A significant segment (34.4%) caters to monthly stays (30+ nights) in Naples, pointing to opportunities in the extended-stay market.
Recommendations
- Align with the market by considering a 30+ Nights minimum stay, as 34.4% of Naples hosts use this setting.
- If feasible, allowing 1-night stays, especially midweek or during low season, could capture last-minute bookings, as only 29.2% currently do.
- Explore offering discounts for stays of 30+ nights to attract the 34.4% of the market seeking extended stays.
- Adjust minimum nights based on seasonality – potentially shorter during low season and longer during peak demand periods in Naples.
Naples Airbnb Cancellation Policy Trends Analysis (2026)
Super Strict 30 Days
51 listings
0.7% of total
Limited
312 listings
4.2% of total
Super Strict 60 Days
11 listings
0.1% of total
Flexible
2321 listings
31.3% of total
Moderate
4068 listings
54.9% of total
Firm
622 listings
8.4% of total
Strict
27 listings
0.4% of total
Cancellation Policy Insights for Naples
- The prevailing Airbnb cancellation policy trend in Naples is Moderate, used by 54.9% of listings.
- The market strongly favors guest-friendly terms, with 86.2% of listings offering Flexible or Moderate policies. This suggests guests in Naples may expect booking flexibility.
- Strict cancellation policies are quite rare (0.4%), potentially making listings with this policy less competitive unless justified by high demand or property type.
Recommendations for Hosts
- Consider adopting a Moderate policy to align with the 54.9% market standard in Naples.
- Using a Strict policy might deter some guests, as only 0.4% of listings use it. Evaluate if potential revenue protection outweighs possible lower booking rates.
- Regularly review your cancellation policy against competitors and market demand shifts in Naples.
How Much Are Airbnb Cleaning Fees in Naples?
Cleaning fees in Naples are meaningful operating levers, not just pass-through charges. What matters most is how often hosts charge them, how high they run relative to market norms, and how large a share of gross revenue they consume.
Cleaning Fee Insights for Naples
- 70.5% of listings charge a cleaning fee, making it standard practice in Naples. Guests expect it and factor it into their booking decisions.
- The gap between the average ($145) and median ($34) cleaning fee indicates some high-end properties are pulling the average up considerably.
- Cleaning fees represent 6.3% of gross revenue on average — a modest component of the overall booking price.
Recommendations for Hosts
- Price your cleaning fee competitively against the Naples median of $34. Fees significantly above market norms can deter bookings, especially for shorter stays.
- Monitor competitor cleaning fees regularly. Airbnb's search algorithm factors in total price, so a well-calibrated cleaning fee can improve your listing's ranking.
What Do the Top Airbnb Listings in Naples Look Like?
Benchmark your potential! Explore examples of top-performing Airbnb properties in Naplesbased on Trailing Twelve Month (TTM) revenue. Analyze their characteristics, revenue, occupancy rate, and ADR to understand what drives success in this market.
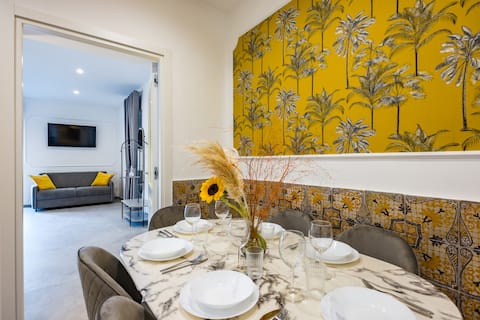
Sea & Jungle Lux | 5BDR+5BTH • BigTerrace • Centro
Entire Place • 5 bedrooms
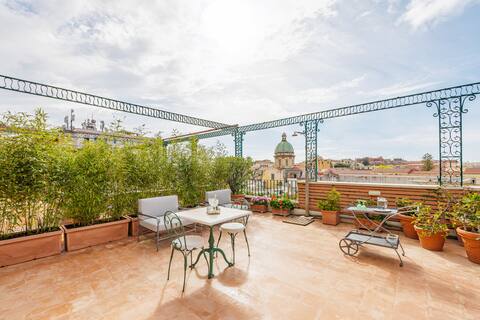
Chiaia luxury apartment 4 bedrooms with terrace
Entire Place • 4 bedrooms

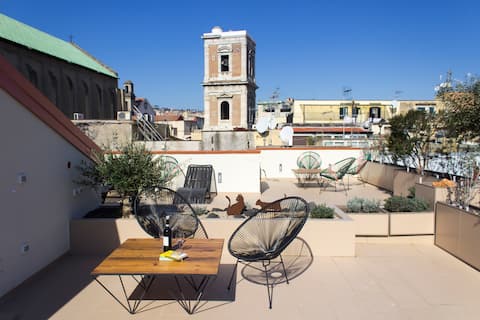
Supreme Penthouse by PNT Iconic Terrace old Naples
Entire Place • 5 bedrooms
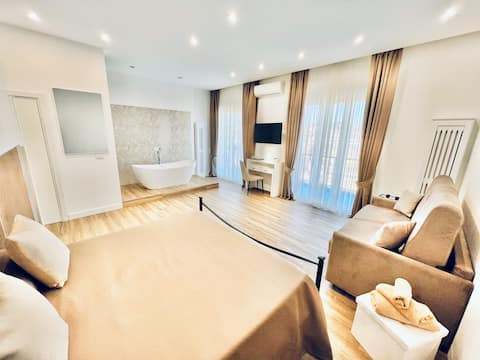
Schiara - Panoramic Designer Apartment
Entire Place • 5 bedrooms
Panoramic Facility with Sea and City Views
Entire Place • 4 bedrooms
ArtNap Boutique | Chiaia sul Mare • Downtown • 3BTH
Entire Place • 3 bedrooms
Note: Performance varies based on location, size, amenities, seasonality, and management quality. Data reflects the past 12 months.
Who Are the Top Airbnb Hosts in Naples?
Learn from the best! This table showcases top-performing Airbnb hosts in Naples based on the number of properties managed and estimated total revenue over the past year. Analyze their scale and performance metrics.
| Host Name | Properties | Grossing Revenue | Stay Reviews | Avg Rating |
|---|---|---|---|---|
| Dimorra | 142 | $2,560,312 | 3000 | 4.45/5.0 |
| Napoliapartments | 134 | $2,425,718 | 2569 | 4.53/5.0 |
| MyBnb | 99 | $1,572,626 | 1428 | 4.48/5.0 |
| Welcome | 50 | $1,386,590 | 1074 | 4.20/5.0 |
| GuestHost - Welcome To Italy | 41 | $1,132,521 | 3047 | 4.65/5.0 |
| Wonderful Italy Campania | 74 | $959,867 | 1424 | 4.16/5.0 |
| Carlo | 4 | $799,299 | 423 | 4.92/5.0 |
| Mario | 15 | $621,042 | 1285 | 4.90/5.0 |
| Luigi | 6 | $582,799 | 728 | 4.89/5.0 |
| Gennaro | 39 | $533,595 | 1331 | 4.49/5.0 |
Analyzing the strategies of top hosts, such as their property selection, pricing, and guest communication, can offer valuable lessons for optimizing your own Airbnb operations in Naples.
Who Are the Airbnb Hosts in Naples?
Naples has a relatively balanced host base.
Host Profile Insights for Naples
- A 37.2% Superhost share is healthy — enough experienced operators to anchor quality without making the market impenetrable for newcomers.
- 7.2% of listings are professionally managed, reflecting a market still dominated by individual hosts.
- 21.3% of listings have Instant Book enabled. Lower Instant Book adoption means many guests must request approval, which can slow conversions.
- 67.1% of listings use Airbnb's simplified pricing (host-only fee), where the host pays the entire platform service fee and the guest sees one all-in price with no separate Airbnb service charge. High adoption signals a professional, PMS-connected host base — Airbnb mandates simplified pricing for software-connected listings.
Recommendations for Hosts
- Earning Superhost status can significantly improve search ranking and guest trust. Focus on maintaining high response rates, low cancellations, and strong reviews.
- Consider enabling Instant Book — it reduces booking friction and Airbnb's algorithm tends to favor Instant Book listings in search results.
- With 29.3% cohosted listings, there may be a growing local market for property management services.
- Benchmark your host metrics against these Naples averages regularly and adjust your hosting strategy based on what top performers do differently.
Top Professional Management Companies in Naples
These are the highest-grossing professional property management operations in Naples, ranked by total revenue across their portfolio. Their performance metrics offer a benchmark for what institutional-level hosting looks like in this market.
| Company | Listings | Revenue | ADR | Occ. | Rating |
|---|---|---|---|---|---|
| Dimorra | 142 | $2,560,312 | $141 | 42.9% | 4.45/5 |
| Napoliapartments | 134 | $2,425,718 | $146 | 39.0% | 4.53/5 |
| MyBnb | 99 | $1,572,626 | $138 | 38.3% | 4.48/5 |
| Wonderful Italy Campania | 74 | $959,867 | $160 | 31.9% | 4.16/5 |
| Mario | 15 | $621,042 | $178 | 65.3% | 4.90/5 |
| Maria | 14 | $339,433 | $451 | 26.5% | 4.80/5 |
| Raffaele | 5 | $267,478 | $244 | 49.5% | 4.71/5 |
| Gianfranco | 12 | $235,780 | $149 | 39.5% | 4.52/5 |
| TheHappy | 5 | $180,630 | $422 | 25.3% | 4.82/5 |
| Dario | 3 | $147,855 | $152 | 85.3% | 4.93/5 |
Management Company Insights for Naples
- The leading management company, Dimorra, operates 142 listings with $2,560,312 in gross revenue — a useful benchmark for what scale looks like in Naples.
- Top managers average 50 properties each, pointing to a market where portfolio scale is a meaningful competitive factor.
- Professionally managed listings in the top tier average 4.63/5 in guest ratings — suggesting room for quality improvement even among larger operators.
Recommendations
- With only 7.2% of listings professionally managed, there may be an opportunity to differentiate through more structured operations and consistent guest experiences.
- Study how top management companies price, position, and maintain their portfolios — their ADR and occupancy rates reflect strategies refined across dozens of listings.
- If you're considering hiring a property manager, compare their portfolio performance against these benchmarks before committing.
How Does Naples's Airbnb Market Compare to Nearby Cities?
How does the Naples Airbnb market stack up against its neighbors? Compare key performance metrics like average monthly revenue, ADR, and occupancy rates in surrounding areas to understand the broader regional STR landscape.
Compared with Positano, Naples has 9 percentage points lower occupancy and about $526 lower ADR. That helps frame whether this market is winning more on demand, pricing, or both.
| Market | Active Properties | Monthly Revenue | Daily Rate | Avg. Occupancy |
|---|---|---|---|---|
| Positano | 708 | $5,897 | $672.73 | 47% |
| Praiano | 362 | $3,909 | $467.49 | 46% |
| Conca dei Marini | 122 | $3,633 | $449.14 | 43% |
| Sorrento | 1,589 | $3,630 | $365.10 | 45% |
| Capri | 421 | $3,344 | $602.43 | 35% |
| Massa Lubrense | 810 | $3,019 | $431.48 | 40% |
| Furore | 153 | $2,996 | $394.17 | 47% |
| Amalfi | 518 | $2,824 | $338.16 | 42% |
| Ravello | 256 | $2,646 | $344.55 | 38% |
| Sant'Agnello | 294 | $2,405 | $309.39 | 43% |
Frequently Asked Questions About Airbnb in Naples
These quick answers summarize the most common investor and operator questions using AirROI's latest market data for Naples.
How much do Airbnb hosts make in Naples?
Naples hosts earn about $14,968 per year on average, with an average nightly rate of $147 and RevPAR of $55. Those figures describe the typical revenue environment for active listings in Naples, Campania, not the ceiling for the best operators. Source: AirROI 2026 data, Naples market, July 2025 to June 2026.
What is the average Airbnb occupancy rate in Naples?
The average Airbnb occupancy rate in Naples is 37.9%. April is the strongest month and January is the softest, so hosts should expect demand to move meaningfully throughout the year rather than stay flat.
What is the average Airbnb daily rate in Naples?
Listings in Naples average $147 per night. The broader pricing spread also matters: lower-performing listings cluster closer to the lower quartiles, while premium homes can price materially above the city average when demand spikes or listing quality stands out.
How many Airbnb listings are active in Naples?
Naples currently has about 7,415 active Airbnb listings in AirROI's market dataset. That supply count helps explain how competitive the market is, how much depth there is for benchmarking, and whether the market behaves like a niche destination or a scaled urban market.
How strict are short-term rental regulations in Naples?
AirROI currently classifies the short-term rental regulation level in Naples as High. The dataset also shows about 89.2% of listings with registration evidence. That is a market signal, not legal advice, so hosts should still confirm current licensing and compliance rules locally before listing.
What is the RevPAR for Airbnb in Naples?
RevPAR in Naples is about $55. That metric combines pricing and occupancy into one efficiency number, so it is often a better quick benchmark than ADR alone when investors want to compare how well listings convert nightly rates into realized revenue.
Is Airbnb profitable in Naples?
Occupancy of 37.9% means Naples is a more selective market. Profitability is achievable but requires careful cost management, premium positioning, or targeting longer stays to reduce turnover. Average annual revenue is $14,968, but individual returns depend on property type, location within the city, and the host's operating efficiency.
How far in advance do guests book Airbnb in Naples?
The average booking lead time in Naples is about 51 days — a longer planning horizon typical of destination or vacation markets where travelers book well in advance. Hosts who understand their market's booking cadence can adjust minimum stays and pricing windows accordingly.
What are the best neighborhoods for Airbnb in Naples?
Based on AirROI's analysis, some of the top neighborhoods for short-term rentals in Naples include Chiaia, Spaccanapoli, Vomero. Each area attracts different guest profiles — from business travelers to leisure visitors — so the best location depends on the property type and target audience a host is aiming for. See the full neighborhood breakdown above.
What type of property performs best on Airbnb in Naples?
entire_home listings make up 73.5% of the active supply in Naples. The most common configuration does not always mean the most profitable — operators who identify underserved property types or bedroom counts can sometimes outperform the market average by filling a gap in local supply.
How does Naples compare to nearby Airbnb markets?
Among neighboring markets, Positano posts $70,764 in average annual revenue with 46.9% occupancy, compared to Naples's $14,968 and 37.9%. Comparing nearby markets helps investors understand whether a destination's performance reflects local demand or broader regional trends.
What is the average length of stay in Naples?
The average Airbnb stay length in Naples is about 3.8 nights. That matters for turnover, cleaning operations, and pricing strategy because shorter stays increase changeovers while longer stays can smooth occupancy and reduce operational friction.
What is the average Airbnb guest rating in Naples?
Airbnb listings in Naples average 4.75 out of 5 overall. About 27.9% of listings carry the guest favorite badge, which suggests a meaningful share of inventory is competing on review quality rather than price alone.
Which amenities boost Airbnb revenue in Naples?
Ocean view and Heating are among the strongest revenue-linked amenities in Naples. In AirROI's latest dataset, listings with these amenities outperform those without on average revenue, which makes amenities analysis useful for prioritizing investment and listing upgrades.
Do Airbnb hosts charge cleaning fees in Naples?
Yes. About 70.5% of active Airbnb listings in Naples charge a cleaning fee, and the average fee is $145. The more important operating benchmark is how much of gross revenue that fee consumes, not just the absolute dollar amount.
What percentage of Airbnb hosts are Superhosts in Naples?
At 37.2%, there is a healthy mix of experienced and newer hosts — earning Superhost status can still provide a meaningful visibility boost.
About AirROI Market Data
AirROI tracks over 20 million properties across 190+ countries and maintains 15+ years of historical performance data, making it one of the deepest Airbnb and STR intelligence platforms available. The analytics pipeline aggregates listing-level data monthly — revenue, occupancy, nightly rates, RevPAR, guest demographics, booking patterns, and competitive supply — so investors and operators can benchmark any market against its own history and against neighboring destinations.
Real estate investors, property managers, financial institutions, hedge funds, tourism boards, hospitality consultants, tech platforms, and academic researchers rely on AirROI data to underwrite acquisitions, optimize pricing, model macro trends, and conduct peer-reviewed research. Data is available through in-depth market reports like this one and the Airbnb API with 22 endpoints and an Airbnb MCP Server for AI agents.
AirROI proprietary analytics as of 2026-06-30. Metrics reflect trailing twelve-month aggregates from active listings. Revenue figures are market averages, not projections. Neighborhood descriptions are AI-generated and reviewed for accuracy. For full methodology, see the data methodology page.