La Palmilla Airbnb Market Analysis 2026: Short Term Rental Data & Vacation Rental Statistics in Baja California Sur, Mexico
Is Airbnb profitable in La Palmilla in 2026? Explore comprehensive Airbnb analytics for La Palmilla, Baja California Sur, Mexico to uncover income potential. This 2026 STR market report for La Palmilla, based on AirROI data from February 2025 to January 2026, reveals key trends in the niche market of 24 active listings.
Whether you're considering an Airbnb investment in La Palmilla, optimizing your existing vacation rental, or exploring rental arbitrage opportunities, understanding the La Palmilla Airbnb data is crucial. Leveraging the low regulation environment is key to maximizing your short term rental income potential. Let's dive into the specifics.
Key La Palmilla Airbnb Performance Metrics Overview
Monthly Airbnb Revenue Variations & Income Potential in La Palmilla (2026)
Understanding the monthly revenue variations for Airbnb listings in La Palmilla is key to maximizing your short term rental income potential. Seasonality significantly impacts earnings. Our analysis, based on data from the past 12 months, shows that the peak revenue month for STRs in La Palmilla is typically January, while September often presents the lowest earnings, highlighting opportunities for strategic pricing adjustments during shoulder and low seasons. Explore the typical Airbnb income in La Palmilla across different performance tiers:
- Best-in-class properties (Top 10%) achieve $9,917+ monthly, often utilizing dynamic pricing and superior guest experiences.
- Strong performing properties (Top 25%) earn $4,730 or more, indicating effective management and desirable locations/amenities.
- Typical properties (Median) generate around $2,259 per month, representing the average market performance.
- Entry-level properties (Bottom 25%) see earnings around $992, often with potential for optimization.
Average Monthly Airbnb Earnings Trend in La Palmilla
La Palmilla Airbnb Occupancy Rate Trends (2026)
Maximize your bookings by understanding the La Palmilla STR occupancy trends. Seasonal demand shifts significantly influence how often properties are booked. Typically, Marchsees the highest demand (peak season occupancy), while July experiences the lowest (low season). Effective strategies, like adjusting minimum stays or offering promotions, can boost occupancy during slower periods. Here's how different property tiers perform in La Palmilla:
- Best-in-class properties (Top 10%) achieve 70%+ occupancy, indicating high desirability and potentially optimized availability.
- Strong performing properties (Top 25%) maintain 47% or higher occupancy, suggesting good market fit and guest satisfaction.
- Typical properties (Median) have an occupancy rate around 29%.
- Entry-level properties (Bottom 25%) average 15% occupancy, potentially facing higher vacancy.
Average Monthly Occupancy Rate Trend in La Palmilla
Average Daily Rate (ADR) Airbnb Trends in La Palmilla (2026)
Effective short term rental pricing strategy in La Palmilla involves understanding monthly ADR fluctuations. The Average Daily Rate (ADR) for Airbnb in La Palmilla typically peaks in November and dips lowest during March. Leveraging Airbnb dynamic pricing tools or strategies based on this seasonality can significantly boost revenue. Here's a look at the typical nightly rates achieved:
- Best-in-class properties (Top 10%) command rates of $487+ per night, often due to premium features or locations.
- Strong performing properties (Top 25%) achieve nightly rates of $347 or more.
- Typical properties (Median) charge around $188 per night.
- Entry-level properties (Bottom 25%) earn around $138 per night.
Average Daily Rate (ADR) Trend by Month in La Palmilla
Get Live La Palmilla Market Intelligence 👇

Explore Real-time Analytics
Airbnb Seasonality Analysis & Trends in La Palmilla (2026)
Peak Season (January, November, May)
- Revenue averages $5,249 per month
- Occupancy rates average 37.4%
- Daily rates average $343
Shoulder Season
- Revenue averages $3,747 per month
- Occupancy maintains around 37.0%
- Daily rates hold near $338
Low Season (July, September, October)
- Revenue drops to average $2,351 per month
- Occupancy decreases to average 26.1%
- Daily rates adjust to average $342
Seasonality Insights for La Palmilla
- The Airbnb seasonality in La Palmilla shows highly seasonal trends requiring careful strategy. While the sections above show seasonal averages, it's also insightful to look at the extremes:
- During the high season, the absolute peak month showcases La Palmilla's highest earning potential, with monthly revenues capable of climbing to $6,367, occupancy reaching a high of 48.0%, and ADRs peaking at $346.
- Conversely, the slowest single month of the year, typically falling within the low season, marks the market's lowest point. In this month, revenue might dip to $1,782, occupancy could drop to 14.9%, and ADRs may adjust down to $334.
- Understanding both the seasonal averages and these monthly peaks and troughs in revenue, occupancy, and ADR is crucial for maximizing your Airbnb profit potential in La Palmilla.
Seasonal Strategies for Maximizing Profit
- Peak Season: Maximize revenue through premium pricing and potentially longer minimum stays. Ensure high availability.
- Low Season: Offer competitive pricing, special promotions (e.g., extended stay discounts), and flexible cancellation policies. Target off-season travelers like remote workers or budget-conscious guests.
- Shoulder Seasons: Implement dynamic pricing that balances peak and low rates. Target weekend travelers or specific events. Offer slightly more flexible terms than peak season.
- Regularly analyze your own performance against these La Palmilla seasonality benchmarks and adjust your pricing and availability strategy accordingly.
Best Areas for Airbnb Investment in La Palmilla (2026)
Exploring the top neighborhoods for short-term rentals in La Palmilla? This section highlights key areas, outlining why they are attractive for hosts and guests, along with notable local attractions. Consider these locations based on your target guest profile and investment strategy.
| Neighborhood / Area | Why Host Here? (Target Guests & Appeal) | Key Attractions & Landmarks |
|---|---|---|
| Cabo San Lucas | A world-renowned resort city known for its stunning beaches, vibrant nightlife, and luxury accommodations. It's a prime tourist destination with a high demand for short-term rentals. | The Arch of Cabo San Lucas, Lover's Beach, Cabo Wabo Cantina, Medano Beach, Marina Cabo San Lucas |
| San José del Cabo | A charming town with a more laid-back atmosphere compared to Cabo San Lucas, featuring art galleries, historic buildings, and beautiful beaches. Popular for family vacations and art enthusiasts. | San José Estuary, Art Walk, Historic District, Plaza Mijares, Palmilla Beach |
| Todos Santos | A picturesque town known for its arts scene and surf culture. It attracts tourists looking for a more authentic and cultural experience away from the busier tourist areas. | Hotel California, Playa de los Cerritos, Todos Santos Museum, Palm-lined streets, Local art galleries |
| La Paz | The capital of Baja California Sur, known for its stunning waterfront and beautiful natural resources. It’s increasingly becoming a popular spot for tourists seeking adventure and relaxation. | Malecon, Balandra Beach, Isla Espiritu Santo, La Paz Cathedral, Playa El Tecolote |
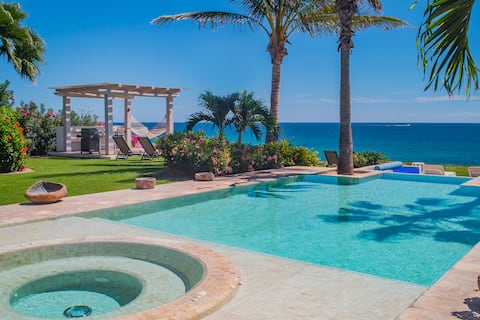
| La Palmilla Beach | A tranquil and beautiful beach area with luxury resorts and stunning ocean views. Ideal for those looking for a peaceful getaway and high-end amenities. | Palmilla Beach, Los Cabos Golf Club, Resort spas, Fine dining, Water sports |
| East Cape | Less developed and more serene than Cabo. It offers stunning beaches and a chance to experience nature. Popular with eco-tourists and those seeking outdoor adventures. | El Cardonal beach, Las Palmas beach, Cabo Pulmo National Park, Surfing and fishing spots, Desert landscapes |
| Pueblo Bonito Sunset Beach | A luxurious resort area offering beautiful views of the Pacific Ocean and excellent amenities. A favorite for travelers seeking relaxation and upscale experiences. | Sunset Beach, Spa services, Fine dining restaurants, Infinity pools, Private beach access |
| Mision de Loreto | A charming and less touristy destination that offers cultural experiences, beautiful landscapes, and proximity to National Parks. Attracts visitors looking for a more authentic Baja experience. | Loreto Bay National Park, Mission San Javier, Local seafood restaurants, Diving and kayaking spots, Historical sites |
Understanding Airbnb License Requirements & STR Laws in La Palmilla (2026)
While La Palmilla, Baja California Sur, Mexico currently shows low STR regulations, specific Airbnb license requirements might still exist or change. Always verify the latest short term rental regulations and Airbnb license requirements directly with local government authorities for La Palmilla to ensure full compliance before hosting.
(Source: AirROI data, 2026, finding no licensed listings among those analyzed)
Top Performing Airbnb Properties in La Palmilla (2026)
Benchmark your potential! Explore examples of top-performing Airbnb properties in La Palmillabased on Trailing Twelve Month (TTM) revenue. Analyze their characteristics, revenue, occupancy rate, and ADR to understand what drives success in this market.
Casa Piedra Blanca
Entire Place • 5 bedrooms
COASTAL HOUSE * Dream-like Beachfront Escape *
Entire Place • 2 bedrooms
Casa Moonshine 2 casitas, private pool, AC
Entire Place • 2 bedrooms
Casa Rosa Nautica
Entire Place • 2 bedrooms
Baja Hacienda with Stunning Views and a Lap Pool
Entire Place • 2 bedrooms
8 Horizons, panoramic view home on the East Cape.
Entire Place • 2 bedrooms
Note: Performance varies based on location, size, amenities, seasonality, and management quality. Data reflects the past 12 months.
Top Performing Airbnb Hosts in La Palmilla (2026)
Learn from the best! This table showcases top-performing Airbnb hosts in La Palmilla based on the number of properties managed and estimated total revenue over the past year. Analyze their scale and performance metrics.
| Host Name | Properties | Grossing Revenue | Stay Reviews | Avg Rating |
|---|---|---|---|---|
| Francisco | 1 | $121,207 | 3 | 5.00/5.0 |
| Susan | 2 | $88,910 | 23 | 4.92/5.0 |
| Tyler | 2 | $75,522 | 40 | 4.93/5.0 |
| Michael | 1 | $47,116 | 11 | 5.00/5.0 |
| Poli | 3 | $39,880 | 79 | 4.82/5.0 |
| Michelle | 1 | $39,756 | 78 | 4.94/5.0 |
| Phillip | 1 | $32,646 | 10 | 4.70/5.0 |
| Casa Namaste | 1 | $29,192 | 46 | 4.89/5.0 |
| Paul | 3 | $23,965 | 105 | 4.95/5.0 |
| Gloria | 2 | $19,625 | 15 | 5.00/5.0 |
Analyzing the strategies of top hosts, such as their property selection, pricing, and guest communication, can offer valuable lessons for optimizing your own Airbnb operations in La Palmilla.
Dive Deeper: Advanced La Palmilla STR Market Data (2026)
Ready to unlock more insights? AirROI provides access to advanced metrics and comprehensive Airbnb data for La Palmilla. Explore detailed analytics beyond this report to refine your investment strategy, optimize pricing, and maximize your vacation rental profits.
Explore Advanced MetricsLa Palmilla Short-Term Rental Market Composition (2026): Property & Room Types
Room Type Distribution
Property Type Distribution
Market Composition Insights for La Palmilla
- The La Palmilla Airbnb market composition is heavily skewed towards Entire Home/Apt listings, which make up 100% of the 24 active rentals. This indicates strong guest preference for privacy and space.
- Looking at the property type distribution in La Palmilla, House properties are the most common (79.2%), reflecting the local real estate landscape.
- Houses represent a significant 79.2% portion, catering likely to families or larger groups.
- The presence of 16.7% Hotel/Boutique listings indicates integration with traditional hospitality.
- Smaller segments like others (combined 4.2%) offer potential for unique stay experiences.
La Palmilla Airbnb Room Capacity Analysis (2026): Bedroom Distribution
Distribution of Listings by Number of Bedrooms
Room Capacity Insights for La Palmilla
- The dominant room capacity in La Palmilla is 1 bedroom listings, making up 45.8% of the market. This suggests a strong demand for properties suitable for couples or solo travelers.
- Together, 1 bedroom and 2 bedrooms properties represent 75.0% of the active Airbnb listings in La Palmilla, indicating a high concentration in these sizes.
- A significant 25.0% of listings offer 3+ bedrooms, catering to larger groups and families seeking more space in La Palmilla.
La Palmilla Vacation Rental Guest Capacity Trends (2026)
Distribution of Listings by Guest Capacity
Guest Capacity Insights for La Palmilla
- The most common guest capacity trend in La Palmilla vacation rentals is listings accommodating 2 guests (45.8%). This suggests the primary traveler segment is likely couples or solo travelers.
- Properties designed for 2 guests and 6 guests dominate the La Palmilla STR market, accounting for 62.5% of listings.
- A significant 45.8% of listings cater specifically to 1-2 guests, highlighting strong demand from couples and solo travelers in La Palmilla.
- 29.2% of properties accommodate 6+ guests, serving the market segment for larger families or group travel in La Palmilla.
- On average, properties in La Palmilla are equipped to host 4.0 guests.
La Palmilla Airbnb Booking Patterns (2026): Available vs. Booked Days
Available Days Distribution
Booked Days Distribution
Booking Pattern Insights for La Palmilla
- The most common availability pattern in La Palmilla falls within the 271-366 days range, representing 62.5% of listings. This suggests many properties have significant open periods on their calendars.
- Approximately 100.0% of listings show high availability (181+ days open annually), indicating potential for increased bookings or specific owner usage patterns.
- For booked days, the 1-30 days range is most frequent in La Palmilla (45.8%), reflecting common guest stay durations or potential owner blocking patterns.
La Palmilla Airbnb Minimum Stay Requirements Analysis
Distribution of Listings by Minimum Night Requirement
2 Nights
5 listings
20.8% of total
3 Nights
5 listings
20.8% of total
4-6 Nights
4 listings
16.7% of total
7-29 Nights
1 listings
4.2% of total
30+ Nights
9 listings
37.5% of total
Key Insights
- The most prevalent minimum stay requirement in La Palmilla is 30+ Nights, adopted by 37.5% of listings. This highlights the market's preference for longer commitments.
- A significant segment (37.5%) caters to monthly stays (30+ nights) in La Palmilla, pointing to opportunities in the extended-stay market.
Recommendations
- Align with the market by considering a 30+ Nights minimum stay, as 37.5% of La Palmilla hosts use this setting.
- Explore offering discounts for stays of 30+ nights to attract the 37.5% of the market seeking extended stays.
- Adjust minimum nights based on seasonality – potentially shorter during low season and longer during peak demand periods in La Palmilla.
La Palmilla Airbnb Cancellation Policy Trends Analysis (2026)
Flexible
1 listings
4.2% of total
Moderate
4 listings
16.7% of total
Firm
14 listings
58.3% of total
Strict
5 listings
20.8% of total
Cancellation Policy Insights for La Palmilla
- The prevailing Airbnb cancellation policy trend in La Palmilla is Firm, used by 58.3% of listings.
- A majority (79.1%) of hosts in La Palmilla utilize Firm or Strict policies, indicating a market where hosts prioritize booking security.
Recommendations for Hosts
- Consider adopting a Firm policy to align with the 58.3% market standard in La Palmilla.
- Regularly review your cancellation policy against competitors and market demand shifts in La Palmilla.
La Palmilla STR Booking Lead Time Analysis (2026)
Average Booking Lead Time by Month
Booking Lead Time Insights for La Palmilla
- The overall average booking lead time for vacation rentals in La Palmilla is 69 days.
- Guests book furthest in advance for stays during May (average 116 days), likely coinciding with peak travel demand or local events.
- The shortest booking windows occur for stays in September (average 9 days), indicating more last-minute travel plans during this time.
- Seasonally, Spring (89 days avg.) sees the longest lead times, while Fall (43 days avg.) has the shortest, reflecting typical travel planning cycles.
Recommendations for Hosts
- Use the overall average lead time (69 days) as a baseline for your pricing and availability strategy in La Palmilla.
- For May stays, consider implementing length-of-stay discounts or slightly higher rates for bookings made less than 116 days out to capitalize on advance planning.
- During September, focus on last-minute booking availability and promotions, as guests book with very short notice (9 days avg.).
- Target marketing efforts for the Spring season well in advance (at least 89 days) to capture early planners.
- Monitor your own booking lead times against these La Palmilla averages to identify opportunities for dynamic pricing adjustments.
Popular & Essential Airbnb Amenities in La Palmilla (2026)
Amenity Prevalence
Amenity Insights for La Palmilla
- Essential amenities in La Palmilla that guests expect include: Kitchen, Hot water, Free parking on premises, Wifi. Lacking these (any) could significantly impact bookings.
- Popular amenities like Essentials, Coffee maker, Cooking basics are common but not universal. Offering these can provide a competitive edge.
Recommendations for Hosts
- Ensure your listing includes all essential amenities for La Palmilla: Kitchen, Hot water, Free parking on premises, Wifi.
- Prioritize adding missing essentials: Wifi.
- Consider adding popular differentiators like Essentials or Coffee maker to increase appeal.
- Highlight unique or less common amenities you offer (e.g., hot tub, dedicated workspace, EV charger) in your listing description and photos.
- Regularly check competitor amenities in La Palmilla to stay competitive.
La Palmilla Airbnb Guest Demographics & Profile Analysis (2026)
Guest Profile Summary for La Palmilla
- The typical guest profile for Airbnb in La Palmilla consists of predominantly international visitors (96%), with top international origins including Canada, typically belonging to the Post-2000s (Gen Z/Alpha) group (50%), primarily speaking English or Spanish.
- Domestic travelers account for 4.4% of guests.
- Key international markets include United States (84.4%) and Canada (11.1%).
- Top languages spoken are English (85.7%) followed by Spanish (7.1%).
- A significant demographic segment is the Post-2000s (Gen Z/Alpha) group, representing 50% of guests.
Recommendations for Hosts
- Focus marketing internationally, particularly towards travelers from Canada.
- Tailor amenities and listing descriptions to appeal to the dominant Post-2000s (Gen Z/Alpha) demographic (e.g., highlight fast WiFi, smart home features, local guides).
- Highlight unique local experiences or amenities relevant to the primary guest profile.
- Consider seasonal promotions aligned with peak travel times for key origin markets.
Nearby Short-Term Rental Market Comparison
How does the La Palmilla Airbnb market stack up against its neighbors? Compare key performance metrics like average monthly revenue, ADR, and occupancy rates in surrounding areas to understand the broader regional STR landscape.
| Market | Active Properties | Monthly Revenue | Daily Rate | Avg. Occupancy |
|---|---|---|---|---|
| Cabo Frailes | 13 | $3,598 | $678.93 | 30% |
| La Ribera | 37 | $3,328 | $488.20 | 33% |
| Cabo San Lucas | 2,708 | $2,575 | $392.18 | 34% |
| San José del Cabo | 1,249 | $2,428 | $384.50 | 34% |
| Los Cerritos | 44 | $2,061 | $277.09 | 32% |
| Todos Santos | 460 | $1,988 | $271.64 | 34% |
| El Tezal | 360 | $1,949 | $200.75 | 40% |
| Baja California Sur | 38 | $1,944 | $346.99 | 27% |
| La Boca de la Palma | 20 | $1,731 | $240.57 | 29% |
| Los Barriles | 172 | $1,663 | $256.08 | 35% |