La Joya Airbnb Market Analysis 2026: Short Term Rental Data & Vacation Rental Statistics in Baja California, Mexico
Is Airbnb profitable in La Joya in 2026? Explore comprehensive Airbnb analytics for La Joya, Baja California, Mexico to uncover income potential. This 2026 STR market report for La Joya, based on AirROI data from December 2024 to November 2025, reveals key trends in the niche market of 19 active listings.
Whether you're considering an Airbnb investment in La Joya, optimizing your existing vacation rental, or exploring rental arbitrage opportunities, understanding the La Joya Airbnb data is crucial. Leveraging the low regulation environment is key to maximizing your short term rental income potential. Let's dive into the specifics.
Key La Joya Airbnb Performance Metrics Overview
Monthly Airbnb Revenue Variations & Income Potential in La Joya (2026)
Understanding the monthly revenue variations for Airbnb listings in La Joya is key to maximizing your short term rental income potential. Seasonality significantly impacts earnings. Our analysis, based on data from the past 12 months, shows that the peak revenue month for STRs in La Joya is typically May, while November often presents the lowest earnings, highlighting opportunities for strategic pricing adjustments during shoulder and low seasons. Explore the typical Airbnb income in La Joya across different performance tiers:
- Best-in-class properties (Top 10%) achieve $1,620+ monthly, often utilizing dynamic pricing and superior guest experiences.
- Strong performing properties (Top 25%) earn $1,204 or more, indicating effective management and desirable locations/amenities.
- Typical properties (Median) generate around $764 per month, representing the average market performance.
- Entry-level properties (Bottom 25%) see earnings around $390, often with potential for optimization.
Average Monthly Airbnb Earnings Trend in La Joya
La Joya Airbnb Occupancy Rate Trends (2026)
Maximize your bookings by understanding the La Joya STR occupancy trends. Seasonal demand shifts significantly influence how often properties are booked. Typically, Maysees the highest demand (peak season occupancy), while November experiences the lowest (low season). Effective strategies, like adjusting minimum stays or offering promotions, can boost occupancy during slower periods. Here's how different property tiers perform in La Joya:
- Best-in-class properties (Top 10%) achieve 77%+ occupancy, indicating high desirability and potentially optimized availability.
- Strong performing properties (Top 25%) maintain 65% or higher occupancy, suggesting good market fit and guest satisfaction.
- Typical properties (Median) have an occupancy rate around 43%.
- Entry-level properties (Bottom 25%) average 27% occupancy, potentially facing higher vacancy.
Average Monthly Occupancy Rate Trend in La Joya
Average Daily Rate (ADR) Airbnb Trends in La Joya (2026)
Effective short term rental pricing strategy in La Joya involves understanding monthly ADR fluctuations. The Average Daily Rate (ADR) for Airbnb in La Joya typically peaks in November and dips lowest during April. Leveraging Airbnb dynamic pricing tools or strategies based on this seasonality can significantly boost revenue. Here's a look at the typical nightly rates achieved:
- Best-in-class properties (Top 10%) command rates of $119+ per night, often due to premium features or locations.
- Strong performing properties (Top 25%) achieve nightly rates of $81 or more.
- Typical properties (Median) charge around $57 per night.
- Entry-level properties (Bottom 25%) earn around $35 per night.
Average Daily Rate (ADR) Trend by Month in La Joya
Get Live La Joya Market Intelligence 👇

Explore Real-time Analytics
Airbnb Seasonality Analysis & Trends in La Joya (2025)
Peak Season (May, March, February)
- Revenue averages $1,001 per month
- Occupancy rates average 56.1%
- Daily rates average $71
Shoulder Season
- Revenue averages $870 per month
- Occupancy maintains around 47.6%
- Daily rates hold near $75
Low Season (July, September, November)
- Revenue drops to average $656 per month
- Occupancy decreases to average 34.2%
- Daily rates adjust to average $79
Seasonality Insights for La Joya
- The Airbnb seasonality in La Joya shows moderate seasonality with distinct peak and low periods. While the sections above show seasonal averages, it's also insightful to look at the extremes:
- During the high season, the absolute peak month showcases La Joya's highest earning potential, with monthly revenues capable of climbing to $1,025, occupancy reaching a high of 58.9%, and ADRs peaking at $83.
- Conversely, the slowest single month of the year, typically falling within the low season, marks the market's lowest point. In this month, revenue might dip to $567, occupancy could drop to 29.2%, and ADRs may adjust down to $70.
- Understanding both the seasonal averages and these monthly peaks and troughs in revenue, occupancy, and ADR is crucial for maximizing your Airbnb profit potential in La Joya.
Seasonal Strategies for Maximizing Profit
- Peak Season: Maximize revenue through premium pricing and potentially longer minimum stays. Ensure high availability.
- Low Season: Offer competitive pricing, special promotions (e.g., extended stay discounts), and flexible cancellation policies. Target off-season travelers like remote workers or budget-conscious guests.
- Shoulder Seasons: Implement dynamic pricing that balances peak and low rates. Target weekend travelers or specific events. Offer slightly more flexible terms than peak season.
- Regularly analyze your own performance against these La Joya seasonality benchmarks and adjust your pricing and availability strategy accordingly.
Best Areas for Airbnb Investment in La Joya (2026)
Exploring the top neighborhoods for short-term rentals in La Joya? This section highlights key areas, outlining why they are attractive for hosts and guests, along with notable local attractions. Consider these locations based on your target guest profile and investment strategy.
| Neighborhood / Area | Why Host Here? (Target Guests & Appeal) | Key Attractions & Landmarks |
|---|---|---|
| La Joya Beach | Beautiful beachfront area known for its calm waters and stunning sunsets, ideal for vacationers seeking relaxation and outdoor activities. | La Joya Beach, Puerto Escondido, Surfing spots, Beachfront restaurants, Water sports rentals |
| Cacao Park | A residential area surrounded by nature, offering a tranquil setting close to amenities. Attracts families and eco-tourists looking for a peaceful retreat. | Cacao Park, Nature trails, Local markets, Craft shops, Agricultural tours |
| La Joya Village | A charming community with local shops and restaurants, perfect for those who want to experience authentic Mexican culture while being close to the beach. | Local food market, Artisan shops, Cultural festivals, Community events, Restaurants featuring local cuisine |
| Cerro del Chiquihuite | A scenic area offering panoramic views and hiking opportunities. A great choice for nature lovers and adventurous travelers. | Hiking trails, Viewpoints, Outdoor activities, Nature photography, Wildlife watching |
| Marina La Joya | A luxurious marina area known for its upscale condos and accessibility to water activities, attracting wealthy travelers and yachting enthusiasts. | Luxury yacht rentals, Fine dining restaurants, Waterfront boardwalk, Fishing tours, Sailing excursions |
| Laguna Salada | A unique saline lagoon that attracts those interested in nature, photography, and bird watching. Suitable for eco-tourism. | Bird watching, Nature photography, Kayaking, Wildlife observation, Unique landscape |
| San Vicente | A growing neighborhood with new developments and easy access to nearby attractions. Ideal for travelers looking for convenience and proximity to urban areas. | Shopping centers, Local eateries, Public parks, Cultural venues, Transport links |
| Eco-Tourism Resort Area | Focuses on sustainable tourism, appealing to environmentally conscious travelers. Offers lodging integrated with nature and eco-friendly activities. | Sustainable lodges, Eco-friendly tours, Nature hikes, Organic farms, Campsites |
Understanding Airbnb License Requirements & STR Laws in La Joya (2026)
While La Joya, Baja California, Mexico currently shows low STR regulations, specific Airbnb license requirements might still exist or change. Always verify the latest short term rental regulations and Airbnb license requirements directly with local government authorities for La Joya to ensure full compliance before hosting.
(Source: AirROI data, 2026, finding no licensed listings among those analyzed)
Top Performing Airbnb Properties in La Joya (2026)
Benchmark your potential! Explore examples of top-performing Airbnb properties in La Joyabased on Trailing Twelve Month (TTM) revenue. Analyze their characteristics, revenue, occupancy rate, and ADR to understand what drives success in this market.
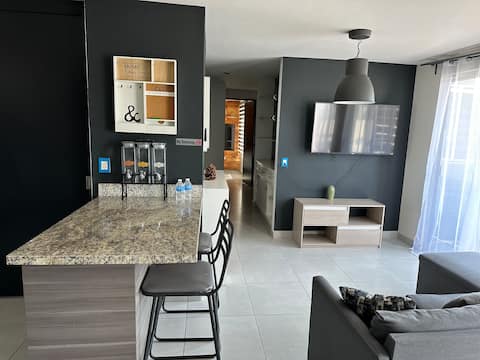
Comfortable 3-Bedroom Apartment-15 minutes Airport
Entire Place • 3 bedrooms

Spacious 3-Bedroom in Secure Gated Community
Entire Place • 3 bedrooms
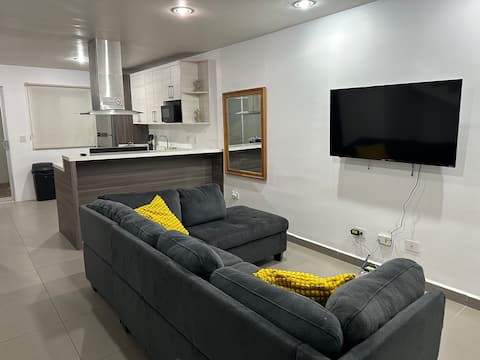
Cozy 2BR House, A/C, 2.5 Baths, Patio, Gated Area
Entire Place • 2 bedrooms

Prívate Gate Stay, w/ AC & 50" TV, 2-Bedroom
Entire Place • 2 bedrooms

Olivia's Place •
Entire Place • 2 bedrooms

‼️Cuyamaca Mia Home - Free Parking‼️
Entire Place • 2 bedrooms
Note: Performance varies based on location, size, amenities, seasonality, and management quality. Data reflects the past 12 months.
Top Performing Airbnb Hosts in La Joya (2026)
Learn from the best! This table showcases top-performing Airbnb hosts in La Joya based on the number of properties managed and estimated total revenue over the past year. Analyze their scale and performance metrics.
| Host Name | Properties | Grossing Revenue | Stay Reviews | Avg Rating |
|---|---|---|---|---|
| René | 4 | $60,267 | 143 | 4.67/5.0 |
| Liliana | 3 | $25,319 | 208 | 4.81/5.0 |
| Zenia | 3 | $12,515 | 53 | 4.80/5.0 |
| Martin | 1 | $10,010 | 11 | 4.73/5.0 |
| Michel | 1 | $8,105 | 33 | 4.97/5.0 |
| Vicky | 2 | $6,233 | 60 | 4.81/5.0 |
| Miranda | 1 | $5,760 | 10 | 4.70/5.0 |
| Maximino | 3 | $2,717 | 29 | 4.63/5.0 |
| Patricio Estrada | 1 | $1,251 | 19 | 4.95/5.0 |
Analyzing the strategies of top hosts, such as their property selection, pricing, and guest communication, can offer valuable lessons for optimizing your own Airbnb operations in La Joya.
Dive Deeper: Advanced La Joya STR Market Data (2026)
Ready to unlock more insights? AirROI provides access to advanced metrics and comprehensive Airbnb data for La Joya. Explore detailed analytics beyond this report to refine your investment strategy, optimize pricing, and maximize your vacation rental profits.
Explore Advanced MetricsLa Joya Short-Term Rental Market Composition (2026): Property & Room Types
Room Type Distribution
Property Type Distribution
Market Composition Insights for La Joya
- The La Joya Airbnb market composition is heavily skewed towards Entire Home/Apt listings, which make up 78.9% of the 19 active rentals. This indicates strong guest preference for privacy and space.
- Looking at the property type distribution in La Joya, Apartment/Condo properties are the most common (63.2%), reflecting the local real estate landscape.
- Houses represent a significant 36.8% portion, catering likely to families or larger groups.
La Joya Airbnb Room Capacity Analysis (2026): Bedroom Distribution
Distribution of Listings by Number of Bedrooms
Room Capacity Insights for La Joya
- The dominant room capacity in La Joya is 2 bedrooms listings, making up 42.1% of the market. This suggests a strong demand for properties suitable for couples or solo travelers.
- Together, 2 bedrooms and 1 bedroom properties represent 68.4% of the active Airbnb listings in La Joya, indicating a high concentration in these sizes.
La Joya Vacation Rental Guest Capacity Trends (2026)
Distribution of Listings by Guest Capacity
Guest Capacity Insights for La Joya
- The most common guest capacity trend in La Joya vacation rentals is listings accommodating 5 guests (26.3%). This suggests the primary traveler segment is likely larger groups.
- Properties designed for 5 guests and 3 guests dominate the La Joya STR market, accounting for 42.1% of listings.
- 21.0% of properties accommodate 6+ guests, serving the market segment for larger families or group travel in La Joya.
- On average, properties in La Joya are equipped to host 3.8 guests.
La Joya Airbnb Booking Patterns (2026): Available vs. Booked Days
Available Days Distribution
Booked Days Distribution
Booking Pattern Insights for La Joya
- The most common availability pattern in La Joya falls within the 271-366 days range, representing 42.1% of listings. This suggests many properties have significant open periods on their calendars.
- Approximately 73.7% of listings show high availability (181+ days open annually), indicating potential for increased bookings or specific owner usage patterns.
- For booked days, the 181-270 days range is most frequent in La Joya (36.8%), reflecting common guest stay durations or potential owner blocking patterns.
- A notable 36.8% of properties secure long booking periods (181+ days booked per year), highlighting successful long-term rental strategies or significant owner usage.
La Joya Airbnb Minimum Stay Requirements Analysis
Distribution of Listings by Minimum Night Requirement
1 Night
13 listings
68.4% of total
2 Nights
1 listings
5.3% of total
7-29 Nights
1 listings
5.3% of total
30+ Nights
4 listings
21.1% of total
Key Insights
- The most prevalent minimum stay requirement in La Joya is 1 Night, adopted by 68.4% of listings. This highlights the market's preference for shorter, flexible bookings.
- A strong majority (73.7%) of the La Joya Airbnb data shows acceptance of very short stays (1-2 nights), indicating a dynamic, high-turnover market.
- A significant segment (21.1%) caters to monthly stays (30+ nights) in La Joya, pointing to opportunities in the extended-stay market.
Recommendations
- Align with the market by considering a 1 Night minimum stay, as 68.4% of La Joya hosts use this setting.
- Explore offering discounts for stays of 30+ nights to attract the 21.1% of the market seeking extended stays.
- Adjust minimum nights based on seasonality – potentially shorter during low season and longer during peak demand periods in La Joya.
La Joya Airbnb Cancellation Policy Trends Analysis (2026)
Limited
1 listings
5.3% of total
Flexible
9 listings
47.4% of total
Moderate
1 listings
5.3% of total
Firm
3 listings
15.8% of total
Strict
5 listings
26.3% of total
Cancellation Policy Insights for La Joya
- The prevailing Airbnb cancellation policy trend in La Joya is Flexible, used by 47.4% of listings.
- There's a relatively balanced mix between guest-friendly (52.7%) and stricter (42.1%) policies, offering choices for different guest needs.
Recommendations for Hosts
- Consider adopting a Flexible policy to align with the 47.4% market standard in La Joya.
- Regularly review your cancellation policy against competitors and market demand shifts in La Joya.
La Joya STR Booking Lead Time Analysis (2026)
Average Booking Lead Time by Month
Booking Lead Time Insights for La Joya
- The overall average booking lead time for vacation rentals in La Joya is 10 days.
- Guests book furthest in advance for stays during August (average 28 days), likely coinciding with peak travel demand or local events.
- The shortest booking windows occur for stays in November (average 3 days), indicating more last-minute travel plans during this time.
- Seasonally, Summer (17 days avg.) sees the longest lead times, while Spring (6 days avg.) has the shortest, reflecting typical travel planning cycles.
Recommendations for Hosts
- Use the overall average lead time (10 days) as a baseline for your pricing and availability strategy in La Joya.
- For August stays, consider implementing length-of-stay discounts or slightly higher rates for bookings made less than 28 days out to capitalize on advance planning.
- Target marketing efforts for the Summer season well in advance (at least 17 days) to capture early planners.
- Monitor your own booking lead times against these La Joya averages to identify opportunities for dynamic pricing adjustments.
Popular & Essential Airbnb Amenities in La Joya (2026)
Amenity Prevalence
Amenity Insights for La Joya
- Essential amenities in La Joya that guests expect include: Wifi, TV. Lacking these (any) could significantly impact bookings.
- Popular amenities like Iron, Kitchen, Cooking basics are common but not universal. Offering these can provide a competitive edge.
Recommendations for Hosts
- Ensure your listing includes all essential amenities for La Joya: Wifi, TV.
- Consider adding popular differentiators like Iron or Kitchen to increase appeal.
- Highlight unique or less common amenities you offer (e.g., hot tub, dedicated workspace, EV charger) in your listing description and photos.
- Regularly check competitor amenities in La Joya to stay competitive.
La Joya Airbnb Guest Demographics & Profile Analysis (2026)
Guest Profile Summary for La Joya
- The typical guest profile for Airbnb in La Joya consists of a mix of domestic (52%) and international guests, often arriving from nearby Tijuana, typically belonging to the Post-2000s (Gen Z/Alpha) group (50%), primarily speaking Spanish or English.
- Domestic travelers account for 52.2% of guests.
- Key international markets include Mexico (52.2%) and United States (43.3%).
- Top languages spoken are Spanish (48.9%) followed by English (44.6%).
- A significant demographic segment is the Post-2000s (Gen Z/Alpha) group, representing 50% of guests.
Recommendations for Hosts
- Balance marketing efforts between domestic and international channels based on the guest mix.
- Tailor amenities and listing descriptions to appeal to the dominant Post-2000s (Gen Z/Alpha) demographic (e.g., highlight fast WiFi, smart home features, local guides).
- Highlight unique local experiences or amenities relevant to the primary guest profile.
- Consider seasonal promotions aligned with peak travel times for key origin markets.
Nearby Short-Term Rental Market Comparison
How does the La Joya Airbnb market stack up against its neighbors? Compare key performance metrics like average monthly revenue, ADR, and occupancy rates in surrounding areas to understand the broader regional STR landscape.
| Market | Active Properties | Monthly Revenue | Daily Rate | Avg. Occupancy |
|---|---|---|---|---|
| Rancho San Diego | 26 | $9,161 | $592.62 | 49% |
| Newport Beach | 1,251 | $9,049 | $746.08 | 47% |
| Thousand Palms | 33 | $8,936 | $779.13 | 38% |
| Manhattan Beach | 265 | $8,198 | $593.14 | 53% |
| Lakeside | 31 | $7,949 | $643.14 | 43% |
| La Palma | 11 | $7,783 | $391.32 | 56% |
| Bermuda Dunes | 140 | $7,681 | $659.22 | 40% |
| GlenOak Hills | 41 | $7,657 | $664.33 | 40% |
| Del Mar | 119 | $7,452 | $654.32 | 46% |
| Mount Helix | 35 | $7,058 | $586.50 | 49% |