San Luis Airbnb Market Analysis 2025: Short Term Rental Data & Vacation Rental Statistics in Baja California, Mexico
Is Airbnb profitable in San Luis in 2025? Explore comprehensive Airbnb analytics for San Luis, Baja California, Mexico to uncover income potential. This 2025 STR market report for San Luis, based on AirROI data from April 2024 to March 2025, reveals key trends in the niche market of 18 active listings.
Whether you're considering an Airbnb investment in San Luis, optimizing your existing vacation rental, or exploring rental arbitrage opportunities, understanding the San Luis Airbnb data is crucial. Leveraging the low regulation environment is key to maximizing your short term rental income potential. Let's dive into the specifics.
Key San Luis Airbnb Performance Metrics Overview
Monthly Airbnb Revenue Variations & Income Potential in San Luis (2025)
Understanding the monthly revenue variations for Airbnb listings in San Luis is key to maximizing your short term rental income potential. Seasonality significantly impacts earnings. Our analysis, based on data from the past 12 months, shows that the peak revenue month for STRs in San Luis is typically May, while November often presents the lowest earnings, highlighting opportunities for strategic pricing adjustments during shoulder and low seasons. Explore the typical Airbnb income in San Luis across different performance tiers:
- Best-in-class properties (Top 10%) achieve $1,869+ monthly, often utilizing dynamic pricing and superior guest experiences.
- Strong performing properties (Top 25%) earn $934 or more, indicating effective management and desirable locations/amenities.
- Typical properties (Median) generate around $715 per month, representing the average market performance.
- Entry-level properties (Bottom 25%) see earnings around $515, often with potential for optimization.
Average Monthly Airbnb Earnings Trend in San Luis
San Luis Airbnb Occupancy Rate Trends (2025)
Maximize your bookings by understanding the San Luis STR occupancy trends. Seasonal demand shifts significantly influence how often properties are booked. Typically, Julysees the highest demand (peak season occupancy), while May experiences the lowest (low season). Effective strategies, like adjusting minimum stays or offering promotions, can boost occupancy during slower periods. Here's how different property tiers perform in San Luis:
- Best-in-class properties (Top 10%) achieve 45%+ occupancy, indicating high desirability and potentially optimized availability.
- Strong performing properties (Top 25%) maintain 42% or higher occupancy, suggesting good market fit and guest satisfaction.
- Typical properties (Median) have an occupancy rate around 27%.
- Entry-level properties (Bottom 25%) average 18% occupancy, potentially facing higher vacancy.
Average Monthly Occupancy Rate Trend in San Luis
Average Daily Rate (ADR) Airbnb Trends in San Luis (2025)
Effective short term rental pricing strategy in San Luis involves understanding monthly ADR fluctuations. The Average Daily Rate (ADR) for Airbnb in San Luis typically peaks in February and dips lowest during November. Leveraging Airbnb dynamic pricing tools or strategies based on this seasonality can significantly boost revenue. Here's a look at the typical nightly rates achieved:
- Best-in-class properties (Top 10%) command rates of $118+ per night, often due to premium features or locations.
- Strong performing properties (Top 25%) achieve nightly rates of $69 or more.
- Typical properties (Median) charge around $51 per night.
- Entry-level properties (Bottom 25%) earn around $40 per night.
Average Daily Rate (ADR) Trend by Month in San Luis
Get Live San Luis Market Intelligence 👇

Explore Real-time Analytics
Airbnb Seasonality Analysis & Trends in San Luis (2025)
Peak Season (May, April, June)
- Revenue averages $1,287 per month
- Occupancy rates average 23.0%
- Daily rates average $61
Shoulder Season
- Revenue averages $815 per month
- Occupancy maintains around 32.0%
- Daily rates hold near $63
Low Season (September, October, November)
- Revenue drops to average $443 per month
- Occupancy decreases to average 29.3%
- Daily rates adjust to average $59
Seasonality Insights for San Luis
- The Airbnb seasonality in San Luis shows highly seasonal trends requiring careful strategy. While the sections above show seasonal averages, it's also insightful to look at the extremes:
- During the high season, the absolute peak month showcases San Luis's highest earning potential, with monthly revenues capable of climbing to $1,319, occupancy reaching a high of 43.2%, and ADRs peaking at $71.
- Conversely, the slowest single month of the year, typically falling within the low season, marks the market's lowest point. In this month, revenue might dip to $252, occupancy could drop to 12.9%, and ADRs may adjust down to $57.
- Understanding both the seasonal averages and these monthly peaks and troughs in revenue, occupancy, and ADR is crucial for maximizing your Airbnb profit potential in San Luis.
Seasonal Strategies for Maximizing Profit
- Peak Season: Maximize revenue through premium pricing and potentially longer minimum stays. Ensure high availability.
- Low Season: Offer competitive pricing, special promotions (e.g., extended stay discounts), and flexible cancellation policies. Target off-season travelers like remote workers or budget-conscious guests.
- Shoulder Seasons: Implement dynamic pricing that balances peak and low rates. Target weekend travelers or specific events. Offer slightly more flexible terms than peak season.
- Regularly analyze your own performance against these San Luis seasonality benchmarks and adjust your pricing and availability strategy accordingly.
Best Areas for Airbnb Investment in San Luis (2025)
Exploring the top neighborhoods for short-term rentals in San Luis? This section highlights key areas, outlining why they are attractive for hosts and guests, along with notable local attractions. Consider these locations based on your target guest profile and investment strategy.
| Neighborhood / Area | Why Host Here? (Target Guests & Appeal) | Key Attractions & Landmarks |
|---|---|---|
| Playas de Tijuana | Popular beach area located just south of the U.S. border, known for its picturesque coast, vibrant nightlife, and accessibility. Ideal for vacationers from California looking for sun and fun. | Playas de Tijuana Beach, Plaza del Pacifico, Estadio Tijuana, El Popo, Tijuana's vibrant nightlife |
| Rosarito Beach | A well-known beach resort town famous for its beautiful beaches and vibrant culture. It's a favored destination for both local and international tourists, particularly during the summer months. | Rosarito Beach, Puerto Nuevo Lobster Village, Rosarito Art Fest, Cultural Center, Lighthouse |
| Ensenada | A major coastal city known for its wine country and seafood. It's a hub for cruise ships and attracts tourists who seek adventure and taste the rich culinary offerings. | La Bufadora, Winery tours, Ensenada's Fish Market, Cultural Center of Ensenada, Malecón |
| San Felipe | A quieter beach town known for its stunning sunsets and laid-back atmosphere. It's perfect for travelers looking for a peaceful retreat away from the crowds. | San Felipe Beach, Puertecitos, Hiking in the Sierra de San Pedro Martir, Dune buggies in the desert, Diving and snorkeling opportunities |
| Tecate | A charming town known for its beer and beautiful mountain scenery. Great for tourists who are interested in beer tasting and outdoor adventures. | Tecate Beer Factory, Cerro Cuchumá, Tecate's traditional town square, Wine tasting in nearby Valle de Guadalupe, Local artisan food shops |
| Valle de Guadalupe | Baja California's famous wine region offering beautiful vineyards and wine tasting experiences. Perfect for tourists who enjoy gourmet dining and local culture. | Wine wineries, Gourmet restaurants, Finca La Carrodilla, Caminos de Vino wine tour, Art galleries |
| La Mission | A scenic beach area that offers a more remote feel, popular for its natural beauty and tranquility. Ideal for visitors looking for relaxation and nature. | La Mission Beach, San Miguelito Beach, Natural hot springs, hiking trails, Peaceful beaches |
| Tecate Hot Springs | Known for its relaxing hot springs and natural beauty, which attract wellness tourists looking to unwind and rejuvenate. | Hot springs resorts, Spa facilities, Nature trails, Relaxation spots., Mountain views |
Understanding Airbnb License Requirements & STR Laws in San Luis (2025)
While San Luis, Baja California, Mexico currently shows low STR regulations, specific Airbnb license requirements might still exist or change. Always verify the latest short term rental regulations and Airbnb license requirements directly with local government authorities for San Luis to ensure full compliance before hosting.
(Source: AirROI data, 2025, finding no licensed listings among those analyzed)
Top Performing Airbnb Properties in San Luis (2025)
Benchmark your potential! Explore examples of top-performing Airbnb properties in San Luisbased on Trailing Twelve Month (TTM) revenue. Analyze their characteristics, revenue, occupancy rate, and ADR to understand what drives success in this market.
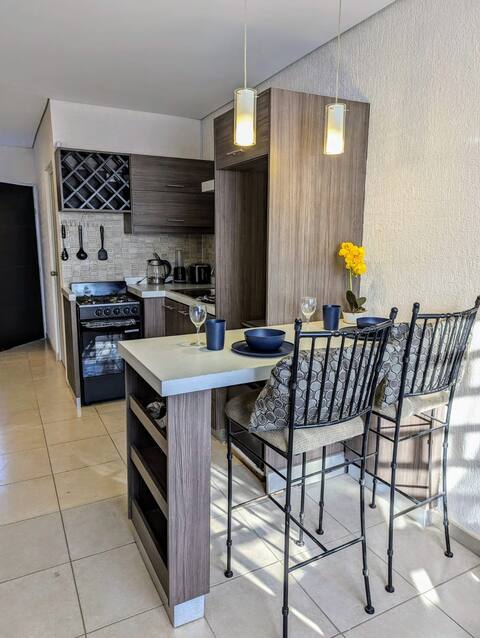
Cómodo departamento
Entire Place • 2 bedrooms
Mi espacio verde
Entire Place • 2 bedrooms
Mi espacio
Entire Place • 2 bedrooms
La casita
Entire Place • 2 bedrooms
Bajando la montaña
Entire Place • 2 bedrooms
Rinconcito in the corner available 24hrs A/C
Entire Place • 2 bedrooms
Note: Performance varies based on location, size, amenities, seasonality, and management quality. Data reflects the past 12 months.
Top Performing Airbnb Hosts in San Luis (2025)
Learn from the best! This table showcases top-performing Airbnb hosts in San Luis based on the number of properties managed and estimated total revenue over the past year. Analyze their scale and performance metrics.
| Host Name | Properties | Grossing Revenue | Stay Reviews | Avg Rating |
|---|---|---|---|---|
| Alan | 5 | $45,795 | 15 | 2.97/5.0 |
| Host #580237796 | 4 | $35,989 | 1 | 0.00/5.0 |
| Host #429827505 | 3 | $14,196 | 3 | 0.00/5.0 |
| Maria | 1 | $4,245 | 20 | 4.50/5.0 |
| Jose Edgar | 2 | $3,535 | 30 | 4.93/5.0 |
| Host #458504290 | 1 | $3,381 | 0 | 0.00/5.0 |
| Host #517365171 | 1 | $1,423 | 1 | 0.00/5.0 |
| Ada | 1 | $760 | 12 | 4.42/5.0 |
Analyzing the strategies of top hosts, such as their property selection, pricing, and guest communication, can offer valuable lessons for optimizing your own Airbnb operations in San Luis.
Dive Deeper: Advanced San Luis STR Market Data (2025)
Ready to unlock more insights? AirROI provides access to advanced metrics and comprehensive Airbnb data for San Luis. Explore detailed analytics beyond this report to refine your investment strategy, optimize pricing, and maximize your vacation rental profits.
Explore Advanced MetricsSan Luis Short-Term Rental Market Composition (2025): Property & Room Types
Room Type Distribution
Property Type Distribution
Market Composition Insights for San Luis
- The San Luis Airbnb market composition is heavily skewed towards Entire Home/Apt listings, which make up 94.4% of the 18 active rentals. This indicates strong guest preference for privacy and space.
- Looking at the property type distribution in San Luis, Apartment/Condo properties are the most common (72.2%), reflecting the local real estate landscape.
- The presence of 11.1% Hotel/Boutique listings indicates integration with traditional hospitality.
San Luis Airbnb Room Capacity Analysis (2025): Bedroom Distribution
Distribution of Listings by Number of Bedrooms
Room Capacity Insights for San Luis
- The dominant room capacity in San Luis is 2 bedrooms listings, making up 77.8% of the market. This suggests a strong demand for properties suitable for couples or solo travelers.
- Together, 2 bedrooms and 1 bedroom properties represent 100.0% of the active Airbnb listings in San Luis, indicating a high concentration in these sizes.
San Luis Vacation Rental Guest Capacity Trends (2025)
Distribution of Listings by Guest Capacity
Guest Capacity Insights for San Luis
- The most common guest capacity trend in San Luis vacation rentals is listings accommodating 3 guests (77.8%). This suggests the primary traveler segment is likely small families or groups.
- Properties designed for 3 guests and 8+ guests dominate the San Luis STR market, accounting for 88.9% of listings.
- 11.1% of properties accommodate 6+ guests, serving the market segment for larger families or group travel in San Luis.
- On average, properties in San Luis are equipped to host 3.6 guests.
San Luis Airbnb Booking Patterns (2025): Available vs. Booked Days
Available Days Distribution
Booked Days Distribution
Booking Pattern Insights for San Luis
- The most common availability pattern in San Luis falls within the 181-270 days range, representing 61.1% of listings. This suggests many properties have significant open periods on their calendars.
- Approximately 83.3% of listings show high availability (181+ days open annually), indicating potential for increased bookings or specific owner usage patterns.
- For booked days, the 91-180 days range is most frequent in San Luis (61.1%), reflecting common guest stay durations or potential owner blocking patterns.
- A notable 16.7% of properties secure long booking periods (181+ days booked per year), highlighting successful long-term rental strategies or significant owner usage.
San Luis Airbnb Minimum Stay Requirements Analysis
Distribution of Listings by Minimum Night Requirement
1 Night
1 listings
6.3% of total
2 Nights
2 listings
12.5% of total
3 Nights
2 listings
12.5% of total
4-6 Nights
3 listings
18.8% of total
30+ Nights
8 listings
50% of total
Key Insights
- The most prevalent minimum stay requirement in San Luis is 30+ Nights, adopted by 50% of listings. This highlights the market's preference for longer commitments.
- Very short stays (1-2 nights) are less common (18.8%), suggesting hosts prefer slightly longer bookings to optimize turnover.
- A significant segment (50%) caters to monthly stays (30+ nights) in San Luis, pointing to opportunities in the extended-stay market.
Recommendations
- Align with the market by considering a 30+ Nights minimum stay, as 50% of San Luis hosts use this setting.
- If feasible, allowing 1-night stays, especially midweek or during low season, could capture last-minute bookings, as only 6.3% currently do.
- Explore offering discounts for stays of 30+ nights to attract the 50% of the market seeking extended stays.
- Adjust minimum nights based on seasonality – potentially shorter during low season and longer during peak demand periods in San Luis.
San Luis Airbnb Cancellation Policy Trends Analysis (2025)
Flexible
2 listings
28.6% of total
Firm
5 listings
71.4% of total
Cancellation Policy Insights for San Luis
- The prevailing Airbnb cancellation policy trend in San Luis is Firm, used by 71.4% of listings.
- A majority (71.4%) of hosts in San Luis utilize Firm or Strict policies, indicating a market where hosts prioritize booking security.
Recommendations for Hosts
- Consider adopting a Firm policy to align with the 71.4% market standard in San Luis.
- Regularly review your cancellation policy against competitors and market demand shifts in San Luis.
San Luis STR Booking Lead Time Analysis (2025)
Average Booking Lead Time by Month
Booking Lead Time Insights for San Luis
- The overall average booking lead time for vacation rentals in San Luis is 19 days.
- Guests book furthest in advance for stays during January (average 48 days), likely coinciding with peak travel demand or local events.
- The shortest booking windows occur for stays in December (average 5 days), indicating more last-minute travel plans during this time.
- Seasonally, Winter (21 days avg.) sees the longest lead times, while Spring (6 days avg.) has the shortest, reflecting typical travel planning cycles.
Recommendations for Hosts
- Use the overall average lead time (19 days) as a baseline for your pricing and availability strategy in San Luis.
- For January stays, consider implementing length-of-stay discounts or slightly higher rates for bookings made less than 48 days out to capitalize on advance planning.
- During December, focus on last-minute booking availability and promotions, as guests book with very short notice (5 days avg.).
- Target marketing efforts for the Winter season well in advance (at least 21 days) to capture early planners.
- Monitor your own booking lead times against these San Luis averages to identify opportunities for dynamic pricing adjustments.
Popular & Essential Airbnb Amenities in San Luis (2025)
Amenity Prevalence
Amenity Insights for San Luis
- Essential amenities in San Luis that guests expect include: Essentials, Free parking on premises, Hot water. Lacking these (any) could significantly impact bookings.
- Popular amenities like Carbon monoxide alarm, Heating, Wifi are common but not universal. Offering these can provide a competitive edge.
- Warning: Wifi is not universally provided but is considered essential globally. Ensure reliable Wifi is offered.
Recommendations for Hosts
- Ensure your listing includes all essential amenities for San Luis: Essentials, Free parking on premises, Hot water.
- Consider adding popular differentiators like Carbon monoxide alarm or Heating to increase appeal.
- Highlight unique or less common amenities you offer (e.g., hot tub, dedicated workspace, EV charger) in your listing description and photos.
- Regularly check competitor amenities in San Luis to stay competitive.
San Luis Airbnb Guest Demographics & Profile Analysis (2025)
Guest Profile Summary for San Luis
- The typical guest profile for Airbnb in San Luis consists of primarily domestic travelers (79%), often arriving from nearby Tijuana, typically belonging to the Post-2000s (Gen Z/Alpha) group (50%), primarily speaking Spanish or English.
- Domestic travelers account for 79.2% of guests.
- Key international markets include Mexico (79.2%) and United States (20.8%).
- Top languages spoken are Spanish (57.1%) followed by English (35.7%).
- A significant demographic segment is the Post-2000s (Gen Z/Alpha) group, representing 50% of guests.
Recommendations for Hosts
- Target domestic marketing efforts towards travelers from Tijuana and Pasadena.
- Tailor amenities and listing descriptions to appeal to the dominant Post-2000s (Gen Z/Alpha) demographic (e.g., highlight fast WiFi, smart home features, local guides).
- Highlight unique local experiences or amenities relevant to the primary guest profile.
- Consider seasonal promotions aligned with peak travel times for key origin markets.
Nearby Short-Term Rental Market Comparison
How does the San Luis Airbnb market stack up against its neighbors? Compare key performance metrics like average monthly revenue, ADR, and occupancy rates in surrounding areas to understand the broader regional STR landscape.
| Market | Active Properties | Monthly Revenue | Daily Rate | Avg. Occupancy |
|---|---|---|---|---|
| Rancho Santa Fe | 32 | $9,810 | $861.10 | 38% |
| Rancho San Diego | 28 | $8,589 | $516.45 | 51% |
| Thousand Palms | 33 | $8,240 | $665.04 | 41% |
| Newport Beach | 1,330 | $7,974 | $649.37 | 44% |
| GlenOak Hills | 38 | $7,623 | $589.95 | 38% |
| Del Mar | 116 | $7,430 | $614.90 | 48% |
| Lakeside | 36 | $6,962 | $515.31 | 47% |
| Tenaja | 10 | $6,811 | $584.25 | 47% |
| Santa Margarita Ranchos | 17 | $6,420 | $477.27 | 38% |
| Mount Helix | 40 | $6,343 | $491.77 | 49% |