Xalisco Airbnb Market Analysis 2025: Short Term Rental Data & Vacation Rental Statistics in Nayarit, Mexico
Is Airbnb profitable in Xalisco in 2025? Explore comprehensive Airbnb analytics for Xalisco, Nayarit, Mexico to uncover income potential. This 2025 STR market report for Xalisco, based on AirROI data from December 2024 to November 2025, reveals key trends in the niche market of 20 active listings.
Whether you're considering an Airbnb investment in Xalisco, optimizing your existing vacation rental, or exploring rental arbitrage opportunities, understanding the Xalisco Airbnb data is crucial. Leveraging the low regulation environment is key to maximizing your short term rental income potential. Let's dive into the specifics.
Key Xalisco Airbnb Performance Metrics Overview
Monthly Airbnb Revenue Variations & Income Potential in Xalisco (2025)
Understanding the monthly revenue variations for Airbnb listings in Xalisco is key to maximizing your short term rental income potential. Seasonality significantly impacts earnings. Our analysis, based on data from the past 12 months, shows that the peak revenue month for STRs in Xalisco is typically December, while May often presents the lowest earnings, highlighting opportunities for strategic pricing adjustments during shoulder and low seasons. Explore the typical Airbnb income in Xalisco across different performance tiers:
- Best-in-class properties (Top 10%) achieve $928+ monthly, often utilizing dynamic pricing and superior guest experiences.
- Strong performing properties (Top 25%) earn $435 or more, indicating effective management and desirable locations/amenities.
- Typical properties (Median) generate around $272 per month, representing the average market performance.
- Entry-level properties (Bottom 25%) see earnings around $168, often with potential for optimization.
Average Monthly Airbnb Earnings Trend in Xalisco
Xalisco Airbnb Occupancy Rate Trends (2025)
Maximize your bookings by understanding the Xalisco STR occupancy trends. Seasonal demand shifts significantly influence how often properties are booked. Typically, Decembersees the highest demand (peak season occupancy), while October experiences the lowest (low season). Effective strategies, like adjusting minimum stays or offering promotions, can boost occupancy during slower periods. Here's how different property tiers perform in Xalisco:
- Best-in-class properties (Top 10%) achieve 53%+ occupancy, indicating high desirability and potentially optimized availability.
- Strong performing properties (Top 25%) maintain 32% or higher occupancy, suggesting good market fit and guest satisfaction.
- Typical properties (Median) have an occupancy rate around 19%.
- Entry-level properties (Bottom 25%) average 12% occupancy, potentially facing higher vacancy.
Average Monthly Occupancy Rate Trend in Xalisco
Average Daily Rate (ADR) Airbnb Trends in Xalisco (2025)
Effective short term rental pricing strategy in Xalisco involves understanding monthly ADR fluctuations. The Average Daily Rate (ADR) for Airbnb in Xalisco typically peaks in October and dips lowest during April. Leveraging Airbnb dynamic pricing tools or strategies based on this seasonality can significantly boost revenue. Here's a look at the typical nightly rates achieved:
- Best-in-class properties (Top 10%) command rates of $76+ per night, often due to premium features or locations.
- Strong performing properties (Top 25%) achieve nightly rates of $62 or more.
- Typical properties (Median) charge around $46 per night.
- Entry-level properties (Bottom 25%) earn around $35 per night.
Average Daily Rate (ADR) Trend by Month in Xalisco
Get Live Xalisco Market Intelligence 👇
Explore Real-time Analytics
Airbnb Seasonality Analysis & Trends in Xalisco (2025)
Peak Season (December, August, January)
- Revenue averages $543 per month
- Occupancy rates average 34.0%
- Daily rates average $51
Shoulder Season
- Revenue averages $383 per month
- Occupancy maintains around 25.8%
- Daily rates hold near $50
Low Season (May, September, October)
- Revenue drops to average $224 per month
- Occupancy decreases to average 15.3%
- Daily rates adjust to average $55
Seasonality Insights for Xalisco
- The Airbnb seasonality in Xalisco shows highly seasonal trends requiring careful strategy. While the sections above show seasonal averages, it's also insightful to look at the extremes:
- During the high season, the absolute peak month showcases Xalisco's highest earning potential, with monthly revenues capable of climbing to $667, occupancy reaching a high of 46.9%, and ADRs peaking at $59.
- Conversely, the slowest single month of the year, typically falling within the low season, marks the market's lowest point. In this month, revenue might dip to $188, occupancy could drop to 12.6%, and ADRs may adjust down to $47.
- Understanding both the seasonal averages and these monthly peaks and troughs in revenue, occupancy, and ADR is crucial for maximizing your Airbnb profit potential in Xalisco.
Seasonal Strategies for Maximizing Profit
- Peak Season: Maximize revenue through premium pricing and potentially longer minimum stays. Ensure high availability.
- Low Season: Offer competitive pricing, special promotions (e.g., extended stay discounts), and flexible cancellation policies. Target off-season travelers like remote workers or budget-conscious guests.
- Shoulder Seasons: Implement dynamic pricing that balances peak and low rates. Target weekend travelers or specific events. Offer slightly more flexible terms than peak season.
- Regularly analyze your own performance against these Xalisco seasonality benchmarks and adjust your pricing and availability strategy accordingly.
Best Areas for Airbnb Investment in Xalisco (2025)
Exploring the top neighborhoods for short-term rentals in Xalisco? This section highlights key areas, outlining why they are attractive for hosts and guests, along with notable local attractions. Consider these locations based on your target guest profile and investment strategy.
| Neighborhood / Area | Why Host Here? (Target Guests & Appeal) | Key Attractions & Landmarks |
|---|---|---|
| Centro Histórico | The historic center of La Peñita de Jaltemba, rich in local culture and close to the beach. Ideal for visitors who want to experience authentic Mexican life, local markets, and delicious street food. | La Peñita Beach, Cultural Center, Local Markets, Restaurants, Art Shops |
| Rincón de Guayabitos | A popular beach destination for both tourists and locals, known for its calm waters and family-friendly atmosphere. Perfect for those looking to enjoy relaxing beach days and water sports. | Guayabitos Beach, Water Sports Activities, Restaurants, Night Market, Beachfront Bars |
| La Playita | A quiet beach area that offers a laid-back vibe and stunning sunsets. Great for travelers seeking tranquility away from crowded areas, with beautiful natural scenery. | Relaxing Beaches, Scenic Views, Nature Trails, Local eateries, Sunset Views |
| Los Ayala | A charming small beach town known for its beautiful bay and relaxed atmosphere. Attracts visitors who enjoy fishing, hiking, and exploring local culture. | Los Ayala Beach, Fishing, Hiking Trails, Local Cuisine, Traditional Festivals |
| San Francisco (San Pancho) | A bohemian beach town with a vibrant arts community, attracting surfers and artists. Ideal for visitors looking for a unique cultural experience and lively local events. | San Pancho Beach, Art Galleries, Surfing, Live Music Venues, Community Events |
| Sayulita | A trendy surf town famous for its surf culture, lively nightlife, and eclectic shops. Perfect for younger crowds and surfers looking for an exciting beach experience. | Sayulita Beach, Surf Lessons, Shopping, Nightlife, Art Markets |
| Tepic | The capital of Nayarit, offering a blend of cultural attractions, shopping, and dining. A great base for those looking to explore inland attractions and cultural sites. | Museo de los Tres Mundos, Historic Plaza, Local Markets, Cultural Festivals, Nearby Nature |
| Las Varas | A small town located close to major tourist areas, providing a more affordable and authentic Mexican experience while being near the coast and other attractions. | Las Varas Main Square, Traditional Food, Local Markets, Cultural Events, Access to Beaches |
Understanding Airbnb License Requirements & STR Laws in Xalisco (2025)
While Xalisco, Nayarit, Mexico currently shows low STR regulations, specific Airbnb license requirements might still exist or change. Always verify the latest short term rental regulations and Airbnb license requirements directly with local government authorities for Xalisco to ensure full compliance before hosting.
(Source: AirROI data, 2025, finding no licensed listings among those analyzed)
Top Performing Airbnb Properties in Xalisco (2025)
Benchmark your potential! Explore examples of top-performing Airbnb properties in Xaliscobased on Trailing Twelve Month (TTM) revenue. Analyze their characteristics, revenue, occupancy rate, and ADR to understand what drives success in this market.
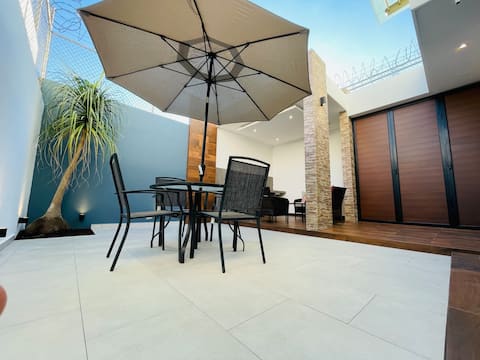
Casa Fénix
Entire Place • 3 bedrooms
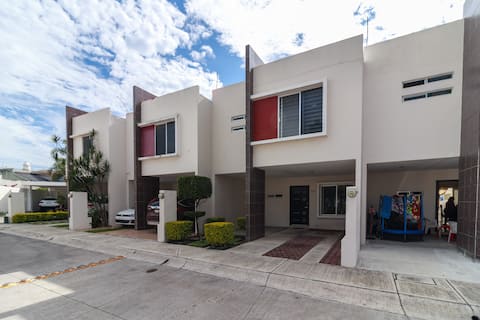
Tepic is just 7 minutes away.
Entire Place • 3 bedrooms
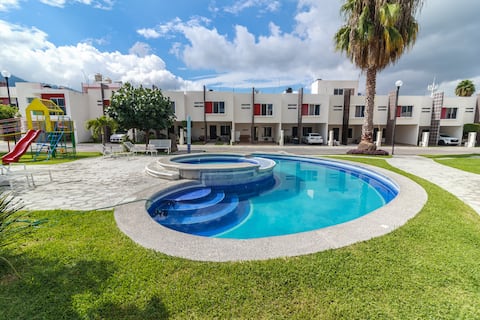
The place you need.
Entire Place • 3 bedrooms
Casa Del Sol
Entire Place • 3 bedrooms
Cozy and spacious apartment
Entire Place • 2 bedrooms
Comfortable house; well-being and relaxation.
Entire Place • 3 bedrooms
Note: Performance varies based on location, size, amenities, seasonality, and management quality. Data reflects the past 12 months.
Top Performing Airbnb Hosts in Xalisco (2025)
Learn from the best! This table showcases top-performing Airbnb hosts in Xalisco based on the number of properties managed and estimated total revenue over the past year. Analyze their scale and performance metrics.
| Host Name | Properties | Grossing Revenue | Stay Reviews | Avg Rating |
|---|---|---|---|---|
| Adrián | 3 | $15,576 | 23 | 4.92/5.0 |
| Paulo Cesar | 4 | $12,498 | 112 | 4.94/5.0 |
| Irán | 1 | $6,392 | 15 | 4.93/5.0 |
| Juan Miguel | 2 | $3,812 | 30 | 4.88/5.0 |
| Brenda Abigail | 1 | $3,551 | 13 | 4.85/5.0 |
| Maria Guadalupe | 1 | $3,192 | 119 | 4.89/5.0 |
| Ulises | 2 | $3,011 | 23 | 4.88/5.0 |
| Obed | 1 | $2,946 | 41 | 4.90/5.0 |
| Paco | 1 | $2,687 | 18 | 4.83/5.0 |
| Ramon | 1 | $2,621 | 26 | 4.88/5.0 |
Analyzing the strategies of top hosts, such as their property selection, pricing, and guest communication, can offer valuable lessons for optimizing your own Airbnb operations in Xalisco.
Dive Deeper: Advanced Xalisco STR Market Data (2025)
Ready to unlock more insights? AirROI provides access to advanced metrics and comprehensive Airbnb data for Xalisco. Explore detailed analytics beyond this report to refine your investment strategy, optimize pricing, and maximize your vacation rental profits.
Explore Advanced MetricsXalisco Short-Term Rental Market Composition (2025): Property & Room Types
Room Type Distribution
Property Type Distribution
Market Composition Insights for Xalisco
- The Xalisco Airbnb market composition is heavily skewed towards Entire Home/Apt listings, which make up 100% of the 20 active rentals. This indicates strong guest preference for privacy and space.
- Looking at the property type distribution in Xalisco, House properties are the most common (50%), reflecting the local real estate landscape.
- Houses represent a significant 50% portion, catering likely to families or larger groups.
Xalisco Airbnb Room Capacity Analysis (2025): Bedroom Distribution
Distribution of Listings by Number of Bedrooms
Room Capacity Insights for Xalisco
- The dominant room capacity in Xalisco is 2 bedrooms listings, making up 40% of the market. This suggests a strong demand for properties suitable for couples or solo travelers.
- Together, 2 bedrooms and 3 bedrooms properties represent 75.0% of the active Airbnb listings in Xalisco, indicating a high concentration in these sizes.
- A significant 35.0% of listings offer 3+ bedrooms, catering to larger groups and families seeking more space in Xalisco.
Xalisco Vacation Rental Guest Capacity Trends (2025)
Distribution of Listings by Guest Capacity
Guest Capacity Insights for Xalisco
- The most common guest capacity trend in Xalisco vacation rentals is listings accommodating 4 guests (45%). This suggests the primary traveler segment is likely small families or groups.
- Properties designed for 4 guests and 6 guests dominate the Xalisco STR market, accounting for 75.0% of listings.
- 35.0% of properties accommodate 6+ guests, serving the market segment for larger families or group travel in Xalisco.
- On average, properties in Xalisco are equipped to host 4.4 guests.
Xalisco Airbnb Booking Patterns (2025): Available vs. Booked Days
Available Days Distribution
Booked Days Distribution
Booking Pattern Insights for Xalisco
- The most common availability pattern in Xalisco falls within the 271-366 days range, representing 75% of listings. This suggests many properties have significant open periods on their calendars.
- Approximately 100.0% of listings show high availability (181+ days open annually), indicating potential for increased bookings or specific owner usage patterns.
- For booked days, the 31-90 days range is most frequent in Xalisco (45%), reflecting common guest stay durations or potential owner blocking patterns.
Xalisco Airbnb Minimum Stay Requirements Analysis
Distribution of Listings by Minimum Night Requirement
1 Night
11 listings
55% of total
2 Nights
6 listings
30% of total
30+ Nights
3 listings
15% of total
Key Insights
- The most prevalent minimum stay requirement in Xalisco is 1 Night, adopted by 55% of listings. This highlights the market's preference for shorter, flexible bookings.
- A strong majority (85.0%) of the Xalisco Airbnb data shows acceptance of very short stays (1-2 nights), indicating a dynamic, high-turnover market.
- A significant segment (15%) caters to monthly stays (30+ nights) in Xalisco, pointing to opportunities in the extended-stay market.
Recommendations
- Align with the market by considering a 1 Night minimum stay, as 55% of Xalisco hosts use this setting.
- Explore offering discounts for stays of 30+ nights to attract the 15% of the market seeking extended stays.
- Adjust minimum nights based on seasonality – potentially shorter during low season and longer during peak demand periods in Xalisco.
Xalisco Airbnb Cancellation Policy Trends Analysis (2025)
Flexible
11 listings
55% of total
Moderate
2 listings
10% of total
Firm
7 listings
35% of total
Cancellation Policy Insights for Xalisco
- The prevailing Airbnb cancellation policy trend in Xalisco is Flexible, used by 55% of listings.
- There's a relatively balanced mix between guest-friendly (65.0%) and stricter (35.0%) policies, offering choices for different guest needs.
Recommendations for Hosts
- Consider adopting a Flexible policy to align with the 55% market standard in Xalisco.
- Given the high prevalence of Flexible policies (55%), offering this can enhance booking appeal, especially during shoulder seasons.
- Regularly review your cancellation policy against competitors and market demand shifts in Xalisco.
Xalisco STR Booking Lead Time Analysis (2025)
Average Booking Lead Time by Month
Booking Lead Time Insights for Xalisco
- The overall average booking lead time for vacation rentals in Xalisco is 12 days.
- Guests book furthest in advance for stays during December (average 34 days), likely coinciding with peak travel demand or local events.
- The shortest booking windows occur for stays in September (average 5 days), indicating more last-minute travel plans during this time.
- Seasonally, Winter (19 days avg.) sees the longest lead times, while Summer (8 days avg.) has the shortest, reflecting typical travel planning cycles.
Recommendations for Hosts
- Use the overall average lead time (12 days) as a baseline for your pricing and availability strategy in Xalisco.
- For December stays, consider implementing length-of-stay discounts or slightly higher rates for bookings made less than 34 days out to capitalize on advance planning.
- Target marketing efforts for the Winter season well in advance (at least 19 days) to capture early planners.
- Monitor your own booking lead times against these Xalisco averages to identify opportunities for dynamic pricing adjustments.
Popular & Essential Airbnb Amenities in Xalisco (2025)
Amenity Prevalence
Amenity Insights for Xalisco
- Essential amenities in Xalisco that guests expect include: TV, Kitchen, Wifi, Hot water. Lacking these (any) could significantly impact bookings.
- Popular amenities like Iron, Cooking basics, Free parking on premises are common but not universal. Offering these can provide a competitive edge.
Recommendations for Hosts
- Ensure your listing includes all essential amenities for Xalisco: TV, Kitchen, Wifi, Hot water.
- Prioritize adding missing essentials: Wifi, Hot water.
- Consider adding popular differentiators like Iron or Cooking basics to increase appeal.
- Highlight unique or less common amenities you offer (e.g., hot tub, dedicated workspace, EV charger) in your listing description and photos.
- Regularly check competitor amenities in Xalisco to stay competitive.
Xalisco Airbnb Guest Demographics & Profile Analysis (2025)
Guest Profile Summary for Xalisco
- The typical guest profile for Airbnb in Xalisco consists of primarily domestic travelers (93%), often arriving from nearby Mexico City, typically belonging to the Post-2000s (Gen Z/Alpha) group (50%), primarily speaking Spanish or English.
- Domestic travelers account for 92.5% of guests.
- Key international markets include Mexico (92.5%) and United States (7.5%).
- Top languages spoken are Spanish (73.1%) followed by English (25%).
- A significant demographic segment is the Post-2000s (Gen Z/Alpha) group, representing 50% of guests.
Recommendations for Hosts
- Target domestic marketing efforts towards travelers from Mexico City and Guadalajara.
- Tailor amenities and listing descriptions to appeal to the dominant Post-2000s (Gen Z/Alpha) demographic (e.g., highlight fast WiFi, smart home features, local guides).
- Highlight unique local experiences or amenities relevant to the primary guest profile.
- Consider seasonal promotions aligned with peak travel times for key origin markets.
Nearby Short-Term Rental Market Comparison
How does the Xalisco Airbnb market stack up against its neighbors? Compare key performance metrics like average monthly revenue, ADR, and occupancy rates in surrounding areas to understand the broader regional STR landscape.
| Market | Active Properties | Monthly Revenue | Daily Rate | Avg. Occupancy |
|---|---|---|---|---|
| Punta de Mita | 82 | $6,020 | $871.78 | 35% |
| Higuera Blanca | 34 | $5,029 | $603.33 | 31% |
| Corral del Risco | 421 | $4,707 | $708.47 | 33% |
| Punta Mita | 60 | $4,705 | $748.57 | 36% |
| Nayarit | 29 | $3,032 | $617.80 | 28% |
| Litibu | 13 | $2,742 | $264.11 | 42% |
| Boca de Tomatlán | 278 | $2,677 | $355.43 | 37% |
| San Juan Cosalá | 100 | $2,214 | $258.01 | 30% |
| Puerto Vallarta | 6,586 | $2,118 | $214.36 | 43% |
| Matanchén | 21 | $2,109 | $257.90 | 26% |