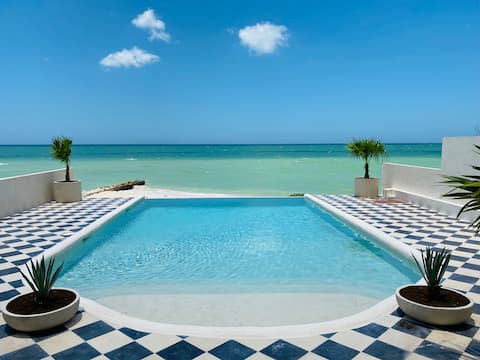
Chuburná Airbnb Market Analysis 2026: Short Term Rental Data & Vacation Rental Statistics in Yucatán, Mexico
Is Airbnb profitable in Chuburná in 2026? Explore comprehensive Airbnb analytics for Chuburná, Yucatán, Mexico to uncover income potential. This 2026 STR market report for Chuburná, based on AirROI data from February 2025 to January 2026, reveals key trends in the niche market of 46 active listings.
Whether you're considering an Airbnb investment in Chuburná, optimizing your existing vacation rental, or exploring rental arbitrage opportunities, understanding the Chuburná Airbnb data is crucial. Leveraging the low regulation environment is key to maximizing your short term rental income potential. Let's dive into the specifics.
Key Chuburná Airbnb Performance Metrics Overview
Monthly Airbnb Revenue Variations & Income Potential in Chuburná (2026)
Understanding the monthly revenue variations for Airbnb listings in Chuburná is key to maximizing your short term rental income potential. Seasonality significantly impacts earnings. Our analysis, based on data from the past 12 months, shows that the peak revenue month for STRs in Chuburná is typically July, while October often presents the lowest earnings, highlighting opportunities for strategic pricing adjustments during shoulder and low seasons. Explore the typical Airbnb income in Chuburná across different performance tiers:
- Best-in-class properties (Top 10%) achieve $4,580+ monthly, often utilizing dynamic pricing and superior guest experiences.
- Strong performing properties (Top 25%) earn $2,932 or more, indicating effective management and desirable locations/amenities.
- Typical properties (Median) generate around $1,375 per month, representing the average market performance.
- Entry-level properties (Bottom 25%) see earnings around $664, often with potential for optimization.
Average Monthly Airbnb Earnings Trend in Chuburná
Chuburná Airbnb Occupancy Rate Trends (2026)
Maximize your bookings by understanding the Chuburná STR occupancy trends. Seasonal demand shifts significantly influence how often properties are booked. Typically, Julysees the highest demand (peak season occupancy), while October experiences the lowest (low season). Effective strategies, like adjusting minimum stays or offering promotions, can boost occupancy during slower periods. Here's how different property tiers perform in Chuburná:
- Best-in-class properties (Top 10%) achieve 81%+ occupancy, indicating high desirability and potentially optimized availability.
- Strong performing properties (Top 25%) maintain 66% or higher occupancy, suggesting good market fit and guest satisfaction.
- Typical properties (Median) have an occupancy rate around 37%.
- Entry-level properties (Bottom 25%) average 16% occupancy, potentially facing higher vacancy.
Average Monthly Occupancy Rate Trend in Chuburná
Average Daily Rate (ADR) Airbnb Trends in Chuburná (2026)
Effective short term rental pricing strategy in Chuburná involves understanding monthly ADR fluctuations. The Average Daily Rate (ADR) for Airbnb in Chuburná typically peaks in December and dips lowest during March. Leveraging Airbnb dynamic pricing tools or strategies based on this seasonality can significantly boost revenue. Here's a look at the typical nightly rates achieved:
- Best-in-class properties (Top 10%) command rates of $322+ per night, often due to premium features or locations.
- Strong performing properties (Top 25%) achieve nightly rates of $196 or more.
- Typical properties (Median) charge around $130 per night.
- Entry-level properties (Bottom 25%) earn around $98 per night.
Average Daily Rate (ADR) Trend by Month in Chuburná
Get Live Chuburná Market Intelligence 👇

Explore Real-time Analytics
Airbnb Seasonality Analysis & Trends in Chuburná (2026)
Peak Season (July, August, April)
- Revenue averages $2,839 per month
- Occupancy rates average 51.0%
- Daily rates average $166
Shoulder Season
- Revenue averages $2,131 per month
- Occupancy maintains around 39.9%
- Daily rates hold near $170
Low Season (March, September, October)
- Revenue drops to average $1,602 per month
- Occupancy decreases to average 34.8%
- Daily rates adjust to average $166
Seasonality Insights for Chuburná
- The Airbnb seasonality in Chuburná shows highly seasonal trends requiring careful strategy. While the sections above show seasonal averages, it's also insightful to look at the extremes:
- During the high season, the absolute peak month showcases Chuburná's highest earning potential, with monthly revenues capable of climbing to $3,211, occupancy reaching a high of 54.4%, and ADRs peaking at $184.
- Conversely, the slowest single month of the year, typically falling within the low season, marks the market's lowest point. In this month, revenue might dip to $1,355, occupancy could drop to 31.1%, and ADRs may adjust down to $156.
- Understanding both the seasonal averages and these monthly peaks and troughs in revenue, occupancy, and ADR is crucial for maximizing your Airbnb profit potential in Chuburná.
Seasonal Strategies for Maximizing Profit
- Peak Season: Maximize revenue through premium pricing and potentially longer minimum stays. Ensure high availability.
- Low Season: Offer competitive pricing, special promotions (e.g., extended stay discounts), and flexible cancellation policies. Target off-season travelers like remote workers or budget-conscious guests.
- Shoulder Seasons: Implement dynamic pricing that balances peak and low rates. Target weekend travelers or specific events. Offer slightly more flexible terms than peak season.
- Regularly analyze your own performance against these Chuburná seasonality benchmarks and adjust your pricing and availability strategy accordingly.
Best Areas for Airbnb Investment in Chuburná (2026)
Exploring the top neighborhoods for short-term rentals in Chuburná? This section highlights key areas, outlining why they are attractive for hosts and guests, along with notable local attractions. Consider these locations based on your target guest profile and investment strategy.
| Neighborhood / Area | Why Host Here? (Target Guests & Appeal) | Key Attractions & Landmarks |
|---|---|---|
| Chuburná Puerto | A charming beach town known for its serene atmosphere and proximity to beautiful beaches. Ideal for families and leisure travelers looking for a peaceful getaway. | Chuburná Beach, Laguna Rosada, Fishing opportunities, Local seafood restaurants, Mangrove tours |
| Progreso | A popular coastal town with a vibrant boardwalk and rich fishing industry, attracting visitors for beach activities and local culture. | Progreso Beach, Malecón de Progreso, Museo del Ferrocarril, Local markets, Nearby cenotes |
| Chicxulub | A small coastal town with historical significance and beautiful beaches, offering a laid-back atmosphere for vacationers. | Chicxulub Beach, Cristo Rey Church, Historical cenotes, Fishing and water sports, Local restaurants |
| Telchac | Known for its pristine beaches and tranquility, it offers a chance to relax away from the busier tourist spots. | Telchac Beach, Local ecotourism, Nearby archaeological sites, Fishing and beachcombing, Cenote experiences |
| Merida | The capital of Yucatán, known for its colonial architecture, cultural events, and vibrant city life. Great for those wanting to explore the rich history of the region. | Paseo de Montejo, Plaza Mayor, Catedral de Mérida, Yucatán Museum of Contemporary Art, Cultural festivals |
| Dzilam de Bravo | A lesser-known fishing village that offers a unique experience with stunning natural beauty and a peaceful environment. | Dzilam Beach, Fishing trips, Nature reserves, Local cuisine, Cenote tours |
| Celestún | Famous for its biosphere reserve and flamingo colonies. Offers nature lovers and eco-tourists an ideal location. | Celestún Biosphere Reserve, Flamingo watching, Local seafood delicacies, Fishing and boating, Birdwatching opportunities |
| Baca | A quaint town that serves as a great base for exploring the surrounding cenotes and Yucatán's natural beauty. | Cenotes nearby, Cultural heritage sites, Local markets, Traditional cuisine, Peaceful rural environment |
Understanding Airbnb License Requirements & STR Laws in Chuburná (2026)
While Chuburná, Yucatán, Mexico currently shows low STR regulations, specific Airbnb license requirements might still exist or change. Always verify the latest short term rental regulations and Airbnb license requirements directly with local government authorities for Chuburná to ensure full compliance before hosting.
(Source: AirROI data, 2026, finding no licensed listings among those analyzed)
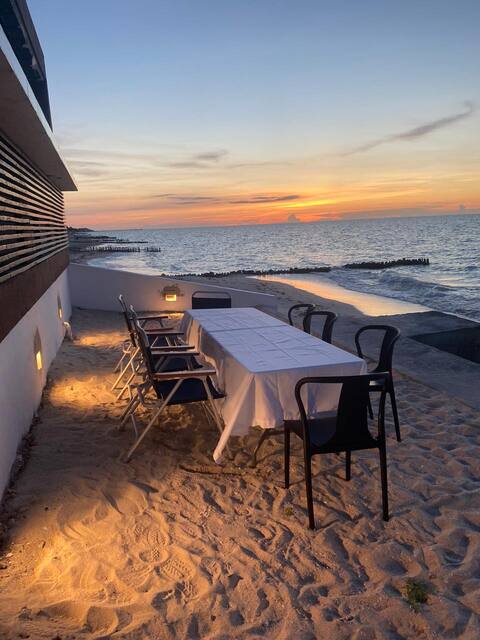
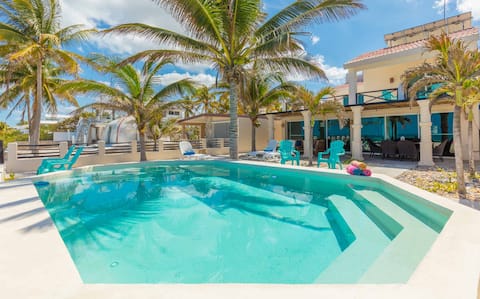
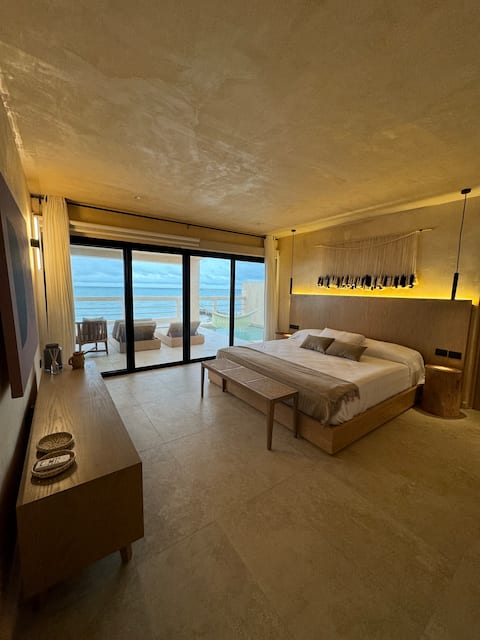
Top Performing Airbnb Properties in Chuburná (2026)
Benchmark your potential! Explore examples of top-performing Airbnb properties in Chuburnábased on Trailing Twelve Month (TTM) revenue. Analyze their characteristics, revenue, occupancy rate, and ADR to understand what drives success in this market.
Casa Ocea ~ An Oceanfront Art Retreat
Entire Place • 4 bedrooms
6 BDR Stunning Beachfront House & Private Pool !
Entire Place • 6 bedrooms
Casa Del Mar Emerald
Entire Place • 5 bedrooms

Beach house facing the sea
Entire Place • 3 bedrooms
Oceanfront house with pool (Keeran House)
Entire Place • 2 bedrooms

Spectacular Beach House with Pool · 3BR / 2.5BA
Entire Place • 3 bedrooms
Note: Performance varies based on location, size, amenities, seasonality, and management quality. Data reflects the past 12 months.
Top Performing Airbnb Hosts in Chuburná (2026)
Learn from the best! This table showcases top-performing Airbnb hosts in Chuburná based on the number of properties managed and estimated total revenue over the past year. Analyze their scale and performance metrics.
| Host Name | Properties | Grossing Revenue | Stay Reviews | Avg Rating |
|---|---|---|---|---|
| Verónica | 5 | $154,686 | 159 | 4.87/5.0 |
| Tiffany | 1 | $81,730 | 40 | 4.95/5.0 |
| Jill | 4 | $77,924 | 116 | 4.68/5.0 |
| Tania | 1 | $64,096 | 58 | 4.71/5.0 |
| Rena | 1 | $62,522 | 53 | 4.77/5.0 |
| Miguel | 1 | $53,924 | 84 | 4.90/5.0 |
| Fernanda | 1 | $50,206 | 54 | 4.81/5.0 |
| Keith | 1 | $33,970 | 23 | 4.83/5.0 |
| Royare | 1 | $32,470 | 83 | 4.71/5.0 |
| Baphu | 1 | $23,098 | 28 | 4.86/5.0 |
Analyzing the strategies of top hosts, such as their property selection, pricing, and guest communication, can offer valuable lessons for optimizing your own Airbnb operations in Chuburná.
Dive Deeper: Advanced Chuburná STR Market Data (2026)
Ready to unlock more insights? AirROI provides access to advanced metrics and comprehensive Airbnb data for Chuburná. Explore detailed analytics beyond this report to refine your investment strategy, optimize pricing, and maximize your vacation rental profits.
Explore Advanced MetricsChuburná Short-Term Rental Market Composition (2026): Property & Room Types
Room Type Distribution
Property Type Distribution
Market Composition Insights for Chuburná
- The Chuburná Airbnb market composition is heavily skewed towards Entire Home/Apt listings, which make up 91.3% of the 46 active rentals. This indicates strong guest preference for privacy and space.
- Looking at the property type distribution in Chuburná, House properties are the most common (73.9%), reflecting the local real estate landscape.
- Houses represent a significant 73.9% portion, catering likely to families or larger groups.
- The presence of 8.7% Hotel/Boutique listings indicates integration with traditional hospitality.
- Smaller segments like others (combined 2.2%) offer potential for unique stay experiences.
Chuburná Airbnb Room Capacity Analysis (2026): Bedroom Distribution
Distribution of Listings by Number of Bedrooms
Room Capacity Insights for Chuburná
- The dominant room capacity in Chuburná is 2 bedrooms listings, making up 30.4% of the market. This suggests a strong demand for properties suitable for couples or solo travelers.
- Together, 2 bedrooms and 1 bedroom properties represent 54.3% of the active Airbnb listings in Chuburná, indicating a high concentration in these sizes.
- A significant 39.1% of listings offer 3+ bedrooms, catering to larger groups and families seeking more space in Chuburná.
Chuburná Vacation Rental Guest Capacity Trends (2026)
Distribution of Listings by Guest Capacity
Guest Capacity Insights for Chuburná
- The most common guest capacity trend in Chuburná vacation rentals is listings accommodating 8+ guests (41.3%). This suggests the primary traveler segment is likely larger groups.
- Properties designed for 8+ guests and 6 guests dominate the Chuburná STR market, accounting for 63.0% of listings.
- 65.2% of properties accommodate 6+ guests, serving the market segment for larger families or group travel in Chuburná.
- On average, properties in Chuburná are equipped to host 5.7 guests.
Chuburná Airbnb Booking Patterns (2026): Available vs. Booked Days
Available Days Distribution
Booked Days Distribution
Booking Pattern Insights for Chuburná
- The most common availability pattern in Chuburná falls within the 271-366 days range, representing 52.2% of listings. This suggests many properties have significant open periods on their calendars.
- Approximately 78.3% of listings show high availability (181+ days open annually), indicating potential for increased bookings or specific owner usage patterns.
- For booked days, the 31-90 days range is most frequent in Chuburná (37%), reflecting common guest stay durations or potential owner blocking patterns.
- A notable 21.7% of properties secure long booking periods (181+ days booked per year), highlighting successful long-term rental strategies or significant owner usage.
Chuburná Airbnb Minimum Stay Requirements Analysis
Distribution of Listings by Minimum Night Requirement
1 Night
7 listings
15.2% of total
2 Nights
14 listings
30.4% of total
3 Nights
3 listings
6.5% of total
4-6 Nights
8 listings
17.4% of total
7-29 Nights
2 listings
4.3% of total
30+ Nights
12 listings
26.1% of total
Key Insights
- The most prevalent minimum stay requirement in Chuburná is 2 Nights, adopted by 30.4% of listings. This highlights the market's preference for shorter, flexible bookings.
- A significant segment (26.1%) caters to monthly stays (30+ nights) in Chuburná, pointing to opportunities in the extended-stay market.
Recommendations
- Align with the market by considering a 2 Nights minimum stay, as 30.4% of Chuburná hosts use this setting.
- If feasible, allowing 1-night stays, especially midweek or during low season, could capture last-minute bookings, as only 15.2% currently do.
- A 2-night minimum appears standard (30.4%). Consider this for weekends or peak periods.
- Explore offering discounts for stays of 30+ nights to attract the 26.1% of the market seeking extended stays.
- Adjust minimum nights based on seasonality – potentially shorter during low season and longer during peak demand periods in Chuburná.
Chuburná Airbnb Cancellation Policy Trends Analysis (2026)
Limited
2 listings
4.3% of total
Flexible
11 listings
23.9% of total
Moderate
10 listings
21.7% of total
Firm
16 listings
34.8% of total
Strict
7 listings
15.2% of total
Cancellation Policy Insights for Chuburná
- The prevailing Airbnb cancellation policy trend in Chuburná is Firm, used by 34.8% of listings.
- There's a relatively balanced mix between guest-friendly (45.6%) and stricter (50.0%) policies, offering choices for different guest needs.
Recommendations for Hosts
- Consider adopting a Firm policy to align with the 34.8% market standard in Chuburná.
- Regularly review your cancellation policy against competitors and market demand shifts in Chuburná.
Chuburná STR Booking Lead Time Analysis (2026)
Average Booking Lead Time by Month
Booking Lead Time Insights for Chuburná
- The overall average booking lead time for vacation rentals in Chuburná is 42 days.
- Guests book furthest in advance for stays during December (average 64 days), likely coinciding with peak travel demand or local events.
- The shortest booking windows occur for stays in June (average 27 days), indicating more last-minute travel plans during this time.
- Seasonally, Winter (62 days avg.) sees the longest lead times, while Spring (37 days avg.) has the shortest, reflecting typical travel planning cycles.
Recommendations for Hosts
- Use the overall average lead time (42 days) as a baseline for your pricing and availability strategy in Chuburná.
- For December stays, consider implementing length-of-stay discounts or slightly higher rates for bookings made less than 64 days out to capitalize on advance planning.
- Target marketing efforts for the Winter season well in advance (at least 62 days) to capture early planners.
- Monitor your own booking lead times against these Chuburná averages to identify opportunities for dynamic pricing adjustments.
Popular & Essential Airbnb Amenities in Chuburná (2026)
Amenity Prevalence
Amenity Insights for Chuburná
- Essential amenities in Chuburná that guests expect include: Air conditioning, Wifi. Lacking these (any) could significantly impact bookings.
- Popular amenities like Free parking on premises, TV, Pool are common but not universal. Offering these can provide a competitive edge.
- A pool is a highly desired but not standard amenity, making it a key feature for attracting guests seeking leisure in Chuburná.
Recommendations for Hosts
- Ensure your listing includes all essential amenities for Chuburná: Air conditioning, Wifi.
- Prioritize adding missing essentials: Air conditioning, Wifi.
- Consider adding popular differentiators like Free parking on premises or TV to increase appeal.
- Highlight unique or less common amenities you offer (e.g., hot tub, dedicated workspace, EV charger) in your listing description and photos.
- Regularly check competitor amenities in Chuburná to stay competitive.
Chuburná Airbnb Guest Demographics & Profile Analysis (2026)
Guest Profile Summary for Chuburná
- The typical guest profile for Airbnb in Chuburná consists of primarily domestic travelers (77%), often arriving from nearby Mérida, typically belonging to the Post-2000s (Gen Z/Alpha) group (50%), primarily speaking Spanish or English.
- Domestic travelers account for 77.3% of guests.
- Key international markets include Mexico (77.3%) and United States (14.8%).
- Top languages spoken are Spanish (46.7%) followed by English (37.3%).
- A significant demographic segment is the Post-2000s (Gen Z/Alpha) group, representing 50% of guests.
Recommendations for Hosts
- Target domestic marketing efforts towards travelers from Mérida and Mexico City.
- Tailor amenities and listing descriptions to appeal to the dominant Post-2000s (Gen Z/Alpha) demographic (e.g., highlight fast WiFi, smart home features, local guides).
- Highlight unique local experiences or amenities relevant to the primary guest profile.
- Consider seasonal promotions aligned with peak travel times for key origin markets.
Nearby Short-Term Rental Market Comparison
How does the Chuburná Airbnb market stack up against its neighbors? Compare key performance metrics like average monthly revenue, ADR, and occupancy rates in surrounding areas to understand the broader regional STR landscape.
| Market | Active Properties | Monthly Revenue | Daily Rate | Avg. Occupancy |
|---|---|---|---|---|
| San Bruno | 20 | $2,028 | $269.55 | 32% |
| San Benito | 39 | $1,876 | $235.61 | 36% |
| Playa Uaymitun | 13 | $1,727 | $341.44 | 34% |
| Dzemul | 14 | $1,477 | $200.18 | 28% |
| Hunucmá | 105 | $1,377 | $179.58 | 33% |
| Chicxulub | 94 | $1,298 | $181.39 | 32% |
| Chicxulub Puerto | 282 | $1,162 | $191.44 | 32% |
| Chuburná Puerto | 58 | $1,106 | $128.13 | 35% |
| San Crisanto | 38 | $1,054 | $139.49 | 27% |
| Santa Clara | 19 | $976 | $150.25 | 20% |