Pios Beach Airbnb Market Analysis 2026: Short Term Rental Data & Vacation Rental Statistics in Bay of Plenty, New Zealand
Is Airbnb profitable in Pios Beach in 2026? Explore comprehensive Airbnb analytics for Pios Beach, Bay of Plenty, New Zealand to uncover income potential. This 2026 STR market report for Pios Beach, based on AirROI data from February 2025 to January 2026, reveals key trends in the niche market of 25 active listings.
Whether you're considering an Airbnb investment in Pios Beach, optimizing your existing vacation rental, or exploring rental arbitrage opportunities, understanding the Pios Beach Airbnb data is crucial. Leveraging the low regulation environment is key to maximizing your short term rental income potential. Let's dive into the specifics.
Key Pios Beach Airbnb Performance Metrics Overview
Monthly Airbnb Revenue Variations & Income Potential in Pios Beach (2026)
Understanding the monthly revenue variations for Airbnb listings in Pios Beach is key to maximizing your short term rental income potential. Seasonality significantly impacts earnings. Our analysis, based on data from the past 12 months, shows that the peak revenue month for STRs in Pios Beach is typically February, while September often presents the lowest earnings, highlighting opportunities for strategic pricing adjustments during shoulder and low seasons. Explore the typical Airbnb income in Pios Beach across different performance tiers:
- Best-in-class properties (Top 10%) achieve $3,876+ monthly, often utilizing dynamic pricing and superior guest experiences.
- Strong performing properties (Top 25%) earn $2,764 or more, indicating effective management and desirable locations/amenities.
- Typical properties (Median) generate around $1,617 per month, representing the average market performance.
- Entry-level properties (Bottom 25%) see earnings around $894, often with potential for optimization.
Average Monthly Airbnb Earnings Trend in Pios Beach
Pios Beach Airbnb Occupancy Rate Trends (2026)
Maximize your bookings by understanding the Pios Beach STR occupancy trends. Seasonal demand shifts significantly influence how often properties are booked. Typically, Februarysees the highest demand (peak season occupancy), while October experiences the lowest (low season). Effective strategies, like adjusting minimum stays or offering promotions, can boost occupancy during slower periods. Here's how different property tiers perform in Pios Beach:
- Best-in-class properties (Top 10%) achieve 58%+ occupancy, indicating high desirability and potentially optimized availability.
- Strong performing properties (Top 25%) maintain 42% or higher occupancy, suggesting good market fit and guest satisfaction.
- Typical properties (Median) have an occupancy rate around 25%.
- Entry-level properties (Bottom 25%) average 13% occupancy, potentially facing higher vacancy.
Average Monthly Occupancy Rate Trend in Pios Beach
Average Daily Rate (ADR) Airbnb Trends in Pios Beach (2026)
Effective short term rental pricing strategy in Pios Beach involves understanding monthly ADR fluctuations. The Average Daily Rate (ADR) for Airbnb in Pios Beach typically peaks in January and dips lowest during August. Leveraging Airbnb dynamic pricing tools or strategies based on this seasonality can significantly boost revenue. Here's a look at the typical nightly rates achieved:
- Best-in-class properties (Top 10%) command rates of $338+ per night, often due to premium features or locations.
- Strong performing properties (Top 25%) achieve nightly rates of $286 or more.
- Typical properties (Median) charge around $222 per night.
- Entry-level properties (Bottom 25%) earn around $158 per night.
Average Daily Rate (ADR) Trend by Month in Pios Beach
Get Live Pios Beach Market Intelligence 👇

Explore Real-time Analytics
Airbnb Seasonality Analysis & Trends in Pios Beach (2026)
Peak Season (February, December, March)
- Revenue averages $2,622 per month
- Occupancy rates average 39.1%
- Daily rates average $235
Shoulder Season
- Revenue averages $1,863 per month
- Occupancy maintains around 27.4%
- Daily rates hold near $228
Low Season (August, September, October)
- Revenue drops to average $1,512 per month
- Occupancy decreases to average 24.0%
- Daily rates adjust to average $218
Seasonality Insights for Pios Beach
- The Airbnb seasonality in Pios Beach shows highly seasonal trends requiring careful strategy. While the sections above show seasonal averages, it's also insightful to look at the extremes:
- During the high season, the absolute peak month showcases Pios Beach's highest earning potential, with monthly revenues capable of climbing to $2,909, occupancy reaching a high of 46.8%, and ADRs peaking at $260.
- Conversely, the slowest single month of the year, typically falling within the low season, marks the market's lowest point. In this month, revenue might dip to $1,482, occupancy could drop to 21.4%, and ADRs may adjust down to $211.
- Understanding both the seasonal averages and these monthly peaks and troughs in revenue, occupancy, and ADR is crucial for maximizing your Airbnb profit potential in Pios Beach.
Seasonal Strategies for Maximizing Profit
- Peak Season: Maximize revenue through premium pricing and potentially longer minimum stays. Ensure high availability.
- Low Season: Offer competitive pricing, special promotions (e.g., extended stay discounts), and flexible cancellation policies. Target off-season travelers like remote workers or budget-conscious guests.
- Shoulder Seasons: Implement dynamic pricing that balances peak and low rates. Target weekend travelers or specific events. Offer slightly more flexible terms than peak season.
- Regularly analyze your own performance against these Pios Beach seasonality benchmarks and adjust your pricing and availability strategy accordingly.
Best Areas for Airbnb Investment in Pios Beach (2026)
Exploring the top neighborhoods for short-term rentals in Pios Beach? This section highlights key areas, outlining why they are attractive for hosts and guests, along with notable local attractions. Consider these locations based on your target guest profile and investment strategy.
| Neighborhood / Area | Why Host Here? (Target Guests & Appeal) | Key Attractions & Landmarks |
|---|---|---|
| Mount Maunganui | Popular beach destination known for its stunning beaches, vibrant café culture, and outdoor activities. A top choice among tourists for relaxation and sports, especially surfing and hiking. | Mount Maunganui Beach, Maunganui Summit Track, Hot Pools, The Strand, Motuotau Island |
| Tauranga City | The largest city in the Bay of Plenty, offering a mix of urban living and beach access. Attracts both families and business travelers, with a variety of amenities and activities. | Tauranga Art Gallery, The Elms Mission Station, Mount Ngongotaha, Tauranga Harbour, Papamoa Beach |
| Papamoa | Family-friendly beach suburb known for its long stretches of golden sand and relaxed atmosphere. Ideal for families and beach lovers looking for a quieter experience. | Papamoa Beach, Papamoa Hills Regional Park, Gold Coast Mall, Fashion Island, Savage Memorial |
| Ohope Beach | Quieter and scenic beach location, perfect for those seeking a peaceful getaway. Known for its friendly community and beautiful coastal views. | Ohope Beach, Ohope Scenic Reserve, Ohiwa Harbour, Ohope International Golf Club, White Island Tours |
| Whakatane | A gateway to natural attractions, including White Island and an array of watersports. Popular with nature lovers and adventure seekers. | White Island Tours, Whakatane Heads, Muriwai Drive, Ohope Beach, Whakatane River |
| Kawerau | A small town with a strong connection to the geothermal energy sector and outdoor activities like rafting and hiking. An appealing option for adventurous guests. | Tarawera River, Kawerau River Trails, Mt Putauaki, Kawerau Thermal Pools, Rafting Adventures |
| Raglan | A bit off the beaten path, known for its surf culture and artistic community. Great for those looking to host a unique stay with a focus on outdoor activities. | Raglan Beach, Raglan Harbour, Te Toto Gorge, Surfing Spots, Raglan Arts |
| Whangamata | A popular holiday destination known for its stunning beaches and relaxed vibe, attracting holidaymakers looking for sun and surf. | Whangamata Beach, Whangamata Surf Club, The Whangamata Area, Local Cafés and Restaurants, Beachfront Markets |
Understanding Airbnb License Requirements & STR Laws in Pios Beach (2026)
While Pios Beach, Bay of Plenty, New Zealand currently shows low STR regulations, specific Airbnb license requirements might still exist or change. Always verify the latest short term rental regulations and Airbnb license requirements directly with local government authorities for Pios Beach to ensure full compliance before hosting.
(Source: AirROI data, 2026, finding no licensed listings among those analyzed)
Top Performing Airbnb Properties in Pios Beach (2026)
Benchmark your potential! Explore examples of top-performing Airbnb properties in Pios Beachbased on Trailing Twelve Month (TTM) revenue. Analyze their characteristics, revenue, occupancy rate, and ADR to understand what drives success in this market.

Reserve-front to two beaches with hot tub & fire
Entire Place • 4 bedrooms

The Barn, designers dream, romantic beach hideaway
Entire Place • 1 bedroom

Family beach house with pool
Entire Place • 4 bedrooms

#WaihiBeachHive❤️Huge Bach❤️300m to Beachfront
Entire Place • 7 bedrooms
Electric Beach Home.
Entire Place • 4 bedrooms
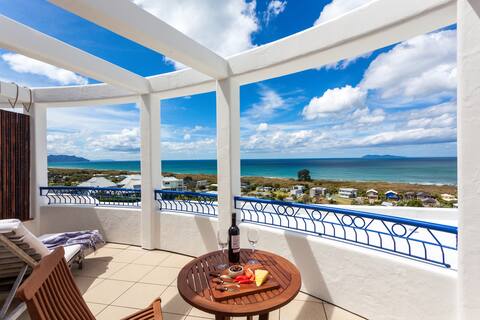
Santorini style apartment with stunning views!
Entire Place • 1 bedroom
Note: Performance varies based on location, size, amenities, seasonality, and management quality. Data reflects the past 12 months.
Top Performing Airbnb Hosts in Pios Beach (2026)
Learn from the best! This table showcases top-performing Airbnb hosts in Pios Beach based on the number of properties managed and estimated total revenue over the past year. Analyze their scale and performance metrics.
| Host Name | Properties | Grossing Revenue | Stay Reviews | Avg Rating |
|---|---|---|---|---|
| Jasmine | 4 | $131,647 | 737 | 4.82/5.0 |
| Hannah | 1 | $36,208 | 53 | 4.85/5.0 |
| Lynley | 1 | $34,694 | 158 | 4.95/5.0 |
| Ang | 1 | $28,796 | 29 | 4.72/5.0 |
| Kim | 1 | $21,706 | 28 | 4.71/5.0 |
| Lynette | 1 | $20,229 | 28 | 4.96/5.0 |
| Michelle | 1 | $19,545 | 57 | 4.91/5.0 |
| Bachcare | 3 | $15,672 | 5 | Not Rated |
| Susie | 1 | $14,802 | 1 | Not Rated |
| Nathan | 1 | $14,190 | 10 | 4.60/5.0 |
Analyzing the strategies of top hosts, such as their property selection, pricing, and guest communication, can offer valuable lessons for optimizing your own Airbnb operations in Pios Beach.
Dive Deeper: Advanced Pios Beach STR Market Data (2026)
Ready to unlock more insights? AirROI provides access to advanced metrics and comprehensive Airbnb data for Pios Beach. Explore detailed analytics beyond this report to refine your investment strategy, optimize pricing, and maximize your vacation rental profits.
Explore Advanced MetricsPios Beach Short-Term Rental Market Composition (2026): Property & Room Types
Room Type Distribution
Property Type Distribution
Market Composition Insights for Pios Beach
- The Pios Beach Airbnb market composition is heavily skewed towards Entire Home/Apt listings, which make up 96% of the 25 active rentals. This indicates strong guest preference for privacy and space.
- Looking at the property type distribution in Pios Beach, House properties are the most common (76%), reflecting the local real estate landscape.
- Houses represent a significant 76% portion, catering likely to families or larger groups.
- Smaller segments like hotel/boutique (combined 4.0%) offer potential for unique stay experiences.
Pios Beach Airbnb Room Capacity Analysis (2026): Bedroom Distribution
Distribution of Listings by Number of Bedrooms
Room Capacity Insights for Pios Beach
- The dominant room capacity in Pios Beach is 4 bedrooms listings, making up 36% of the market. This suggests a strong demand for properties suitable for families or small groups.
- Together, 4 bedrooms and 3 bedrooms properties represent 60.0% of the active Airbnb listings in Pios Beach, indicating a high concentration in these sizes.
- A significant 72.0% of listings offer 3+ bedrooms, catering to larger groups and families seeking more space in Pios Beach.
Pios Beach Vacation Rental Guest Capacity Trends (2026)
Distribution of Listings by Guest Capacity
Guest Capacity Insights for Pios Beach
- The most common guest capacity trend in Pios Beach vacation rentals is listings accommodating 8+ guests (52%). This suggests the primary traveler segment is likely larger groups.
- Properties designed for 8+ guests and 2 guests dominate the Pios Beach STR market, accounting for 72.0% of listings.
- 76.0% of properties accommodate 6+ guests, serving the market segment for larger families or group travel in Pios Beach.
- On average, properties in Pios Beach are equipped to host 6.2 guests.
Pios Beach Airbnb Booking Patterns (2026): Available vs. Booked Days
Available Days Distribution
Booked Days Distribution
Booking Pattern Insights for Pios Beach
- The most common availability pattern in Pios Beach falls within the 271-366 days range, representing 72% of listings. This suggests many properties have significant open periods on their calendars.
- Approximately 92.0% of listings show high availability (181+ days open annually), indicating potential for increased bookings or specific owner usage patterns.
- For booked days, the 31-90 days range is most frequent in Pios Beach (40%), reflecting common guest stay durations or potential owner blocking patterns.
- A notable 8.0% of properties secure long booking periods (181+ days booked per year), highlighting successful long-term rental strategies or significant owner usage.
Pios Beach Airbnb Minimum Stay Requirements Analysis
Distribution of Listings by Minimum Night Requirement
1 Night
4 listings
16% of total
2 Nights
12 listings
48% of total
4-6 Nights
1 listings
4% of total
30+ Nights
8 listings
32% of total
Key Insights
- The most prevalent minimum stay requirement in Pios Beach is 2 Nights, adopted by 48% of listings. This highlights the market's preference for shorter, flexible bookings.
- A strong majority (64.0%) of the Pios Beach Airbnb data shows acceptance of very short stays (1-2 nights), indicating a dynamic, high-turnover market.
- A significant segment (32%) caters to monthly stays (30+ nights) in Pios Beach, pointing to opportunities in the extended-stay market.
Recommendations
- Align with the market by considering a 2 Nights minimum stay, as 48% of Pios Beach hosts use this setting.
- If feasible, allowing 1-night stays, especially midweek or during low season, could capture last-minute bookings, as only 16% currently do.
- A 2-night minimum appears standard (48%). Consider this for weekends or peak periods.
- Explore offering discounts for stays of 30+ nights to attract the 32% of the market seeking extended stays.
- Adjust minimum nights based on seasonality – potentially shorter during low season and longer during peak demand periods in Pios Beach.
Pios Beach Airbnb Cancellation Policy Trends Analysis (2026)
Super Strict 60 Days
1 listings
4% of total
Flexible
7 listings
28% of total
Moderate
5 listings
20% of total
Firm
12 listings
48% of total
Cancellation Policy Insights for Pios Beach
- The prevailing Airbnb cancellation policy trend in Pios Beach is Firm, used by 48% of listings.
- There's a relatively balanced mix between guest-friendly (48.0%) and stricter (48.0%) policies, offering choices for different guest needs.
Recommendations for Hosts
- Consider adopting a Firm policy to align with the 48% market standard in Pios Beach.
- Regularly review your cancellation policy against competitors and market demand shifts in Pios Beach.
Pios Beach STR Booking Lead Time Analysis (2026)
Average Booking Lead Time by Month
Booking Lead Time Insights for Pios Beach
- The overall average booking lead time for vacation rentals in Pios Beach is 57 days.
- Guests book furthest in advance for stays during January (average 108 days), likely coinciding with peak travel demand or local events.
- The shortest booking windows occur for stays in September (average 28 days), indicating more last-minute travel plans during this time.
- Seasonally, Winter (75 days avg.) sees the longest lead times, while Summer (40 days avg.) has the shortest, reflecting typical travel planning cycles.
Recommendations for Hosts
- Use the overall average lead time (57 days) as a baseline for your pricing and availability strategy in Pios Beach.
- For January stays, consider implementing length-of-stay discounts or slightly higher rates for bookings made less than 108 days out to capitalize on advance planning.
- Target marketing efforts for the Winter season well in advance (at least 75 days) to capture early planners.
- Monitor your own booking lead times against these Pios Beach averages to identify opportunities for dynamic pricing adjustments.
Popular & Essential Airbnb Amenities in Pios Beach (2026)
Amenity Prevalence
Amenity Insights for Pios Beach
- Essential amenities in Pios Beach that guests expect include: Free parking on premises. Lacking these (this) could significantly impact bookings.
- Popular amenities like TV, Kitchen, Smoke alarm are common but not universal. Offering these can provide a competitive edge.
- Warning: Wifi is not universally provided but is considered essential globally. Ensure reliable Wifi is offered.
Recommendations for Hosts
- Ensure your listing includes all essential amenities for Pios Beach: Free parking on premises.
- Prioritize adding missing essentials: Free parking on premises.
- Consider adding popular differentiators like TV or Kitchen to increase appeal.
- Highlight unique or less common amenities you offer (e.g., hot tub, dedicated workspace, EV charger) in your listing description and photos.
- Regularly check competitor amenities in Pios Beach to stay competitive.
Pios Beach Airbnb Guest Demographics & Profile Analysis (2026)
Guest Profile Summary for Pios Beach
- The typical guest profile for Airbnb in Pios Beach consists of primarily domestic travelers (84%), often arriving from nearby Auckland, typically belonging to the Post-2000s (Gen Z/Alpha) group (50%), primarily speaking English or Spanish.
- Domestic travelers account for 84.2% of guests.
- Key international markets include New Zealand (84.2%) and Australia (5.3%).
- Top languages spoken are English (80%) followed by Spanish (5%).
- A significant demographic segment is the Post-2000s (Gen Z/Alpha) group, representing 50% of guests.
Recommendations for Hosts
- Target domestic marketing efforts towards travelers from Auckland and Waikato.
- Tailor amenities and listing descriptions to appeal to the dominant Post-2000s (Gen Z/Alpha) demographic (e.g., highlight fast WiFi, smart home features, local guides).
- Highlight unique local experiences or amenities relevant to the primary guest profile.
- Consider seasonal promotions aligned with peak travel times for key origin markets.
Nearby Short-Term Rental Market Comparison
How does the Pios Beach Airbnb market stack up against its neighbors? Compare key performance metrics like average monthly revenue, ADR, and occupancy rates in surrounding areas to understand the broader regional STR landscape.
| Market | Active Properties | Monthly Revenue | Daily Rate | Avg. Occupancy |
|---|---|---|---|---|
| Hot Water Beach | 27 | $2,949 | $257.55 | 50% |
| Tikitere | 15 | $2,599 | $238.84 | 48% |
| Hamurana | 28 | $2,555 | $170.74 | 50% |
| Lake Tarawera | 35 | $2,411 | $302.59 | 38% |
| Te Kūiti | 17 | $2,391 | $126.21 | 59% |
| Waiheke | 580 | $2,274 | $338.47 | 32% |
| Hahei | 104 | $2,241 | $260.25 | 39% |
| Ngongotahā | 79 | $2,152 | $194.15 | 44% |
| Okere Falls | 32 | $2,118 | $246.61 | 37% |
| Rotorua | 689 | $2,021 | $160.41 | 47% |