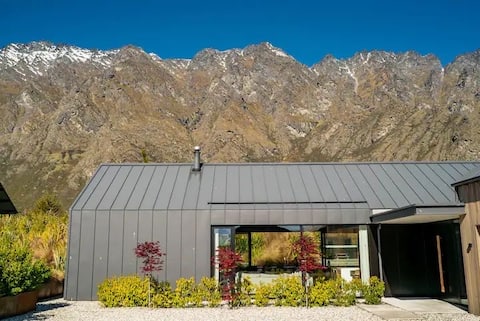
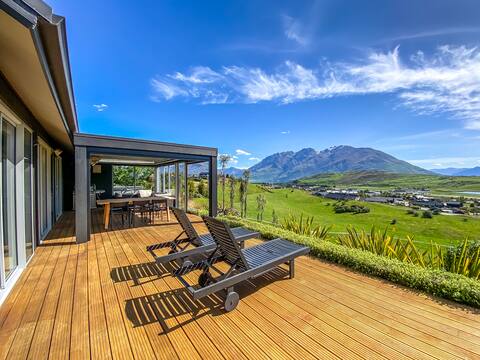
Jacks Point Airbnb Market Analysis 2026: Short Term Rental Data & Vacation Rental Statistics in Otago, New Zealand
Is Airbnb profitable in Jacks Point in 2026? Explore comprehensive Airbnb analytics for Jacks Point, Otago, New Zealand to uncover income potential. This 2026 STR market report for Jacks Point, based on AirROI data from February 2025 to January 2026, reveals key trends in the market of 217 active listings.
Whether you're considering an Airbnb investment in Jacks Point, optimizing your existing vacation rental, or exploring rental arbitrage opportunities, understanding the Jacks Point Airbnb data is crucial. Leveraging the low regulation environment is key to maximizing your short term rental income potential. Let's dive into the specifics.
Key Jacks Point Airbnb Performance Metrics Overview
Monthly Airbnb Revenue Variations & Income Potential in Jacks Point (2026)
Understanding the monthly revenue variations for Airbnb listings in Jacks Point is key to maximizing your short term rental income potential. Seasonality significantly impacts earnings. Our analysis, based on data from the past 12 months, shows that the peak revenue month for STRs in Jacks Point is typically July, while May often presents the lowest earnings, highlighting opportunities for strategic pricing adjustments during shoulder and low seasons. Explore the typical Airbnb income in Jacks Point across different performance tiers:
- Best-in-class properties (Top 10%) achieve $7,742+ monthly, often utilizing dynamic pricing and superior guest experiences.
- Strong performing properties (Top 25%) earn $4,570 or more, indicating effective management and desirable locations/amenities.
- Typical properties (Median) generate around $2,716 per month, representing the average market performance.
- Entry-level properties (Bottom 25%) see earnings around $1,614, often with potential for optimization.
Average Monthly Airbnb Earnings Trend in Jacks Point
Jacks Point Airbnb Occupancy Rate Trends (2026)
Maximize your bookings by understanding the Jacks Point STR occupancy trends. Seasonal demand shifts significantly influence how often properties are booked. Typically, Decembersees the highest demand (peak season occupancy), while May experiences the lowest (low season). Effective strategies, like adjusting minimum stays or offering promotions, can boost occupancy during slower periods. Here's how different property tiers perform in Jacks Point:
- Best-in-class properties (Top 10%) achieve 90%+ occupancy, indicating high desirability and potentially optimized availability.
- Strong performing properties (Top 25%) maintain 78% or higher occupancy, suggesting good market fit and guest satisfaction.
- Typical properties (Median) have an occupancy rate around 57%.
- Entry-level properties (Bottom 25%) average 31% occupancy, potentially facing higher vacancy.
Average Monthly Occupancy Rate Trend in Jacks Point
Average Daily Rate (ADR) Airbnb Trends in Jacks Point (2026)
Effective short term rental pricing strategy in Jacks Point involves understanding monthly ADR fluctuations. The Average Daily Rate (ADR) for Airbnb in Jacks Point typically peaks in December and dips lowest during May. Leveraging Airbnb dynamic pricing tools or strategies based on this seasonality can significantly boost revenue. Here's a look at the typical nightly rates achieved:
- Best-in-class properties (Top 10%) command rates of $554+ per night, often due to premium features or locations.
- Strong performing properties (Top 25%) achieve nightly rates of $374 or more.
- Typical properties (Median) charge around $220 per night.
- Entry-level properties (Bottom 25%) earn around $112 per night.
Average Daily Rate (ADR) Trend by Month in Jacks Point
Get Live Jacks Point Market Intelligence 👇

Explore Real-time Analytics
Airbnb Seasonality Analysis & Trends in Jacks Point (2026)
Peak Season (July, August, December)
- Revenue averages $4,736 per month
- Occupancy rates average 60.0%
- Daily rates average $297
Shoulder Season
- Revenue averages $3,673 per month
- Occupancy maintains around 54.4%
- Daily rates hold near $290
Low Season (April, May, October)
- Revenue drops to average $2,972 per month
- Occupancy decreases to average 47.9%
- Daily rates adjust to average $279
Seasonality Insights for Jacks Point
- The Airbnb seasonality in Jacks Point shows moderate seasonality with distinct peak and low periods. While the sections above show seasonal averages, it's also insightful to look at the extremes:
- During the high season, the absolute peak month showcases Jacks Point's highest earning potential, with monthly revenues capable of climbing to $5,007, occupancy reaching a high of 63.1%, and ADRs peaking at $305.
- Conversely, the slowest single month of the year, typically falling within the low season, marks the market's lowest point. In this month, revenue might dip to $2,501, occupancy could drop to 37.2%, and ADRs may adjust down to $274.
- Understanding both the seasonal averages and these monthly peaks and troughs in revenue, occupancy, and ADR is crucial for maximizing your Airbnb profit potential in Jacks Point.
Seasonal Strategies for Maximizing Profit
- Peak Season: Maximize revenue through premium pricing and potentially longer minimum stays. Ensure high availability.
- Low Season: Offer competitive pricing, special promotions (e.g., extended stay discounts), and flexible cancellation policies. Target off-season travelers like remote workers or budget-conscious guests.
- Shoulder Seasons: Implement dynamic pricing that balances peak and low rates. Target weekend travelers or specific events. Offer slightly more flexible terms than peak season.
- Regularly analyze your own performance against these Jacks Point seasonality benchmarks and adjust your pricing and availability strategy accordingly.
Best Areas for Airbnb Investment in Jacks Point (2026)
Exploring the top neighborhoods for short-term rentals in Jacks Point? This section highlights key areas, outlining why they are attractive for hosts and guests, along with notable local attractions. Consider these locations based on your target guest profile and investment strategy.
| Neighborhood / Area | Why Host Here? (Target Guests & Appeal) | Key Attractions & Landmarks |
|---|---|---|
| Lake Jacks Point | Stunning natural beauty surrounding the lake, popular for outdoor activities and water sports. A must-visit for tourists looking to enjoy the tranquil lakeside experience. | Jacks Point Golf Course, Lake Wakatipu, Queenstown Trail, Biking and hiking trails, Water sports activities |
| Jacks Point Village | A growing community with modern amenities and proximity to Queenstown. Great for families and visitors seeking a relaxed atmosphere with easy access to adventure sports. | Jacks Point Clubhouse, Local cafes and shops, Hiking trails, Community events |
| Shotover River | Renowned for its thrilling jet boating and rafting experiences. Attracts adventure-seeking tourists looking to explore New Zealand's rugged beauty. | Shotover Jet, Rafting tours, Scenic viewpoints, Historical gold mining sites |
| Five Mile | A shopping and entertainment hub conveniently located near Queenstown. Ideal for those wanting easy access to retail, dining, and outdoor adventures. | Queenstown Events Centre, Shopping centres, Restaurants and bars |
| Arrowtown | Historic gold mining town with charming streets and rich heritage. Popular for its picturesque scenery and vibrant autumn colors. | Arrowtown Historic Village, Goldfields Mining Centre, Walking paths, Cafes and boutiques |
| Queenstown Central | The heart of Queenstown with an energetic vibe, restaurants, and nightlife. Highly sought after by tourists for its accessibility to various attractions. | Skyline Queenstown, Queenstown Gardens, Lake Wakatipu waterfront, Shopping and dining, Adventure tourism |
| Coronet Peak | Famous ski resort and year-round outdoor destination. Attracts ski enthusiasts and summer hikers alike, providing a variety of experiences. | Skiing and snowboarding, Mountain biking, Hiking trails, Visitor facilities |
| Glenorchy | Gateway to the incredible landscapes of Fiordland and Tasman National Parks. Perfect for nature lovers and those seeking remote adventures. | Glenorchy Wharf, Lords of the Rings film locations, Hiking trails, Horse riding tours |
Understanding Airbnb License Requirements & STR Laws in Jacks Point (2026)
While Jacks Point, Otago, New Zealand currently shows low STR regulations, specific Airbnb license requirements might still exist or change. Always verify the latest short term rental regulations and Airbnb license requirements directly with local government authorities for Jacks Point to ensure full compliance before hosting.
(Source: AirROI data, 2026, based on 0% licensed listings)
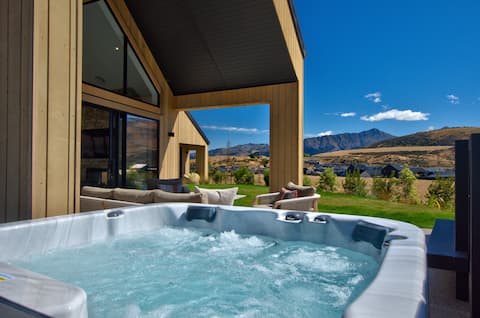
Top Performing Airbnb Properties in Jacks Point (2026)
Benchmark your potential! Explore examples of top-performing Airbnb properties in Jacks Pointbased on Trailing Twelve Month (TTM) revenue. Analyze their characteristics, revenue, occupancy rate, and ADR to understand what drives success in this market.
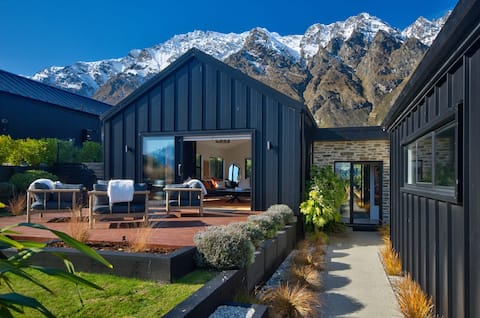
Glenfiddich Retreat - Jacks Point Luxury
Entire Place • 6 bedrooms
Hawkstone Stunning property in Jacks Point
Entire Place • 5 bedrooms
Wakeup to the majestic views of snow capped peaks
Entire Place • 3 bedrooms
Shinglehouse Queenstown remarkable mountain views.
Entire Place • 3 bedrooms
Horoeka House Stunning views and spa Pool
Entire Place • 4 bedrooms

Ellesmere Lodge - Ski & Golf
Entire Place • 3 bedrooms
Note: Performance varies based on location, size, amenities, seasonality, and management quality. Data reflects the past 12 months.
Top Performing Airbnb Hosts in Jacks Point (2026)
Learn from the best! This table showcases top-performing Airbnb hosts in Jacks Point based on the number of properties managed and estimated total revenue over the past year. Analyze their scale and performance metrics.
| Host Name | Properties | Grossing Revenue | Stay Reviews | Avg Rating |
|---|---|---|---|---|
| Deborah | 7 | $556,051 | 132 | 4.96/5.0 |
| Gary | 7 | $275,579 | 550 | 4.85/5.0 |
| Anji | 1 | $202,488 | 106 | 4.98/5.0 |
| Divine Property Management | 4 | $186,434 | 63 | 4.92/5.0 |
| Element Escapes | 5 | $182,180 | 128 | 4.80/5.0 |
| Hello Queenstown | 4 | $177,885 | 104 | 4.87/5.0 |
| New Zealand Sothebys Internati | 3 | $147,782 | 8 | 5.00/5.0 |
| Stephanie & Leonie Queenstown | 5 | $146,632 | 61 | 4.92/5.0 |
| Annekarien | 3 | $127,044 | 90 | 4.99/5.0 |
| Michael | 3 | $124,688 | 158 | 4.93/5.0 |
Analyzing the strategies of top hosts, such as their property selection, pricing, and guest communication, can offer valuable lessons for optimizing your own Airbnb operations in Jacks Point.
Dive Deeper: Advanced Jacks Point STR Market Data (2026)
Ready to unlock more insights? AirROI provides access to advanced metrics and comprehensive Airbnb data for Jacks Point. Explore detailed analytics beyond this report to refine your investment strategy, optimize pricing, and maximize your vacation rental profits.
Explore Advanced MetricsJacks Point Short-Term Rental Market Composition (2026): Property & Room Types
Room Type Distribution
Property Type Distribution
Market Composition Insights for Jacks Point
- The Jacks Point Airbnb market composition is heavily skewed towards Entire Home/Apt listings, which make up 82.9% of the 217 active rentals. This indicates strong guest preference for privacy and space.
- Looking at the property type distribution in Jacks Point, House properties are the most common (71%), reflecting the local real estate landscape.
- Houses represent a significant 71% portion, catering likely to families or larger groups.
- The presence of 8.3% Hotel/Boutique listings indicates integration with traditional hospitality.
Jacks Point Airbnb Room Capacity Analysis (2026): Bedroom Distribution
Distribution of Listings by Number of Bedrooms
Room Capacity Insights for Jacks Point
- The dominant room capacity in Jacks Point is 3 bedrooms listings, making up 30.4% of the market. This suggests a strong demand for properties suitable for families or small groups.
- Together, 3 bedrooms and 1 bedroom properties represent 56.2% of the active Airbnb listings in Jacks Point, indicating a high concentration in these sizes.
- A significant 46.0% of listings offer 3+ bedrooms, catering to larger groups and families seeking more space in Jacks Point.
Jacks Point Vacation Rental Guest Capacity Trends (2026)
Distribution of Listings by Guest Capacity
Guest Capacity Insights for Jacks Point
- The most common guest capacity trend in Jacks Point vacation rentals is listings accommodating 6 guests (25.8%). This suggests the primary traveler segment is likely larger groups.
- Properties designed for 6 guests and 4 guests dominate the Jacks Point STR market, accounting for 44.2% of listings.
- 42.9% of properties accommodate 6+ guests, serving the market segment for larger families or group travel in Jacks Point.
- On average, properties in Jacks Point are equipped to host 4.4 guests.
Jacks Point Airbnb Booking Patterns (2026): Available vs. Booked Days
Available Days Distribution
Booked Days Distribution
Booking Pattern Insights for Jacks Point
- The most common availability pattern in Jacks Point falls within the 271-366 days range, representing 41% of listings. This suggests many properties have significant open periods on their calendars.
- Approximately 64.0% of listings show high availability (181+ days open annually), indicating potential for increased bookings or specific owner usage patterns.
- For booked days, the 91-180 days range is most frequent in Jacks Point (26.7%), reflecting common guest stay durations or potential owner blocking patterns.
- A notable 36.0% of properties secure long booking periods (181+ days booked per year), highlighting successful long-term rental strategies or significant owner usage.
Jacks Point Airbnb Minimum Stay Requirements Analysis
Distribution of Listings by Minimum Night Requirement
1 Night
32 listings
14.7% of total
2 Nights
33 listings
15.2% of total
3 Nights
25 listings
11.5% of total
4-6 Nights
30 listings
13.8% of total
7-29 Nights
2 listings
0.9% of total
30+ Nights
95 listings
43.8% of total
Key Insights
- The most prevalent minimum stay requirement in Jacks Point is 30+ Nights, adopted by 43.8% of listings. This highlights the market's preference for longer commitments.
- A significant segment (43.8%) caters to monthly stays (30+ nights) in Jacks Point, pointing to opportunities in the extended-stay market.
Recommendations
- Align with the market by considering a 30+ Nights minimum stay, as 43.8% of Jacks Point hosts use this setting.
- If feasible, allowing 1-night stays, especially midweek or during low season, could capture last-minute bookings, as only 14.7% currently do.
- Explore offering discounts for stays of 30+ nights to attract the 43.8% of the market seeking extended stays.
- Adjust minimum nights based on seasonality – potentially shorter during low season and longer during peak demand periods in Jacks Point.
Jacks Point Airbnb Cancellation Policy Trends Analysis (2026)
Limited
3 listings
1.4% of total
Super Strict 30 Days
17 listings
7.9% of total
Flexible
35 listings
16.3% of total
Moderate
60 listings
27.9% of total
Firm
87 listings
40.5% of total
Strict
13 listings
6% of total
Cancellation Policy Insights for Jacks Point
- The prevailing Airbnb cancellation policy trend in Jacks Point is Firm, used by 40.5% of listings.
- There's a relatively balanced mix between guest-friendly (44.2%) and stricter (46.5%) policies, offering choices for different guest needs.
- Strict cancellation policies are quite rare (6%), potentially making listings with this policy less competitive unless justified by high demand or property type.
Recommendations for Hosts
- Consider adopting a Firm policy to align with the 40.5% market standard in Jacks Point.
- Using a Strict policy might deter some guests, as only 6% of listings use it. Evaluate if potential revenue protection outweighs possible lower booking rates.
- Regularly review your cancellation policy against competitors and market demand shifts in Jacks Point.
Jacks Point STR Booking Lead Time Analysis (2026)
Average Booking Lead Time by Month
Booking Lead Time Insights for Jacks Point
- The overall average booking lead time for vacation rentals in Jacks Point is 56 days.
- Guests book furthest in advance for stays during November (average 76 days), likely coinciding with peak travel demand or local events.
- The shortest booking windows occur for stays in May (average 34 days), indicating more last-minute travel plans during this time.
- Seasonally, Fall (59 days avg.) sees the longest lead times, while Spring (42 days avg.) has the shortest, reflecting typical travel planning cycles.
Recommendations for Hosts
- Use the overall average lead time (56 days) as a baseline for your pricing and availability strategy in Jacks Point.
- For November stays, consider implementing length-of-stay discounts or slightly higher rates for bookings made less than 76 days out to capitalize on advance planning.
- Target marketing efforts for the Fall season well in advance (at least 59 days) to capture early planners.
- Monitor your own booking lead times against these Jacks Point averages to identify opportunities for dynamic pricing adjustments.
Popular & Essential Airbnb Amenities in Jacks Point (2026)
Amenity Prevalence
Amenity Insights for Jacks Point
- Essential amenities in Jacks Point that guests expect include: Wifi. Lacking these (this) could significantly impact bookings.
- Popular amenities like Smoke alarm, Hot water, Heating are common but not universal. Offering these can provide a competitive edge.
Recommendations for Hosts
- Ensure your listing includes all essential amenities for Jacks Point: Wifi.
- Prioritize adding missing essentials: Wifi.
- Consider adding popular differentiators like Smoke alarm or Hot water to increase appeal.
- Highlight unique or less common amenities you offer (e.g., hot tub, dedicated workspace, EV charger) in your listing description and photos.
- Regularly check competitor amenities in Jacks Point to stay competitive.
Jacks Point Airbnb Guest Demographics & Profile Analysis (2026)
Guest Profile Summary for Jacks Point
- The typical guest profile for Airbnb in Jacks Point consists of predominantly international visitors (71%), with top international origins including Australia, typically belonging to the Post-2000s (Gen Z/Alpha) group (50%), primarily speaking English or Chinese.
- Domestic travelers account for 29.2% of guests.
- Key international markets include New Zealand (29.2%) and Australia (28.8%).
- Top languages spoken are English (57.3%) followed by Chinese (11.9%).
- A significant demographic segment is the Post-2000s (Gen Z/Alpha) group, representing 50% of guests.
Recommendations for Hosts
- Focus marketing internationally, particularly towards travelers from Australia.
- Tailor amenities and listing descriptions to appeal to the dominant Post-2000s (Gen Z/Alpha) demographic (e.g., highlight fast WiFi, smart home features, local guides).
- Highlight unique local experiences or amenities relevant to the primary guest profile.
- Consider seasonal promotions aligned with peak travel times for key origin markets.
Nearby Short-Term Rental Market Comparison
How does the Jacks Point Airbnb market stack up against its neighbors? Compare key performance metrics like average monthly revenue, ADR, and occupancy rates in surrounding areas to understand the broader regional STR landscape.
| Market | Active Properties | Monthly Revenue | Daily Rate | Avg. Occupancy |
|---|---|---|---|---|
| Queenstown | 2,391 | $4,767 | $355.38 | 55% |
| Ben Ohau | 14 | $4,707 | $224.83 | 72% |
| Kawarau Falls | 23 | $4,070 | $508.60 | 49% |
| Speargrass Flat | 15 | $3,817 | $522.43 | 50% |
| Closeburn | 10 | $3,606 | $291.60 | 54% |
| Arrow Junction | 19 | $3,571 | $314.34 | 54% |
| Arrowtown | 186 | $2,813 | $325.59 | 46% |
| Millbrook | 23 | $2,808 | $366.17 | 38% |
| Arthurs Point | 43 | $2,658 | $268.64 | 47% |
| Wānaka | 1,143 | $2,641 | $281.00 | 45% |