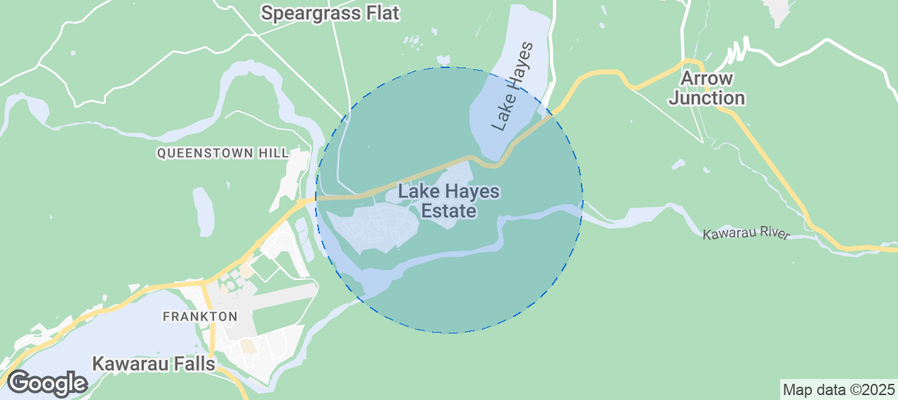
Lake Hayes Estate Airbnb Market Analysis 2026: Short Term Rental Data & Vacation Rental Statistics in Otago, New Zealand
Is Airbnb profitable in Lake Hayes Estate in 2026? Explore comprehensive Airbnb analytics for Lake Hayes Estate, Otago, New Zealand to uncover income potential. This 2026 STR market report for Lake Hayes Estate, based on AirROI data from February 2025 to January 2026, reveals key trends in the niche market of 31 active listings.
Whether you're considering an Airbnb investment in Lake Hayes Estate, optimizing your existing vacation rental, or exploring rental arbitrage opportunities, understanding the Lake Hayes Estate Airbnb data is crucial. Leveraging the low regulation environment is key to maximizing your short term rental income potential. Let's dive into the specifics.
Key Lake Hayes Estate Airbnb Performance Metrics Overview
Monthly Airbnb Revenue Variations & Income Potential in Lake Hayes Estate (2026)
Understanding the monthly revenue variations for Airbnb listings in Lake Hayes Estate is key to maximizing your short term rental income potential. Seasonality significantly impacts earnings. Our analysis, based on data from the past 12 months, shows that the peak revenue month for STRs in Lake Hayes Estate is typically December, while May often presents the lowest earnings, highlighting opportunities for strategic pricing adjustments during shoulder and low seasons. Explore the typical Airbnb income in Lake Hayes Estate across different performance tiers:
- Best-in-class properties (Top 10%) achieve $5,007+ monthly, often utilizing dynamic pricing and superior guest experiences.
- Strong performing properties (Top 25%) earn $3,059 or more, indicating effective management and desirable locations/amenities.
- Typical properties (Median) generate around $1,756 per month, representing the average market performance.
- Entry-level properties (Bottom 25%) see earnings around $1,171, often with potential for optimization.
Average Monthly Airbnb Earnings Trend in Lake Hayes Estate
Lake Hayes Estate Airbnb Occupancy Rate Trends (2026)
Maximize your bookings by understanding the Lake Hayes Estate STR occupancy trends. Seasonal demand shifts significantly influence how often properties are booked. Typically, Februarysees the highest demand (peak season occupancy), while May experiences the lowest (low season). Effective strategies, like adjusting minimum stays or offering promotions, can boost occupancy during slower periods. Here's how different property tiers perform in Lake Hayes Estate:
- Best-in-class properties (Top 10%) achieve 85%+ occupancy, indicating high desirability and potentially optimized availability.
- Strong performing properties (Top 25%) maintain 72% or higher occupancy, suggesting good market fit and guest satisfaction.
- Typical properties (Median) have an occupancy rate around 58%.
- Entry-level properties (Bottom 25%) average 37% occupancy, potentially facing higher vacancy.
Average Monthly Occupancy Rate Trend in Lake Hayes Estate
Average Daily Rate (ADR) Airbnb Trends in Lake Hayes Estate (2026)
Effective short term rental pricing strategy in Lake Hayes Estate involves understanding monthly ADR fluctuations. The Average Daily Rate (ADR) for Airbnb in Lake Hayes Estate typically peaks in December and dips lowest during March. Leveraging Airbnb dynamic pricing tools or strategies based on this seasonality can significantly boost revenue. Here's a look at the typical nightly rates achieved:
- Best-in-class properties (Top 10%) command rates of $386+ per night, often due to premium features or locations.
- Strong performing properties (Top 25%) achieve nightly rates of $240 or more.
- Typical properties (Median) charge around $130 per night.
- Entry-level properties (Bottom 25%) earn around $91 per night.
Average Daily Rate (ADR) Trend by Month in Lake Hayes Estate
Get Live Lake Hayes Estate Market Intelligence 👇
Explore Real-time Analytics
Airbnb Seasonality Analysis & Trends in Lake Hayes Estate (2026)
Peak Season (December, January, November)
- Revenue averages $3,432 per month
- Occupancy rates average 63.2%
- Daily rates average $209
Shoulder Season
- Revenue averages $2,323 per month
- Occupancy maintains around 60.5%
- Daily rates hold near $176
Low Season (April, May, June)
- Revenue drops to average $1,342 per month
- Occupancy decreases to average 34.2%
- Daily rates adjust to average $170
Seasonality Insights for Lake Hayes Estate
- The Airbnb seasonality in Lake Hayes Estate shows highly seasonal trends requiring careful strategy. While the sections above show seasonal averages, it's also insightful to look at the extremes:
- During the high season, the absolute peak month showcases Lake Hayes Estate's highest earning potential, with monthly revenues capable of climbing to $4,270, occupancy reaching a high of 82.4%, and ADRs peaking at $210.
- Conversely, the slowest single month of the year, typically falling within the low season, marks the market's lowest point. In this month, revenue might dip to $625, occupancy could drop to 20.0%, and ADRs may adjust down to $166.
- Understanding both the seasonal averages and these monthly peaks and troughs in revenue, occupancy, and ADR is crucial for maximizing your Airbnb profit potential in Lake Hayes Estate.
Seasonal Strategies for Maximizing Profit
- Peak Season: Maximize revenue through premium pricing and potentially longer minimum stays. Ensure high availability.
- Low Season: Offer competitive pricing, special promotions (e.g., extended stay discounts), and flexible cancellation policies. Target off-season travelers like remote workers or budget-conscious guests.
- Shoulder Seasons: Implement dynamic pricing that balances peak and low rates. Target weekend travelers or specific events. Offer slightly more flexible terms than peak season.
- Regularly analyze your own performance against these Lake Hayes Estate seasonality benchmarks and adjust your pricing and availability strategy accordingly.
Best Areas for Airbnb Investment in Lake Hayes Estate (2026)
Exploring the top neighborhoods for short-term rentals in Lake Hayes Estate? This section highlights key areas, outlining why they are attractive for hosts and guests, along with notable local attractions. Consider these locations based on your target guest profile and investment strategy.
| Neighborhood / Area | Why Host Here? (Target Guests & Appeal) | Key Attractions & Landmarks |
|---|---|---|
| Lake Hayes | Beautiful lakeside setting with stunning views of the surrounding mountains. Popular for outdoor activities like hiking, biking, and boating. Great for nature enthusiasts looking for a serene getaway. | Lake Hayes, Lake Hayes Walkway, Biking Trails, Queenstown Bike Tours, Nearby wineries |
| Arrowtown | Historic gold rush town offering charming streets and rich history. Visitors enjoy exploring the quaint shops and enjoying outdoor activities such as hiking and biking nearby. | Arrowtown Village, Arrow River, Goldfields Mining Centre, Nearby skiing at Coronet Peak |
| Queenstown | A globally recognized adventure tourism destination with year-round activities, making it ideal for short-term rentals. Attracts travelers from all over the world seeking adventure and luxury. | Skyline Queenstown, Shotover River, Lake Wakatipu, Queenstown Gardens, Adventure activities |
| Glenorchy | Gateway to stunning natural landscapes, ideal for eco-tourism and adventure seekers. Offers scenic views and activities such as hiking the Routeburn Track. | Routeburn Track, Glenorchy Lagoon Boardwalk, Paradise, Film locations from The Lord of the Rings |
| Frankton | Close to Queenstown and local amenities, ideal for families and travelers wanting easy access to the airport and shopping areas. | Queenstown Airport, Frankton Marina, Shopping Centres, Café's and restaurants |
| Makarora | A small settlement offering stunning scenery and a starting point for outdoor adventures, famous for proximity to Mount Aspiring National Park. | Mount Aspiring National Park, Makarora River, Glacier Kayaking, Nearby hiking tracks |
| Cromwell | A popular destination known for its history and fruit orchards. Conveniently located for tourists traveling between Queenstown and Wanaka. | Central Otago Wine Region, Cromwell Heritage Precinct, Cromwell Racecourse |
| Wanaka | A stunning resort town known for its breathtaking lake and mountains, providing ample opportunities for both summer and winter tourism. | Lake Wanaka, Cardrona Ski Resort, Rippon Vineyard, Mount Iron |
Understanding Airbnb License Requirements & STR Laws in Lake Hayes Estate (2026)
While Lake Hayes Estate, Otago, New Zealand currently shows low STR regulations, specific Airbnb license requirements might still exist or change. Always verify the latest short term rental regulations and Airbnb license requirements directly with local government authorities for Lake Hayes Estate to ensure full compliance before hosting.
(Source: AirROI data, 2026, finding no licensed listings among those analyzed)
Top Performing Airbnb Properties in Lake Hayes Estate (2026)
Benchmark your potential! Explore examples of top-performing Airbnb properties in Lake Hayes Estatebased on Trailing Twelve Month (TTM) revenue. Analyze their characteristics, revenue, occupancy rate, and ADR to understand what drives success in this market.

Near new home with peaceful semi-rural outlook.
Entire Place • 4 bedrooms

Cosy 4 Bedroom Home
Entire Place • 4 bedrooms

Queenstown Sunny and private Walnut Grove Cottage
Entire Place • 2 bedrooms

Charming Retreat – Breathtaking Mountain Views
Entire Place • 3 bedrooms

Luxury 3-Bedroom House
Entire Place • 3 bedrooms

Cosy hideaway
Entire Place • 1 bedroom
Note: Performance varies based on location, size, amenities, seasonality, and management quality. Data reflects the past 12 months.
Top Performing Airbnb Hosts in Lake Hayes Estate (2026)
Learn from the best! This table showcases top-performing Airbnb hosts in Lake Hayes Estate based on the number of properties managed and estimated total revenue over the past year. Analyze their scale and performance metrics.
| Host Name | Properties | Grossing Revenue | Stay Reviews | Avg Rating |
|---|---|---|---|---|
| Harcourts Holiday Homes | 7 | $86,213 | 25 | 4.92/5.0 |
| Josh | 1 | $67,833 | 20 | 4.90/5.0 |
| Gary | 1 | $46,762 | 29 | 4.83/5.0 |
| Darren & Ali | 1 | $46,023 | 580 | 4.88/5.0 |
| Summit Stays LTD | 1 | $41,224 | 16 | 4.81/5.0 |
| Mangal | 1 | $27,346 | 1 | Not Rated |
| Gail | 1 | $26,124 | 158 | 4.95/5.0 |
| Margi | 1 | $24,558 | 570 | 4.95/5.0 |
| Karyn | 2 | $24,028 | 452 | 4.81/5.0 |
| Tracey | 1 | $20,116 | 110 | 4.97/5.0 |
Analyzing the strategies of top hosts, such as their property selection, pricing, and guest communication, can offer valuable lessons for optimizing your own Airbnb operations in Lake Hayes Estate.
Dive Deeper: Advanced Lake Hayes Estate STR Market Data (2026)
Ready to unlock more insights? AirROI provides access to advanced metrics and comprehensive Airbnb data for Lake Hayes Estate. Explore detailed analytics beyond this report to refine your investment strategy, optimize pricing, and maximize your vacation rental profits.
Explore Advanced MetricsLake Hayes Estate Short-Term Rental Market Composition (2026): Property & Room Types
Room Type Distribution
Property Type Distribution
Market Composition Insights for Lake Hayes Estate
- The Lake Hayes Estate Airbnb market composition is heavily skewed towards Entire Home/Apt listings, which make up 61.3% of the 31 active rentals. This indicates strong guest preference for privacy and space.
- However, a notable 38.7% share for Private Rooms suggests opportunities for budget-conscious travelers or hosts renting out spare rooms.
- Looking at the property type distribution in Lake Hayes Estate, House properties are the most common (64.5%), reflecting the local real estate landscape.
- Houses represent a significant 64.5% portion, catering likely to families or larger groups.
- The presence of 6.5% Hotel/Boutique listings indicates integration with traditional hospitality.
Lake Hayes Estate Airbnb Room Capacity Analysis (2026): Bedroom Distribution
Distribution of Listings by Number of Bedrooms
Room Capacity Insights for Lake Hayes Estate
- The dominant room capacity in Lake Hayes Estate is 1 bedroom listings, making up 19.4% of the market. This suggests a strong demand for properties suitable for couples or solo travelers.
- Together, 1 bedroom and 3 bedrooms properties represent 35.5% of the active Airbnb listings in Lake Hayes Estate, indicating a high concentration in these sizes.
- A significant 29.0% of listings offer 3+ bedrooms, catering to larger groups and families seeking more space in Lake Hayes Estate.
Lake Hayes Estate Vacation Rental Guest Capacity Trends (2026)
Distribution of Listings by Guest Capacity
Guest Capacity Insights for Lake Hayes Estate
- The most common guest capacity trend in Lake Hayes Estate vacation rentals is listings accommodating 2 guests (38.7%). This suggests the primary traveler segment is likely couples or solo travelers.
- Properties designed for 2 guests and 6 guests dominate the Lake Hayes Estate STR market, accounting for 61.3% of listings.
- 29.1% of properties accommodate 6+ guests, serving the market segment for larger families or group travel in Lake Hayes Estate.
- On average, properties in Lake Hayes Estate are equipped to host 2.8 guests.
Lake Hayes Estate Airbnb Booking Patterns (2026): Available vs. Booked Days
Available Days Distribution
Booked Days Distribution
Booking Pattern Insights for Lake Hayes Estate
- The most common availability pattern in Lake Hayes Estate falls within the 271-366 days range, representing 41.9% of listings. This suggests many properties have significant open periods on their calendars.
- Approximately 64.5% of listings show high availability (181+ days open annually), indicating potential for increased bookings or specific owner usage patterns.
- For booked days, the 181-270 days range is most frequent in Lake Hayes Estate (32.3%), reflecting common guest stay durations or potential owner blocking patterns.
- A notable 38.8% of properties secure long booking periods (181+ days booked per year), highlighting successful long-term rental strategies or significant owner usage.
Lake Hayes Estate Airbnb Minimum Stay Requirements Analysis
Distribution of Listings by Minimum Night Requirement
1 Night
10 listings
32.3% of total
2 Nights
3 listings
9.7% of total
3 Nights
1 listings
3.2% of total
4-6 Nights
4 listings
12.9% of total
30+ Nights
13 listings
41.9% of total
Key Insights
- The most prevalent minimum stay requirement in Lake Hayes Estate is 30+ Nights, adopted by 41.9% of listings. This highlights the market's preference for longer commitments.
- A significant segment (41.9%) caters to monthly stays (30+ nights) in Lake Hayes Estate, pointing to opportunities in the extended-stay market.
Recommendations
- Align with the market by considering a 30+ Nights minimum stay, as 41.9% of Lake Hayes Estate hosts use this setting.
- Explore offering discounts for stays of 30+ nights to attract the 41.9% of the market seeking extended stays.
- Adjust minimum nights based on seasonality – potentially shorter during low season and longer during peak demand periods in Lake Hayes Estate.
Lake Hayes Estate Airbnb Cancellation Policy Trends Analysis (2026)
Flexible
4 listings
12.9% of total
Moderate
8 listings
25.8% of total
Firm
14 listings
45.2% of total
Strict
5 listings
16.1% of total
Cancellation Policy Insights for Lake Hayes Estate
- The prevailing Airbnb cancellation policy trend in Lake Hayes Estate is Firm, used by 45.2% of listings.
- A majority (61.3%) of hosts in Lake Hayes Estate utilize Firm or Strict policies, indicating a market where hosts prioritize booking security.
Recommendations for Hosts
- Consider adopting a Firm policy to align with the 45.2% market standard in Lake Hayes Estate.
- Regularly review your cancellation policy against competitors and market demand shifts in Lake Hayes Estate.
Lake Hayes Estate STR Booking Lead Time Analysis (2026)
Average Booking Lead Time by Month
Booking Lead Time Insights for Lake Hayes Estate
- The overall average booking lead time for vacation rentals in Lake Hayes Estate is 51 days.
- Guests book furthest in advance for stays during November (average 90 days), likely coinciding with peak travel demand or local events.
- The shortest booking windows occur for stays in June (average 11 days), indicating more last-minute travel plans during this time.
- Seasonally, Fall (73 days avg.) sees the longest lead times, while Summer (35 days avg.) has the shortest, reflecting typical travel planning cycles.
Recommendations for Hosts
- Use the overall average lead time (51 days) as a baseline for your pricing and availability strategy in Lake Hayes Estate.
- For November stays, consider implementing length-of-stay discounts or slightly higher rates for bookings made less than 90 days out to capitalize on advance planning.
- During June, focus on last-minute booking availability and promotions, as guests book with very short notice (11 days avg.).
- Target marketing efforts for the Fall season well in advance (at least 73 days) to capture early planners.
- Monitor your own booking lead times against these Lake Hayes Estate averages to identify opportunities for dynamic pricing adjustments.
Popular & Essential Airbnb Amenities in Lake Hayes Estate (2026)
Amenity Prevalence
Amenity Insights for Lake Hayes Estate
- Essential amenities in Lake Hayes Estate that guests expect include: Smoke alarm, Wifi. Lacking these (any) could significantly impact bookings.
- Popular amenities like Heating, Hair dryer, Hangers are common but not universal. Offering these can provide a competitive edge.
Recommendations for Hosts
- Ensure your listing includes all essential amenities for Lake Hayes Estate: Smoke alarm, Wifi.
- Prioritize adding missing essentials: Wifi.
- Consider adding popular differentiators like Heating or Hair dryer to increase appeal.
- Highlight unique or less common amenities you offer (e.g., hot tub, dedicated workspace, EV charger) in your listing description and photos.
- Regularly check competitor amenities in Lake Hayes Estate to stay competitive.
Lake Hayes Estate Airbnb Guest Demographics & Profile Analysis (2026)
Guest Profile Summary for Lake Hayes Estate
- The typical guest profile for Airbnb in Lake Hayes Estate consists of a mix of domestic (38%) and international guests, with top international origins including Australia, typically belonging to the Post-2000s (Gen Z/Alpha) group (50%), primarily speaking English or Chinese.
- Domestic travelers account for 37.6% of guests.
- Key international markets include New Zealand (37.6%) and Australia (22.3%).
- Top languages spoken are English (63.8%) followed by Chinese (6.7%).
- A significant demographic segment is the Post-2000s (Gen Z/Alpha) group, representing 50% of guests.
Recommendations for Hosts
- Focus marketing internationally, particularly towards travelers from Australia.
- Tailor amenities and listing descriptions to appeal to the dominant Post-2000s (Gen Z/Alpha) demographic (e.g., highlight fast WiFi, smart home features, local guides).
- Highlight unique local experiences or amenities relevant to the primary guest profile.
- Consider seasonal promotions aligned with peak travel times for key origin markets.
Nearby Short-Term Rental Market Comparison
How does the Lake Hayes Estate Airbnb market stack up against its neighbors? Compare key performance metrics like average monthly revenue, ADR, and occupancy rates in surrounding areas to understand the broader regional STR landscape.
| Market | Active Properties | Monthly Revenue | Daily Rate | Avg. Occupancy |
|---|---|---|---|---|
| Queenstown | 2,391 | $4,767 | $355.38 | 55% |
| Ben Ohau | 14 | $4,707 | $224.83 | 72% |
| Kawarau Falls | 23 | $4,070 | $508.60 | 49% |
| Speargrass Flat | 15 | $3,817 | $522.43 | 50% |
| Closeburn | 10 | $3,606 | $291.60 | 54% |
| Arrow Junction | 19 | $3,571 | $314.34 | 54% |
| Arrowtown | 186 | $2,813 | $325.59 | 46% |
| Millbrook | 23 | $2,808 | $366.17 | 38% |
| Arthurs Point | 43 | $2,658 | $268.64 | 47% |
| Wānaka | 1,143 | $2,641 | $281.00 | 45% |