Acklam Airbnb Market Analysis 2025: Short Term Rental Data & Vacation Rental Statistics in England, United Kingdom
Is Airbnb profitable in Acklam in 2025? Explore comprehensive Airbnb analytics for Acklam, England, United Kingdom to uncover income potential. This 2025 STR market report for Acklam, based on AirROI data from October 2024 to September 2025, reveals key trends in the niche market of 18 active listings.
Whether you're considering an Airbnb investment in Acklam, optimizing your existing vacation rental, or exploring rental arbitrage opportunities, understanding the Acklam Airbnb data is crucial. Leveraging the low regulation environment is key to maximizing your short term rental income potential. Let's dive into the specifics.
Key Acklam Airbnb Performance Metrics Overview
Monthly Airbnb Revenue Variations & Income Potential in Acklam (2025)
Understanding the monthly revenue variations for Airbnb listings in Acklam is key to maximizing your short term rental income potential. Seasonality significantly impacts earnings. Our analysis, based on data from the past 12 months, shows that the peak revenue month for STRs in Acklam is typically August, while September often presents the lowest earnings, highlighting opportunities for strategic pricing adjustments during shoulder and low seasons. Explore the typical Airbnb income in Acklam across different performance tiers:
- Best-in-class properties (Top 10%) achieve $4,315+ monthly, often utilizing dynamic pricing and superior guest experiences.
- Strong performing properties (Top 25%) earn $2,331 or more, indicating effective management and desirable locations/amenities.
- Typical properties (Median) generate around $1,084 per month, representing the average market performance.
- Entry-level properties (Bottom 25%) see earnings around $571, often with potential for optimization.
Average Monthly Airbnb Earnings Trend in Acklam
Acklam Airbnb Occupancy Rate Trends (2025)
Maximize your bookings by understanding the Acklam STR occupancy trends. Seasonal demand shifts significantly influence how often properties are booked. Typically, Maysees the highest demand (peak season occupancy), while September experiences the lowest (low season). Effective strategies, like adjusting minimum stays or offering promotions, can boost occupancy during slower periods. Here's how different property tiers perform in Acklam:
- Best-in-class properties (Top 10%) achieve 65%+ occupancy, indicating high desirability and potentially optimized availability.
- Strong performing properties (Top 25%) maintain 36% or higher occupancy, suggesting good market fit and guest satisfaction.
- Typical properties (Median) have an occupancy rate around 19%.
- Entry-level properties (Bottom 25%) average 13% occupancy, potentially facing higher vacancy.
Average Monthly Occupancy Rate Trend in Acklam
Average Daily Rate (ADR) Airbnb Trends in Acklam (2025)
Effective short term rental pricing strategy in Acklam involves understanding monthly ADR fluctuations. The Average Daily Rate (ADR) for Airbnb in Acklam typically peaks in August and dips lowest during February. Leveraging Airbnb dynamic pricing tools or strategies based on this seasonality can significantly boost revenue. Here's a look at the typical nightly rates achieved:
- Best-in-class properties (Top 10%) command rates of $306+ per night, often due to premium features or locations.
- Strong performing properties (Top 25%) achieve nightly rates of $270 or more.
- Typical properties (Median) charge around $142 per night.
- Entry-level properties (Bottom 25%) earn around $96 per night.
Average Daily Rate (ADR) Trend by Month in Acklam
Get Live Acklam Market Intelligence 👇
Explore Real-time Analytics
Airbnb Seasonality Analysis & Trends in Acklam (2025)
Peak Season (August, April, May)
- Revenue averages $2,462 per month
- Occupancy rates average 38.3%
- Daily rates average $181
Shoulder Season
- Revenue averages $1,677 per month
- Occupancy maintains around 26.6%
- Daily rates hold near $168
Low Season (February, June, September)
- Revenue drops to average $1,212 per month
- Occupancy decreases to average 17.6%
- Daily rates adjust to average $176
Seasonality Insights for Acklam
- The Airbnb seasonality in Acklam shows highly seasonal trends requiring careful strategy. While the sections above show seasonal averages, it's also insightful to look at the extremes:
- During the high season, the absolute peak month showcases Acklam's highest earning potential, with monthly revenues capable of climbing to $2,653, occupancy reaching a high of 43.4%, and ADRs peaking at $200.
- Conversely, the slowest single month of the year, typically falling within the low season, marks the market's lowest point. In this month, revenue might dip to $781, occupancy could drop to 10.8%, and ADRs may adjust down to $159.
- Understanding both the seasonal averages and these monthly peaks and troughs in revenue, occupancy, and ADR is crucial for maximizing your Airbnb profit potential in Acklam.
Seasonal Strategies for Maximizing Profit
- Peak Season: Maximize revenue through premium pricing and potentially longer minimum stays. Ensure high availability.
- Low Season: Offer competitive pricing, special promotions (e.g., extended stay discounts), and flexible cancellation policies. Target off-season travelers like remote workers or budget-conscious guests.
- Shoulder Seasons: Implement dynamic pricing that balances peak and low rates. Target weekend travelers or specific events. Offer slightly more flexible terms than peak season.
- Regularly analyze your own performance against these Acklam seasonality benchmarks and adjust your pricing and availability strategy accordingly.
Best Areas for Airbnb Investment in Acklam (2025)
Exploring the top neighborhoods for short-term rentals in Acklam? This section highlights key areas, outlining why they are attractive for hosts and guests, along with notable local attractions. Consider these locations based on your target guest profile and investment strategy.
| Neighborhood / Area | Why Host Here? (Target Guests & Appeal) | Key Attractions & Landmarks |
|---|---|---|
| Acklam Village | A charming area with a local feel, close to parks and amenities, ideal for guests seeking a quiet yet convenient stay. | Acklam Hall, John Whitehead Park, Zetland Park, local pubs and restaurants |
| Cleveland Park | A residential area with beautiful green spaces, appealing to families and nature lovers who want a peaceful retreat near the city. | Cleveland Park, Sophie’s Hill, local shops, community events |
| Brotton Road | A road known for its accessibility to transport links and proximity to various attractions in nearby Middlesbrough, perfect for commuters. | Nearby shopping centers, Transport links to Middlesbrough, local eateries |
| Dunelm Road | Offers a mix of residential and commercial properties, attracting business travelers and families. | local markets, easy access to public transportation |
| Newport Road | Situated near main roads, providing easy access to nearby attractions and the city center, making it suitable for short stays. | local amenities, parks, transport access |
| Barford Close | A peaceful residential cul-de-sac ideal for families and long-term visitors looking for a calm environment near city life's hustle and bustle. | friendly community atmosphere, trails and parks nearby |
| St. John's Avenue | Close to schools and parks, a great area for families and visitors looking for a homely experience with access to city conveniences. | St. John's Church, local schools, community parks |
| Westby Road | This area offers a mix of accommodation types and is near local shops, making it a good choice for both short and long stays. | local shops and services, easy access to green spaces |
Understanding Airbnb License Requirements & STR Laws in Acklam (2025)
While Acklam, England, United Kingdom currently shows low STR regulations, specific Airbnb license requirements might still exist or change. Always verify the latest short term rental regulations and Airbnb license requirements directly with local government authorities for Acklam to ensure full compliance before hosting.
(Source: AirROI data, 2025, finding no licensed listings among those analyzed)
Top Performing Airbnb Properties in Acklam (2025)
Benchmark your potential! Explore examples of top-performing Airbnb properties in Acklambased on Trailing Twelve Month (TTM) revenue. Analyze their characteristics, revenue, occupancy rate, and ADR to understand what drives success in this market.
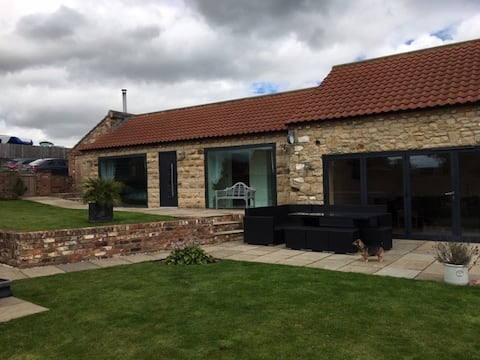
1 Bed in Leppington (88457)
Entire Place • 1 bedroom
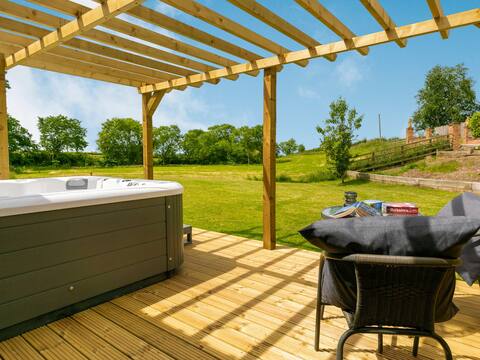
The Old Stables, Luxury Holiday Home with Hot Tub.
Entire Place • 1 bedroom
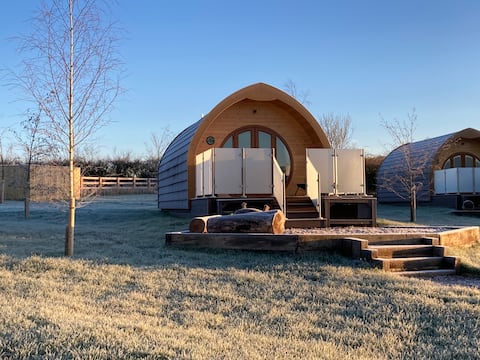
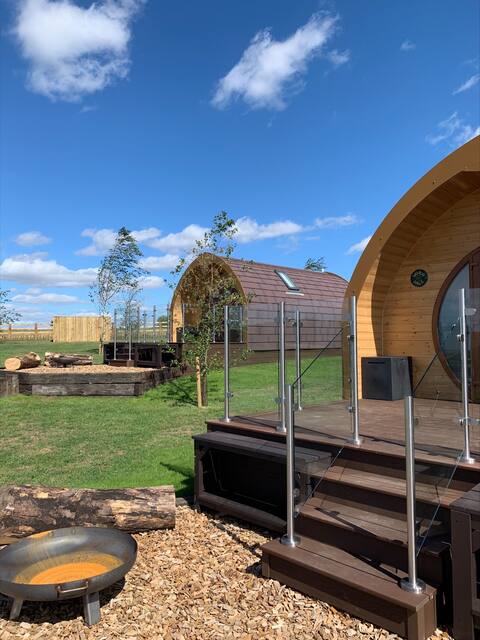
Mingle Dale - Luxury Glamping Pod nr York
Entire Place • 1 bedroom
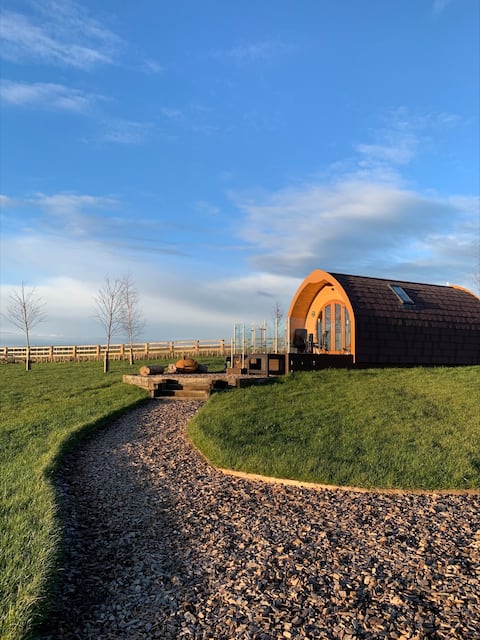
Hundle Dale - Luxury Glamping Pod nr York
Entire Place • 1 bedroom
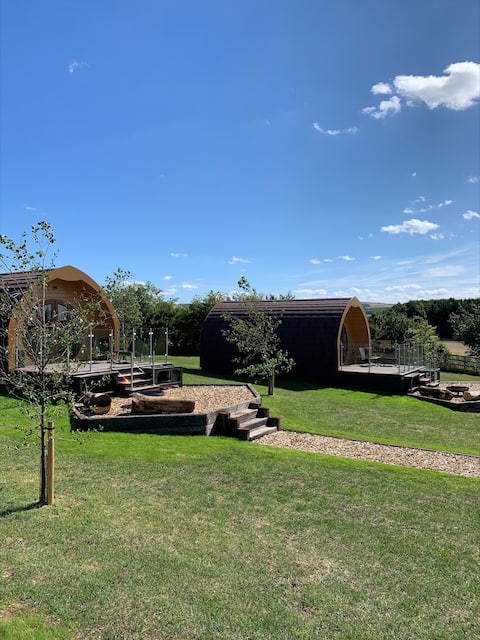
Deep Dale - Luxury Glamping pod be York
Entire Place • 1 bedroom
Worm Dale - Luxury glamping pod nr York
Entire Place • 1 bedroom
Note: Performance varies based on location, size, amenities, seasonality, and management quality. Data reflects the past 12 months.
Top Performing Airbnb Hosts in Acklam (2025)
Learn from the best! This table showcases top-performing Airbnb hosts in Acklam based on the number of properties managed and estimated total revenue over the past year. Analyze their scale and performance metrics.
| Host Name | Properties | Grossing Revenue | Stay Reviews | Avg Rating |
|---|---|---|---|---|
| Sue | 4 | $96,608 | 40 | 5.00/5.0 |
| Holidaycottages.Co.Uk | 1 | $51,825 | 4 | 5.00/5.0 |
| Kath | 1 | $32,112 | 532 | 4.88/5.0 |
| Alice | 7 | $17,777 | 294 | 4.89/5.0 |
| Aneesa | 1 | $11,663 | 22 | 4.95/5.0 |
| Roddy | 3 | $2,349 | 14 | 5.00/5.0 |
| Host #205697603 | 1 | $844 | 47 | 4.87/5.0 |
Analyzing the strategies of top hosts, such as their property selection, pricing, and guest communication, can offer valuable lessons for optimizing your own Airbnb operations in Acklam.
Dive Deeper: Advanced Acklam STR Market Data (2025)
Ready to unlock more insights? AirROI provides access to advanced metrics and comprehensive Airbnb data for Acklam. Explore detailed analytics beyond this report to refine your investment strategy, optimize pricing, and maximize your vacation rental profits.
Explore Advanced MetricsAcklam Short-Term Rental Market Composition (2025): Property & Room Types
Room Type Distribution
Property Type Distribution
Market Composition Insights for Acklam
- The Acklam Airbnb market composition is heavily skewed towards Entire Home/Apt listings, which make up 100% of the 18 active rentals. This indicates strong guest preference for privacy and space.
- Looking at the property type distribution in Acklam, House properties are the most common (38.9%), reflecting the local real estate landscape.
- Houses represent a significant 38.9% portion, catering likely to families or larger groups.
- The presence of 5.6% Hotel/Boutique listings indicates integration with traditional hospitality.
Acklam Airbnb Room Capacity Analysis (2025): Bedroom Distribution
Distribution of Listings by Number of Bedrooms
Room Capacity Insights for Acklam
- The dominant room capacity in Acklam is 1 bedroom listings, making up 77.8% of the market. This suggests a strong demand for properties suitable for couples or solo travelers.
- Together, 1 bedroom and 2 bedrooms properties represent 88.9% of the active Airbnb listings in Acklam, indicating a high concentration in these sizes.
- With over half the market (77.8%) consisting of studios or 1-bedroom units, Acklam is particularly well-suited for individuals or couples.
Acklam Vacation Rental Guest Capacity Trends (2025)
Distribution of Listings by Guest Capacity
Guest Capacity Insights for Acklam
- The most common guest capacity trend in Acklam vacation rentals is listings accommodating 5 guests (33.3%). This suggests the primary traveler segment is likely larger groups.
- Properties designed for 5 guests and 2 guests dominate the Acklam STR market, accounting for 61.1% of listings.
- 16.7% of properties accommodate 6+ guests, serving the market segment for larger families or group travel in Acklam.
- On average, properties in Acklam are equipped to host 4.1 guests.
Acklam Airbnb Booking Patterns (2025): Available vs. Booked Days
Available Days Distribution
Booked Days Distribution
Booking Pattern Insights for Acklam
- The most common availability pattern in Acklam falls within the 271-366 days range, representing 83.3% of listings. This suggests many properties have significant open periods on their calendars.
- Approximately 94.4% of listings show high availability (181+ days open annually), indicating potential for increased bookings or specific owner usage patterns.
- For booked days, the 1-30 days range is most frequent in Acklam (44.4%), reflecting common guest stay durations or potential owner blocking patterns.
- A notable 5.6% of properties secure long booking periods (181+ days booked per year), highlighting successful long-term rental strategies or significant owner usage.
Acklam Airbnb Minimum Stay Requirements Analysis
Distribution of Listings by Minimum Night Requirement
1 Night
8 listings
47.1% of total
2 Nights
6 listings
35.3% of total
30+ Nights
3 listings
17.6% of total
Key Insights
- The most prevalent minimum stay requirement in Acklam is 1 Night, adopted by 47.1% of listings. This highlights the market's preference for shorter, flexible bookings.
- A strong majority (82.4%) of the Acklam Airbnb data shows acceptance of very short stays (1-2 nights), indicating a dynamic, high-turnover market.
- A significant segment (17.6%) caters to monthly stays (30+ nights) in Acklam, pointing to opportunities in the extended-stay market.
Recommendations
- Align with the market by considering a 1 Night minimum stay, as 47.1% of Acklam hosts use this setting.
- Explore offering discounts for stays of 30+ nights to attract the 17.6% of the market seeking extended stays.
- Adjust minimum nights based on seasonality – potentially shorter during low season and longer during peak demand periods in Acklam.
Acklam Airbnb Cancellation Policy Trends Analysis (2025)
Super Strict 60 Days
1 listings
5.9% of total
Flexible
1 listings
5.9% of total
Firm
6 listings
35.3% of total
Strict
9 listings
52.9% of total
Cancellation Policy Insights for Acklam
- The prevailing Airbnb cancellation policy trend in Acklam is Strict, used by 52.9% of listings.
- A majority (88.2%) of hosts in Acklam utilize Firm or Strict policies, indicating a market where hosts prioritize booking security.
Recommendations for Hosts
- Consider adopting a Strict policy to align with the 52.9% market standard in Acklam.
- With 52.9% using Strict terms, this is a viable option in Acklam, particularly for high-value properties or during peak demand periods.
- Regularly review your cancellation policy against competitors and market demand shifts in Acklam.
Acklam STR Booking Lead Time Analysis (2025)
Average Booking Lead Time by Month
Booking Lead Time Insights for Acklam
- The overall average booking lead time for vacation rentals in Acklam is 42 days.
- Guests book furthest in advance for stays during July (average 110 days), likely coinciding with peak travel demand or local events.
- The shortest booking windows occur for stays in February (average 23 days), indicating more last-minute travel plans during this time.
- Seasonally, Summer (67 days avg.) sees the longest lead times, while Winter (30 days avg.) has the shortest, reflecting typical travel planning cycles.
Recommendations for Hosts
- Use the overall average lead time (42 days) as a baseline for your pricing and availability strategy in Acklam.
- For July stays, consider implementing length-of-stay discounts or slightly higher rates for bookings made less than 110 days out to capitalize on advance planning.
- Target marketing efforts for the Summer season well in advance (at least 67 days) to capture early planners.
- Monitor your own booking lead times against these Acklam averages to identify opportunities for dynamic pricing adjustments.
Popular & Essential Airbnb Amenities in Acklam (2025)
Amenity Prevalence
Amenity Insights for Acklam
- Popular amenities like Free parking on premises, Heating, Refrigerator are common but not universal. Offering these can provide a competitive edge.
- Warning: Wifi is not universally provided but is considered essential globally. Ensure reliable Wifi is offered.
Recommendations for Hosts
- Consider adding popular differentiators like Free parking on premises or Heating to increase appeal.
- Highlight unique or less common amenities you offer (e.g., hot tub, dedicated workspace, EV charger) in your listing description and photos.
- Regularly check competitor amenities in Acklam to stay competitive.
Acklam Airbnb Guest Demographics & Profile Analysis (2025)
Guest Profile Summary for Acklam
- The typical guest profile for Airbnb in Acklam consists of primarily domestic travelers (97%), often arriving from nearby England, typically belonging to the Post-2000s (Gen Z/Alpha) group (50%), primarily speaking English or Russian.
- Domestic travelers account for 96.9% of guests.
- Key international markets include United Kingdom (96.9%) and Malaysia (1.6%).
- Top languages spoken are English (68.2%) followed by Russian (4.5%).
- A significant demographic segment is the Post-2000s (Gen Z/Alpha) group, representing 50% of guests.
Recommendations for Hosts
- Target domestic marketing efforts towards travelers from England and Leeds.
- Tailor amenities and listing descriptions to appeal to the dominant Post-2000s (Gen Z/Alpha) demographic (e.g., highlight fast WiFi, smart home features, local guides).
- Highlight unique local experiences or amenities relevant to the primary guest profile.
- Consider seasonal promotions aligned with peak travel times for key origin markets.
Nearby Short-Term Rental Market Comparison
How does the Acklam Airbnb market stack up against its neighbors? Compare key performance metrics like average monthly revenue, ADR, and occupancy rates in surrounding areas to understand the broader regional STR landscape.
| Market | Active Properties | Monthly Revenue | Daily Rate | Avg. Occupancy |
|---|---|---|---|---|
| Bishop Monkton | 12 | $5,017 | $343.34 | 49% |
| Appleby | 10 | $4,923 | $366.62 | 45% |
| Grinton | 13 | $4,619 | $345.96 | 48% |
| Stamford Bridge | 12 | $4,608 | $404.70 | 38% |
| Ellingham | 12 | $4,548 | $303.92 | 57% |
| Blubberhouses | 10 | $4,054 | $419.16 | 42% |
| High Newton by the Sea | 20 | $4,051 | $498.12 | 36% |
| Holy Island | 14 | $3,979 | $324.93 | 57% |
| Carlton | 10 | $3,921 | $366.65 | 41% |
| Embleton | 40 | $3,717 | $372.32 | 51% |