Backwell Airbnb Market Analysis 2026: Short Term Rental Data & Vacation Rental Statistics in England, United Kingdom
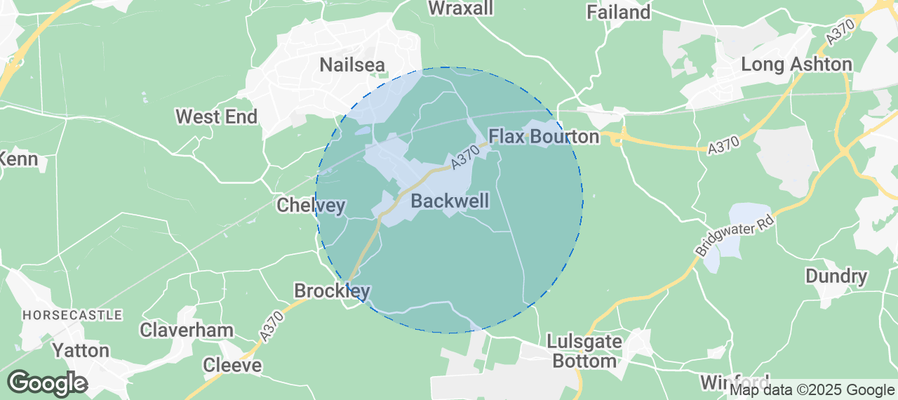
Is Airbnb profitable in Backwell in 2026? Explore comprehensive Airbnb analytics for Backwell, England, United Kingdom to uncover income potential. This 2026 STR market report for Backwell, based on AirROI data from February 2025 to January 2026, reveals key trends in the niche market of 18 active listings.
Whether you're considering an Airbnb investment in Backwell, optimizing your existing vacation rental, or exploring rental arbitrage opportunities, understanding the Backwell Airbnb data is crucial. Leveraging the low regulation environment is key to maximizing your short term rental income potential. Let's dive into the specifics.
Key Backwell Airbnb Performance Metrics Overview
Monthly Airbnb Revenue Variations & Income Potential in Backwell (2026)
Understanding the monthly revenue variations for Airbnb listings in Backwell is key to maximizing your short term rental income potential. Seasonality significantly impacts earnings. Our analysis, based on data from the past 12 months, shows that the peak revenue month for STRs in Backwell is typically August, while November often presents the lowest earnings, highlighting opportunities for strategic pricing adjustments during shoulder and low seasons. Explore the typical Airbnb income in Backwell across different performance tiers:
- Best-in-class properties (Top 10%) achieve $5,403+ monthly, often utilizing dynamic pricing and superior guest experiences.
- Strong performing properties (Top 25%) earn $3,428 or more, indicating effective management and desirable locations/amenities.
- Typical properties (Median) generate around $2,015 per month, representing the average market performance.
- Entry-level properties (Bottom 25%) see earnings around $1,120, often with potential for optimization.
Average Monthly Airbnb Earnings Trend in Backwell
Backwell Airbnb Occupancy Rate Trends (2026)
Maximize your bookings by understanding the Backwell STR occupancy trends. Seasonal demand shifts significantly influence how often properties are booked. Typically, Julysees the highest demand (peak season occupancy), while January experiences the lowest (low season). Effective strategies, like adjusting minimum stays or offering promotions, can boost occupancy during slower periods. Here's how different property tiers perform in Backwell:
- Best-in-class properties (Top 10%) achieve 82%+ occupancy, indicating high desirability and potentially optimized availability.
- Strong performing properties (Top 25%) maintain 72% or higher occupancy, suggesting good market fit and guest satisfaction.
- Typical properties (Median) have an occupancy rate around 51%.
- Entry-level properties (Bottom 25%) average 34% occupancy, potentially facing higher vacancy.
Average Monthly Occupancy Rate Trend in Backwell
Average Daily Rate (ADR) Airbnb Trends in Backwell (2026)
Effective short term rental pricing strategy in Backwell involves understanding monthly ADR fluctuations. The Average Daily Rate (ADR) for Airbnb in Backwell typically peaks in October and dips lowest during February. Leveraging Airbnb dynamic pricing tools or strategies based on this seasonality can significantly boost revenue. Here's a look at the typical nightly rates achieved:
- Best-in-class properties (Top 10%) command rates of $302+ per night, often due to premium features or locations.
- Strong performing properties (Top 25%) achieve nightly rates of $157 or more.
- Typical properties (Median) charge around $111 per night.
- Entry-level properties (Bottom 25%) earn around $92 per night.
Average Daily Rate (ADR) Trend by Month in Backwell
Get Live Backwell Market Intelligence 👇
Explore Real-time Analytics
Airbnb Seasonality Analysis & Trends in Backwell (2026)
Peak Season (August, July, May)
- Revenue averages $3,852 per month
- Occupancy rates average 67.1%
- Daily rates average $175
Shoulder Season
- Revenue averages $2,400 per month
- Occupancy maintains around 52.7%
- Daily rates hold near $178
Low Season (January, March, November)
- Revenue drops to average $1,844 per month
- Occupancy decreases to average 37.9%
- Daily rates adjust to average $178
Seasonality Insights for Backwell
- The Airbnb seasonality in Backwell shows highly seasonal trends requiring careful strategy. While the sections above show seasonal averages, it's also insightful to look at the extremes:
- During the high season, the absolute peak month showcases Backwell's highest earning potential, with monthly revenues capable of climbing to $4,484, occupancy reaching a high of 73.6%, and ADRs peaking at $191.
- Conversely, the slowest single month of the year, typically falling within the low season, marks the market's lowest point. In this month, revenue might dip to $1,739, occupancy could drop to 32.9%, and ADRs may adjust down to $164.
- Understanding both the seasonal averages and these monthly peaks and troughs in revenue, occupancy, and ADR is crucial for maximizing your Airbnb profit potential in Backwell.
Seasonal Strategies for Maximizing Profit
- Peak Season: Maximize revenue through premium pricing and potentially longer minimum stays. Ensure high availability.
- Low Season: Offer competitive pricing, special promotions (e.g., extended stay discounts), and flexible cancellation policies. Target off-season travelers like remote workers or budget-conscious guests.
- Shoulder Seasons: Implement dynamic pricing that balances peak and low rates. Target weekend travelers or specific events. Offer slightly more flexible terms than peak season.
- Regularly analyze your own performance against these Backwell seasonality benchmarks and adjust your pricing and availability strategy accordingly.
Best Areas for Airbnb Investment in Backwell (2026)
Exploring the top neighborhoods for short-term rentals in Backwell? This section highlights key areas, outlining why they are attractive for hosts and guests, along with notable local attractions. Consider these locations based on your target guest profile and investment strategy.
| Neighborhood / Area | Why Host Here? (Target Guests & Appeal) | Key Attractions & Landmarks |
|---|---|---|
| Backwell Village | A charming and quiet village close to Bristol, offering a peaceful atmosphere while being only a short distance from the city. Attractive to families and weekend visitors. | Backwell Lake, Backwell Common, Local pubs and restaurants, St. Andrew's Church, Cycle paths to Bristol |
| Bristol City Centre | A vibrant hub with a mix of culture, shopping, and nightlife. Ideal for tourists and business travelers, offering a range of attractions and events throughout the year. | Bristol Harbourside, Cabot Circus, Bristol Museum & Art Gallery, Street Art tours, Clifton Suspension Bridge |
| Clifton | Known for its stunning Georgian architecture and the famous Clifton Suspension Bridge. Attracts both tourists and locals looking for upscale dining and shopping. | Clifton Suspension Bridge, Bristol Zoo Gardens, The Downs, Clifton Village, Observatory |
| Long Ashton | A quick commute to Bristol with beautiful countryside views. Great for nature lovers and those seeking a quieter lifestyle while still close to city amenities. | Ashton Court Estate, Long Ashton Golf Club, Local hikes and trails, Park and Play |
| Portishead | A coastal town with a marina and waterfront, appealing to vacationers and families looking for seaside experiences. Popular for its shops and restaurants. | Portishead Marina, Bristol Channel, Portishead Lake Grounds, Open air concerts and events, Nearby beaches |
| Nailsea | A growing town with a mix of rural charm and modern amenities. Close to nature reserves and good transport links to Bristol. | Nailsea Wildlife Park, Local markets, Toghill Nature Reserve, Nearby parks and cafes |
| Weston-super-Mare | A popular seaside resort known for its long sandy beaches and family-friendly attractions. Ideal for summer rentals and weekend getaways. | Weston-super-Mare Beach, Grand Pier, Marine Lake, Local amusement arcades, Water sports |
| Chew Valley | A rural area known for its beautiful countryside and charming villages. Great for nature lovers, offering a tranquil retreat from city life. | Chew Valley Lake, Chew Magna village, Hiking and cycling routes, Local pubs and eateries |
Understanding Airbnb License Requirements & STR Laws in Backwell (2026)
While Backwell, England, United Kingdom currently shows low STR regulations, specific Airbnb license requirements might still exist or change. Always verify the latest short term rental regulations and Airbnb license requirements directly with local government authorities for Backwell to ensure full compliance before hosting.
(Source: AirROI data, 2026, finding no licensed listings among those analyzed)
Top Performing Airbnb Properties in Backwell (2026)
Benchmark your potential! Explore examples of top-performing Airbnb properties in Backwellbased on Trailing Twelve Month (TTM) revenue. Analyze their characteristics, revenue, occupancy rate, and ADR to understand what drives success in this market.
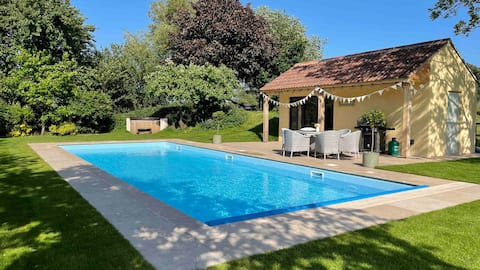
Rural family farmhouse with pool & hot tub
Entire Place • 6 bedrooms
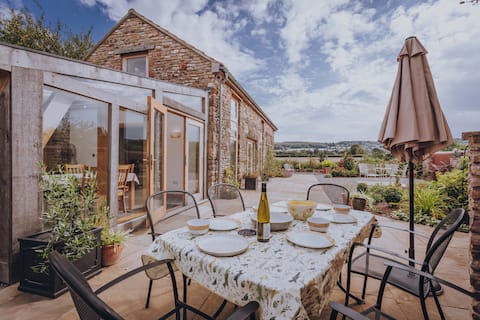
Beautiful Barn near Bristol in Picturesque Setting
Entire Place • 3 bedrooms
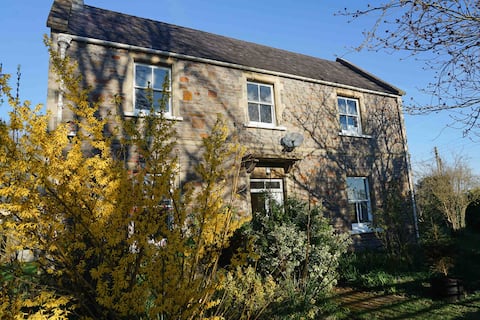
Picturesque Spacious Country Cottage near airport
Entire Place • 3 bedrooms
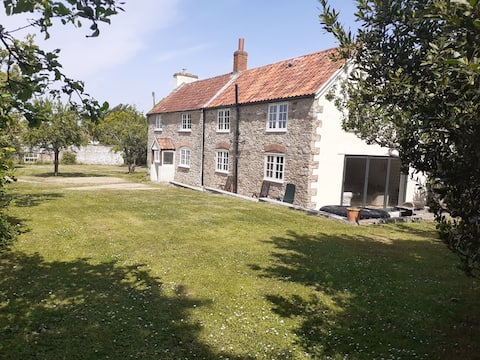
Characterful Cottage by an Orchard - Free Parking
Entire Place • 2 bedrooms
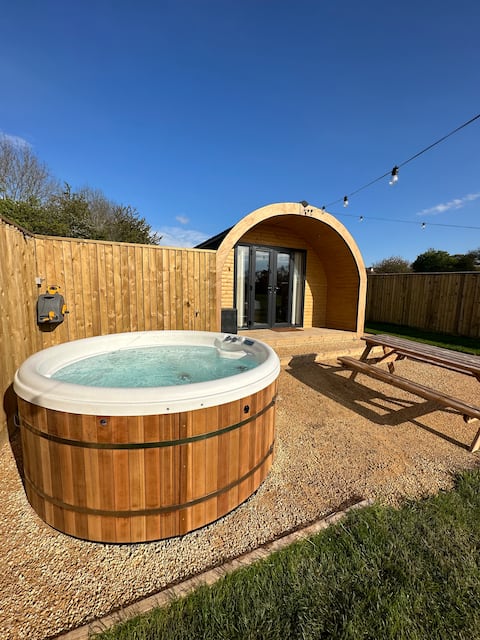
Lois' Luxury Pod with Hot Tub, Nr Bristol Airport
Entire Place • 1 bedroom
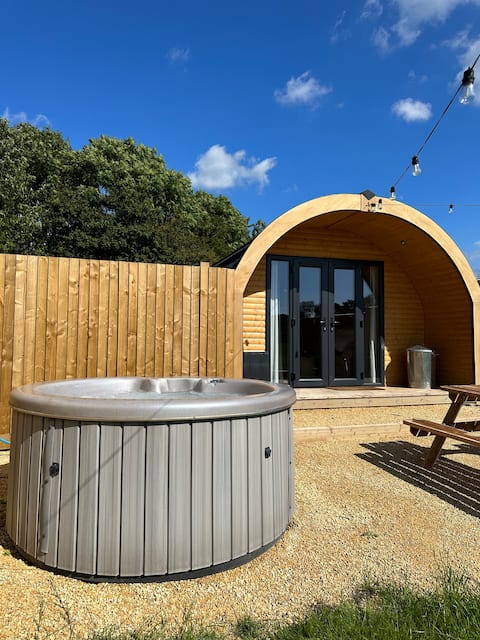
Mary’s Luxury Pod with Hot Tub, Nr Bristol Airport
Entire Place • 1 bedroom
Note: Performance varies based on location, size, amenities, seasonality, and management quality. Data reflects the past 12 months.
Top Performing Airbnb Hosts in Backwell (2026)
Learn from the best! This table showcases top-performing Airbnb hosts in Backwell based on the number of properties managed and estimated total revenue over the past year. Analyze their scale and performance metrics.
| Host Name | Properties | Grossing Revenue | Stay Reviews | Avg Rating |
|---|---|---|---|---|
| Alastair & Fi | 2 | $102,165 | 362 | 4.89/5.0 |
| Rachel | 2 | $77,215 | 308 | 4.96/5.0 |
| Bubbly | 1 | $60,371 | 170 | 5.00/5.0 |
| Jessica | 1 | $51,764 | 19 | 4.95/5.0 |
| Henry | 1 | $47,456 | 319 | 4.83/5.0 |
| Ben | 2 | $40,854 | 268 | 4.99/5.0 |
| Iola | 1 | $28,443 | 100 | 4.90/5.0 |
| Lucy | 1 | $24,599 | 120 | 4.98/5.0 |
| Fiona | 1 | $18,678 | 158 | 4.86/5.0 |
| Dave | 1 | $15,772 | 290 | 4.98/5.0 |
Analyzing the strategies of top hosts, such as their property selection, pricing, and guest communication, can offer valuable lessons for optimizing your own Airbnb operations in Backwell.
Dive Deeper: Advanced Backwell STR Market Data (2026)
Ready to unlock more insights? AirROI provides access to advanced metrics and comprehensive Airbnb data for Backwell. Explore detailed analytics beyond this report to refine your investment strategy, optimize pricing, and maximize your vacation rental profits.
Explore Advanced MetricsBackwell Short-Term Rental Market Composition (2026): Property & Room Types
Room Type Distribution
Property Type Distribution
Market Composition Insights for Backwell
- The Backwell Airbnb market composition is heavily skewed towards Entire Home/Apt listings, which make up 83.3% of the 18 active rentals. This indicates strong guest preference for privacy and space.
- Looking at the property type distribution in Backwell, House properties are the most common (55.6%), reflecting the local real estate landscape.
- Houses represent a significant 55.6% portion, catering likely to families or larger groups.
- The presence of 16.7% Hotel/Boutique listings indicates integration with traditional hospitality.
Backwell Airbnb Room Capacity Analysis (2026): Bedroom Distribution
Distribution of Listings by Number of Bedrooms
Room Capacity Insights for Backwell
- The dominant room capacity in Backwell is 1 bedroom listings, making up 66.7% of the market. This suggests a strong demand for properties suitable for couples or solo travelers.
- Together, 1 bedroom and 3 bedrooms properties represent 77.8% of the active Airbnb listings in Backwell, indicating a high concentration in these sizes.
- With over half the market (66.7%) consisting of studios or 1-bedroom units, Backwell is particularly well-suited for individuals or couples.
Backwell Vacation Rental Guest Capacity Trends (2026)
Distribution of Listings by Guest Capacity
Guest Capacity Insights for Backwell
- The most common guest capacity trend in Backwell vacation rentals is listings accommodating 2 guests (61.1%). This suggests the primary traveler segment is likely couples or solo travelers.
- Properties designed for 2 guests and 4 guests dominate the Backwell STR market, accounting for 72.2% of listings.
- A significant 61.1% of listings cater specifically to 1-2 guests, highlighting strong demand from couples and solo travelers in Backwell.
- 16.7% of properties accommodate 6+ guests, serving the market segment for larger families or group travel in Backwell.
- On average, properties in Backwell are equipped to host 3.1 guests.
Backwell Airbnb Booking Patterns (2026): Available vs. Booked Days
Available Days Distribution
Booked Days Distribution
Booking Pattern Insights for Backwell
- The most common availability pattern in Backwell falls within the 181-270 days range, representing 44.4% of listings. This suggests many properties have significant open periods on their calendars.
- Approximately 55.5% of listings show high availability (181+ days open annually), indicating potential for increased bookings or specific owner usage patterns.
- For booked days, the 181-270 days range is most frequent in Backwell (44.4%), reflecting common guest stay durations or potential owner blocking patterns.
- A notable 50.0% of properties secure long booking periods (181+ days booked per year), highlighting successful long-term rental strategies or significant owner usage.
Backwell Airbnb Minimum Stay Requirements Analysis
Distribution of Listings by Minimum Night Requirement
1 Night
7 listings
38.9% of total
2 Nights
4 listings
22.2% of total
30+ Nights
7 listings
38.9% of total
Key Insights
- The most prevalent minimum stay requirement in Backwell is 1 Night, adopted by 38.9% of listings. This highlights the market's preference for shorter, flexible bookings.
- A strong majority (61.1%) of the Backwell Airbnb data shows acceptance of very short stays (1-2 nights), indicating a dynamic, high-turnover market.
- A significant segment (38.9%) caters to monthly stays (30+ nights) in Backwell, pointing to opportunities in the extended-stay market.
Recommendations
- Align with the market by considering a 1 Night minimum stay, as 38.9% of Backwell hosts use this setting.
- Explore offering discounts for stays of 30+ nights to attract the 38.9% of the market seeking extended stays.
- Adjust minimum nights based on seasonality – potentially shorter during low season and longer during peak demand periods in Backwell.
Backwell Airbnb Cancellation Policy Trends Analysis (2026)
Flexible
5 listings
27.8% of total
Moderate
5 listings
27.8% of total
Firm
7 listings
38.9% of total
Strict
1 listings
5.6% of total
Cancellation Policy Insights for Backwell
- The prevailing Airbnb cancellation policy trend in Backwell is Firm, used by 38.9% of listings.
- There's a relatively balanced mix between guest-friendly (55.6%) and stricter (44.5%) policies, offering choices for different guest needs.
- Strict cancellation policies are quite rare (5.6%), potentially making listings with this policy less competitive unless justified by high demand or property type.
Recommendations for Hosts
- Consider adopting a Firm policy to align with the 38.9% market standard in Backwell.
- Using a Strict policy might deter some guests, as only 5.6% of listings use it. Evaluate if potential revenue protection outweighs possible lower booking rates.
- Regularly review your cancellation policy against competitors and market demand shifts in Backwell.
Backwell STR Booking Lead Time Analysis (2026)
Average Booking Lead Time by Month
Booking Lead Time Insights for Backwell
- The overall average booking lead time for vacation rentals in Backwell is 48 days.
- Guests book furthest in advance for stays during August (average 69 days), likely coinciding with peak travel demand or local events.
- The shortest booking windows occur for stays in February (average 31 days), indicating more last-minute travel plans during this time.
- Seasonally, Summer (62 days avg.) sees the longest lead times, while Winter (42 days avg.) has the shortest, reflecting typical travel planning cycles.
Recommendations for Hosts
- Use the overall average lead time (48 days) as a baseline for your pricing and availability strategy in Backwell.
- For August stays, consider implementing length-of-stay discounts or slightly higher rates for bookings made less than 69 days out to capitalize on advance planning.
- Target marketing efforts for the Summer season well in advance (at least 62 days) to capture early planners.
- Monitor your own booking lead times against these Backwell averages to identify opportunities for dynamic pricing adjustments.
Popular & Essential Airbnb Amenities in Backwell (2026)
Amenity Prevalence
Amenity Insights for Backwell
- Essential amenities in Backwell that guests expect include: Heating, Smoke alarm, Wifi. Lacking these (any) could significantly impact bookings.
- Popular amenities like Hair dryer, Free parking on premises, TV are common but not universal. Offering these can provide a competitive edge.
Recommendations for Hosts
- Ensure your listing includes all essential amenities for Backwell: Heating, Smoke alarm, Wifi.
- Consider adding popular differentiators like Hair dryer or Free parking on premises to increase appeal.
- Highlight unique or less common amenities you offer (e.g., hot tub, dedicated workspace, EV charger) in your listing description and photos.
- Regularly check competitor amenities in Backwell to stay competitive.
Backwell Airbnb Guest Demographics & Profile Analysis (2026)
Guest Profile Summary for Backwell
- The typical guest profile for Airbnb in Backwell consists of primarily domestic travelers (88%), often arriving from nearby England, typically belonging to the Post-2000s (Gen Z/Alpha) group (50%), primarily speaking English or French.
- Domestic travelers account for 88.1% of guests.
- Key international markets include United Kingdom (88.1%) and United States (1.9%).
- Top languages spoken are English (65.3%) followed by French (7.7%).
- A significant demographic segment is the Post-2000s (Gen Z/Alpha) group, representing 50% of guests.
Recommendations for Hosts
- Target domestic marketing efforts towards travelers from England and London.
- Tailor amenities and listing descriptions to appeal to the dominant Post-2000s (Gen Z/Alpha) demographic (e.g., highlight fast WiFi, smart home features, local guides).
- Highlight unique local experiences or amenities relevant to the primary guest profile.
- Consider seasonal promotions aligned with peak travel times for key origin markets.
Nearby Short-Term Rental Market Comparison
How does the Backwell Airbnb market stack up against its neighbors? Compare key performance metrics like average monthly revenue, ADR, and occupancy rates in surrounding areas to understand the broader regional STR landscape.
| Market | Active Properties | Monthly Revenue | Daily Rate | Avg. Occupancy |
|---|---|---|---|---|
| Chew Magna | 13 | $7,041 | $430.65 | 44% |
| Englishcombe | 15 | $6,734 | $511.35 | 53% |
| Lambourn | 11 | $6,499 | $723.41 | 31% |
| East Knoyle | 10 | $6,300 | $407.06 | 44% |
| Long Sutton | 18 | $6,029 | $383.58 | 46% |
| Withington | 10 | $5,690 | $499.79 | 44% |
| Ashley | 13 | $5,497 | $364.68 | 54% |
| Bont-dolgadfan | 10 | $5,458 | $293.24 | 58% |
| Freshford | 12 | $5,333 | $317.81 | 58% |
| Grosmont | 11 | $5,211 | $459.67 | 55% |