Bournemouth Airbnb Market Analysis 2026: Short Term Rental Data & Vacation Rental Statistics in England, United Kingdom
Is Airbnb profitable in Bournemouth in 2026? Explore comprehensive Airbnb analytics for Bournemouth, England, United Kingdom to uncover income potential. This 2026 STR market report for Bournemouth, based on AirROI data from February 2025 to January 2026, reveals key trends in the bustling market of 1,240 active listings.
Whether you're considering an Airbnb investment in Bournemouth, optimizing your existing vacation rental, or exploring rental arbitrage opportunities, understanding the Bournemouth Airbnb data is crucial. Leveraging the low regulation environment is key to maximizing your short term rental income potential. Let's dive into the specifics.
Key Bournemouth Airbnb Performance Metrics Overview
Monthly Airbnb Revenue Variations & Income Potential in Bournemouth (2026)
Understanding the monthly revenue variations for Airbnb listings in Bournemouth is key to maximizing your short term rental income potential. Seasonality significantly impacts earnings. Our analysis, based on data from the past 12 months, shows that the peak revenue month for STRs in Bournemouth is typically August, while January often presents the lowest earnings, highlighting opportunities for strategic pricing adjustments during shoulder and low seasons. Explore the typical Airbnb income in Bournemouth across different performance tiers:
- Best-in-class properties (Top 10%) achieve $5,602+ monthly, often utilizing dynamic pricing and superior guest experiences.
- Strong performing properties (Top 25%) earn $3,607 or more, indicating effective management and desirable locations/amenities.
- Typical properties (Median) generate around $2,087 per month, representing the average market performance.
- Entry-level properties (Bottom 25%) see earnings around $976, often with potential for optimization.
Average Monthly Airbnb Earnings Trend in Bournemouth
Bournemouth Airbnb Occupancy Rate Trends (2026)
Maximize your bookings by understanding the Bournemouth STR occupancy trends. Seasonal demand shifts significantly influence how often properties are booked. Typically, Augustsees the highest demand (peak season occupancy), while January experiences the lowest (low season). Effective strategies, like adjusting minimum stays or offering promotions, can boost occupancy during slower periods. Here's how different property tiers perform in Bournemouth:
- Best-in-class properties (Top 10%) achieve 80%+ occupancy, indicating high desirability and potentially optimized availability.
- Strong performing properties (Top 25%) maintain 64% or higher occupancy, suggesting good market fit and guest satisfaction.
- Typical properties (Median) have an occupancy rate around 41%.
- Entry-level properties (Bottom 25%) average 22% occupancy, potentially facing higher vacancy.
Average Monthly Occupancy Rate Trend in Bournemouth
Average Daily Rate (ADR) Airbnb Trends in Bournemouth (2026)
Effective short term rental pricing strategy in Bournemouth involves understanding monthly ADR fluctuations. The Average Daily Rate (ADR) for Airbnb in Bournemouth typically peaks in August and dips lowest during February. Leveraging Airbnb dynamic pricing tools or strategies based on this seasonality can significantly boost revenue. Here's a look at the typical nightly rates achieved:
- Best-in-class properties (Top 10%) command rates of $366+ per night, often due to premium features or locations.
- Strong performing properties (Top 25%) achieve nightly rates of $240 or more.
- Typical properties (Median) charge around $162 per night.
- Entry-level properties (Bottom 25%) earn around $110 per night.
Average Daily Rate (ADR) Trend by Month in Bournemouth
Get Live Bournemouth Market Intelligence 👇

Explore Real-time Analytics
Airbnb Seasonality Analysis & Trends in Bournemouth (2026)
Peak Season (August, July, June)
- Revenue averages $4,108 per month
- Occupancy rates average 54.2%
- Daily rates average $234
Shoulder Season
- Revenue averages $2,581 per month
- Occupancy maintains around 42.1%
- Daily rates hold near $211
Low Season (January, February, November)
- Revenue drops to average $1,927 per month
- Occupancy decreases to average 35.8%
- Daily rates adjust to average $203
Seasonality Insights for Bournemouth
- The Airbnb seasonality in Bournemouth shows highly seasonal trends requiring careful strategy. While the sections above show seasonal averages, it's also insightful to look at the extremes:
- During the high season, the absolute peak month showcases Bournemouth's highest earning potential, with monthly revenues capable of climbing to $4,913, occupancy reaching a high of 60.8%, and ADRs peaking at $241.
- Conversely, the slowest single month of the year, typically falling within the low season, marks the market's lowest point. In this month, revenue might dip to $1,843, occupancy could drop to 31.0%, and ADRs may adjust down to $198.
- Understanding both the seasonal averages and these monthly peaks and troughs in revenue, occupancy, and ADR is crucial for maximizing your Airbnb profit potential in Bournemouth.
Seasonal Strategies for Maximizing Profit
- Peak Season: Maximize revenue through premium pricing and potentially longer minimum stays. Ensure high availability.
- Low Season: Offer competitive pricing, special promotions (e.g., extended stay discounts), and flexible cancellation policies. Target off-season travelers like remote workers or budget-conscious guests.
- Shoulder Seasons: Implement dynamic pricing that balances peak and low rates. Target weekend travelers or specific events. Offer slightly more flexible terms than peak season.
- Regularly analyze your own performance against these Bournemouth seasonality benchmarks and adjust your pricing and availability strategy accordingly.
Best Areas for Airbnb Investment in Bournemouth (2026)
Exploring the top neighborhoods for short-term rentals in Bournemouth? This section highlights key areas, outlining why they are attractive for hosts and guests, along with notable local attractions. Consider these locations based on your target guest profile and investment strategy.
| Neighborhood / Area | Why Host Here? (Target Guests & Appeal) | Key Attractions & Landmarks |
|---|---|---|
| West Cliff | A popular location known for its stunning views of the coastline and proximity to the beach. Ideal for tourists seeking a classic seaside experience with easy access to local attractions. | Bournemouth Beach, Bournemouth Pier, Oceanarium, West Cliff Lift, Lower Gardens |
| Boscombe | A vibrant neighborhood with a famous surf beach and a mix of traditional and modern amenities. Attracts a younger crowd and offers a range of cultural events. | Boscombe Beach, Boscombe Pier, Shelley Park, The O2 Academy, Boscombe Surf Reef |
| Central Bournemouth | The heart of Bournemouth with excellent shopping, dining, and entertainment options. Perfect for visitors wanting to be in the midst of the city's activities. | Bournemouth Gardens, The Square, Bournemouth International Centre, Royal Bath Hotel, Pavilion Theatre |
| Southbourne | A quieter, family-friendly beach area known for its charming cafés and local shops. Attracts families and those looking for a relaxed seaside getaway. | Southbourne Beach, Hengistbury Head, Purewell Meadows, Fisherman's Walk, Seafront cafes |
| East Cliff | A scenic area with cliff-top gardens and beach access, popular for its picturesque views and tranquility. Great for those wanting a peaceful retreat. | East Cliff Promenade, Russell-Cotes Art Gallery & Museum, Bournemouth East Cliff HDR, Chine Gardens, Durley Chine |
| Charminster | A lively neighborhood with a diverse community and a mix of cuisines. Popular for visitors looking to experience local culture and nightlife. | Charminster Road restaurants, The Castle Inn, St. Dunstan's Church, Queens Park, The Art House |
| Highcliffe | A charming coastal town just outside Bournemouth, known for its historical architecture and beautiful beaches. Attracts those looking for a more laid-back atmosphere. | Highcliffe Castle, Highcliffe Beach, Chewton Glen, Shorefield Country Park, Avon Beach |
| Poole Harbour | Not far from Bournemouth, this area features stunning views and is perfect for boating and water sports enthusiasts, attracting nature lovers and adventure seekers. | Poole Harbour, Sandbanks Beach, Brownsea Island, Poole Old Town, The Lighthouse |
Understanding Airbnb License Requirements & STR Laws in Bournemouth (2026)
While Bournemouth, England, United Kingdom currently shows low STR regulations, specific Airbnb license requirements might still exist or change. Always verify the latest short term rental regulations and Airbnb license requirements directly with local government authorities for Bournemouth to ensure full compliance before hosting.
(Source: AirROI data, 2026, based on 0% licensed listings)
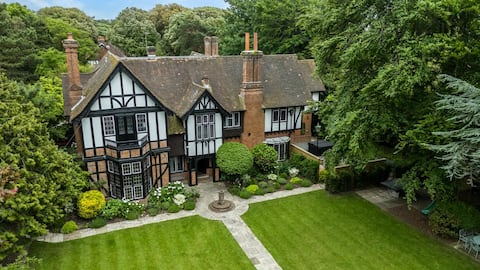
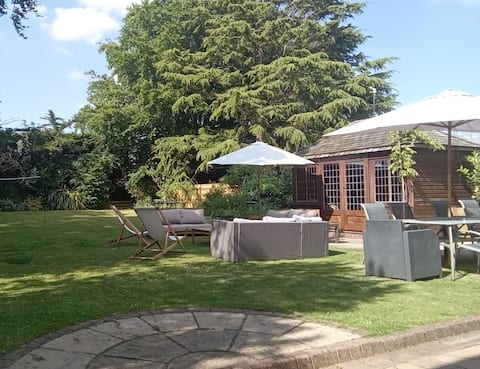
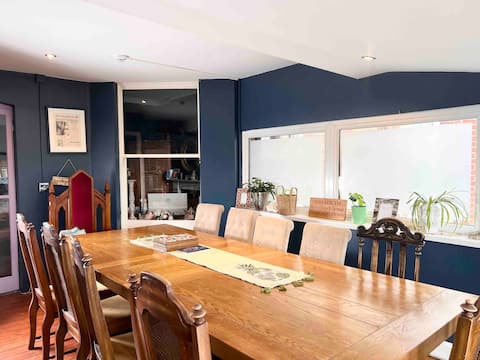
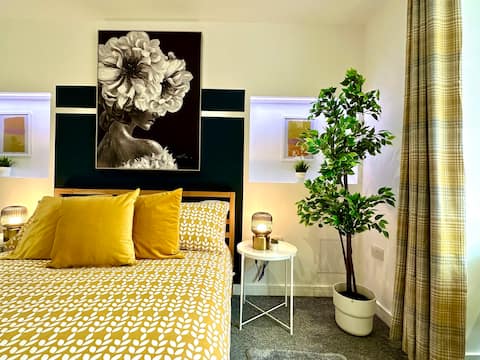
Top Performing Airbnb Properties in Bournemouth (2026)
Benchmark your potential! Explore examples of top-performing Airbnb properties in Bournemouthbased on Trailing Twelve Month (TTM) revenue. Analyze their characteristics, revenue, occupancy rate, and ADR to understand what drives success in this market.
12 Bed in Bournemouth (oc-t28236)
Entire Place • 13 bedrooms

Mansion by the Sea, 12BR/12BA, Perfect for Events
Entire Place • N/A
Modern House with large garden near to beach
Entire Place • 5 bedrooms

Luxury Villa: Sea-Pool-Hot Tub-Cinema-Large Garden
Entire Place • 9 bedrooms
The Boho - the largest beach house
Entire Place • 8 bedrooms
Massive 8 bedroom House Sleep 20+ Accepts Groups
Entire Place • 8 bedrooms
Note: Performance varies based on location, size, amenities, seasonality, and management quality. Data reflects the past 12 months.
Top Performing Airbnb Hosts in Bournemouth (2026)
Learn from the best! This table showcases top-performing Airbnb hosts in Bournemouth based on the number of properties managed and estimated total revenue over the past year. Analyze their scale and performance metrics.
| Host Name | Properties | Grossing Revenue | Stay Reviews | Avg Rating |
|---|---|---|---|---|
| Joe | 49 | $1,917,264 | 2135 | 4.64/5.0 |
| Jon | 52 | $1,804,228 | 3365 | 4.86/5.0 |
| Bournecoast Holiday Agents | 52 | $1,159,698 | 930 | 4.58/5.0 |
| Chanine | 16 | $801,066 | 342 | 4.80/5.0 |
| Grandeur Property | 29 | $669,190 | 723 | 4.56/5.0 |
| Charlotte | 13 | $437,821 | 325 | 4.79/5.0 |
| Jemma | 9 | $424,679 | 785 | 4.96/5.0 |
| Quay Holidays | 19 | $398,013 | 138 | 4.60/5.0 |
| Holidaycottages-Co-Uk | 2 | $391,052 | 3 | Not Rated |
| Grace | 4 | $389,247 | 170 | 4.96/5.0 |
Analyzing the strategies of top hosts, such as their property selection, pricing, and guest communication, can offer valuable lessons for optimizing your own Airbnb operations in Bournemouth.
Dive Deeper: Advanced Bournemouth STR Market Data (2026)
Ready to unlock more insights? AirROI provides access to advanced metrics and comprehensive Airbnb data for Bournemouth. Explore detailed analytics beyond this report to refine your investment strategy, optimize pricing, and maximize your vacation rental profits.
Explore Advanced MetricsBournemouth Short-Term Rental Market Composition (2026): Property & Room Types
Room Type Distribution
Property Type Distribution
Market Composition Insights for Bournemouth
- The Bournemouth Airbnb market composition is heavily skewed towards Entire Home/Apt listings, which make up 80.5% of the 1,240 active rentals. This indicates strong guest preference for privacy and space.
- Looking at the property type distribution in Bournemouth, Apartment/Condo properties are the most common (60.9%), reflecting the local real estate landscape.
- Houses represent a significant 27.6% portion, catering likely to families or larger groups.
- The presence of 6.6% Hotel/Boutique listings indicates integration with traditional hospitality.
- Smaller segments like others, outdoor/unique, unique stays (combined 5.0%) offer potential for unique stay experiences.
Bournemouth Airbnb Room Capacity Analysis (2026): Bedroom Distribution
Distribution of Listings by Number of Bedrooms
Room Capacity Insights for Bournemouth
- The dominant room capacity in Bournemouth is 1 bedroom listings, making up 35% of the market. This suggests a strong demand for properties suitable for couples or solo travelers.
- Together, 1 bedroom and 2 bedrooms properties represent 63.0% of the active Airbnb listings in Bournemouth, indicating a high concentration in these sizes.
- A significant 21.8% of listings offer 3+ bedrooms, catering to larger groups and families seeking more space in Bournemouth.
Bournemouth Vacation Rental Guest Capacity Trends (2026)
Distribution of Listings by Guest Capacity
Guest Capacity Insights for Bournemouth
- The most common guest capacity trend in Bournemouth vacation rentals is listings accommodating 4 guests (26%). This suggests the primary traveler segment is likely small families or groups.
- Properties designed for 4 guests and 2 guests dominate the Bournemouth STR market, accounting for 46.2% of listings.
- 27.8% of properties accommodate 6+ guests, serving the market segment for larger families or group travel in Bournemouth.
- On average, properties in Bournemouth are equipped to host 3.9 guests.
Bournemouth Airbnb Booking Patterns (2026): Available vs. Booked Days
Available Days Distribution
Booked Days Distribution
Booking Pattern Insights for Bournemouth
- The most common availability pattern in Bournemouth falls within the 271-366 days range, representing 42.7% of listings. This suggests many properties have significant open periods on their calendars.
- Approximately 79.2% of listings show high availability (181+ days open annually), indicating potential for increased bookings or specific owner usage patterns.
- For booked days, the 91-180 days range is most frequent in Bournemouth (36.9%), reflecting common guest stay durations or potential owner blocking patterns.
- A notable 22.1% of properties secure long booking periods (181+ days booked per year), highlighting successful long-term rental strategies or significant owner usage.
Bournemouth Airbnb Minimum Stay Requirements Analysis
Distribution of Listings by Minimum Night Requirement
1 Night
224 listings
18.1% of total
2 Nights
325 listings
26.2% of total
3 Nights
64 listings
5.2% of total
4-6 Nights
55 listings
4.4% of total
7-29 Nights
75 listings
6% of total
30+ Nights
497 listings
40.1% of total
Key Insights
- The most prevalent minimum stay requirement in Bournemouth is 30+ Nights, adopted by 40.1% of listings. This highlights the market's preference for longer commitments.
- A significant segment (40.1%) caters to monthly stays (30+ nights) in Bournemouth, pointing to opportunities in the extended-stay market.
Recommendations
- Align with the market by considering a 30+ Nights minimum stay, as 40.1% of Bournemouth hosts use this setting.
- If feasible, allowing 1-night stays, especially midweek or during low season, could capture last-minute bookings, as only 18.1% currently do.
- Explore offering discounts for stays of 30+ nights to attract the 40.1% of the market seeking extended stays.
- Adjust minimum nights based on seasonality – potentially shorter during low season and longer during peak demand periods in Bournemouth.
Bournemouth Airbnb Cancellation Policy Trends Analysis (2026)
Limited
37 listings
3% of total
Super Strict 30 Days
1 listings
0.1% of total
Non-refundable
3 listings
0.2% of total
Super Strict 60 Days
21 listings
1.7% of total
Flexible
263 listings
21.3% of total
Moderate
405 listings
32.7% of total
Firm
384 listings
31% of total
Strict
123 listings
9.9% of total
Cancellation Policy Insights for Bournemouth
- The prevailing Airbnb cancellation policy trend in Bournemouth is Moderate, used by 32.7% of listings.
- There's a relatively balanced mix between guest-friendly (54.0%) and stricter (40.9%) policies, offering choices for different guest needs.
- Strict cancellation policies are quite rare (9.9%), potentially making listings with this policy less competitive unless justified by high demand or property type.
Recommendations for Hosts
- Consider adopting a Moderate policy to align with the 32.7% market standard in Bournemouth.
- Using a Strict policy might deter some guests, as only 9.9% of listings use it. Evaluate if potential revenue protection outweighs possible lower booking rates.
- Regularly review your cancellation policy against competitors and market demand shifts in Bournemouth.
Bournemouth STR Booking Lead Time Analysis (2026)
Average Booking Lead Time by Month
Booking Lead Time Insights for Bournemouth
- The overall average booking lead time for vacation rentals in Bournemouth is 51 days.
- Guests book furthest in advance for stays during June (average 68 days), likely coinciding with peak travel demand or local events.
- The shortest booking windows occur for stays in February (average 31 days), indicating more last-minute travel plans during this time.
- Seasonally, Summer (63 days avg.) sees the longest lead times, while Winter (42 days avg.) has the shortest, reflecting typical travel planning cycles.
Recommendations for Hosts
- Use the overall average lead time (51 days) as a baseline for your pricing and availability strategy in Bournemouth.
- For June stays, consider implementing length-of-stay discounts or slightly higher rates for bookings made less than 68 days out to capitalize on advance planning.
- Target marketing efforts for the Summer season well in advance (at least 63 days) to capture early planners.
- Monitor your own booking lead times against these Bournemouth averages to identify opportunities for dynamic pricing adjustments.
Popular & Essential Airbnb Amenities in Bournemouth (2026)
Amenity Prevalence
Amenity Insights for Bournemouth
- Essential amenities in Bournemouth that guests expect include: Wifi, Smoke alarm. Lacking these (any) could significantly impact bookings.
- Popular amenities like TV, Heating, Hot water are common but not universal. Offering these can provide a competitive edge.
Recommendations for Hosts
- Ensure your listing includes all essential amenities for Bournemouth: Wifi, Smoke alarm.
- Prioritize adding missing essentials: Wifi, Smoke alarm.
- Consider adding popular differentiators like TV or Heating to increase appeal.
- Highlight unique or less common amenities you offer (e.g., hot tub, dedicated workspace, EV charger) in your listing description and photos.
- Regularly check competitor amenities in Bournemouth to stay competitive.
Bournemouth Airbnb Guest Demographics & Profile Analysis (2026)
Guest Profile Summary for Bournemouth
- The typical guest profile for Airbnb in Bournemouth consists of primarily domestic travelers (88%), often arriving from nearby England, typically belonging to the Post-2000s (Gen Z/Alpha) group (50%), primarily speaking English or French.
- Domestic travelers account for 87.5% of guests.
- Key international markets include United Kingdom (87.5%) and United States (2.2%).
- Top languages spoken are English (63.6%) followed by French (7.1%).
- A significant demographic segment is the Post-2000s (Gen Z/Alpha) group, representing 50% of guests.
Recommendations for Hosts
- Target domestic marketing efforts towards travelers from England and London.
- Tailor amenities and listing descriptions to appeal to the dominant Post-2000s (Gen Z/Alpha) demographic (e.g., highlight fast WiFi, smart home features, local guides).
- Highlight unique local experiences or amenities relevant to the primary guest profile.
- Consider seasonal promotions aligned with peak travel times for key origin markets.
Nearby Short-Term Rental Market Comparison
How does the Bournemouth Airbnb market stack up against its neighbors? Compare key performance metrics like average monthly revenue, ADR, and occupancy rates in surrounding areas to understand the broader regional STR landscape.
| Market | Active Properties | Monthly Revenue | Daily Rate | Avg. Occupancy |
|---|---|---|---|---|
| Dorney | 11 | $7,510 | $743.63 | 39% |
| Chew Magna | 13 | $7,041 | $430.65 | 44% |
| Englishcombe | 15 | $6,734 | $511.35 | 53% |
| Lambourn | 11 | $6,499 | $723.41 | 31% |
| East Knoyle | 10 | $6,300 | $407.06 | 44% |
| Wraysbury | 16 | $6,199 | $530.56 | 49% |
| City of Westminster | 1,424 | $6,053 | $515.72 | 50% |
| Long Sutton | 18 | $6,029 | $383.58 | 46% |
| Ashley | 13 | $5,497 | $364.68 | 54% |
| Freshford | 12 | $5,333 | $317.81 | 58% |