Bush Airbnb Market Analysis 2026: Short Term Rental Data & Vacation Rental Statistics in England, United Kingdom
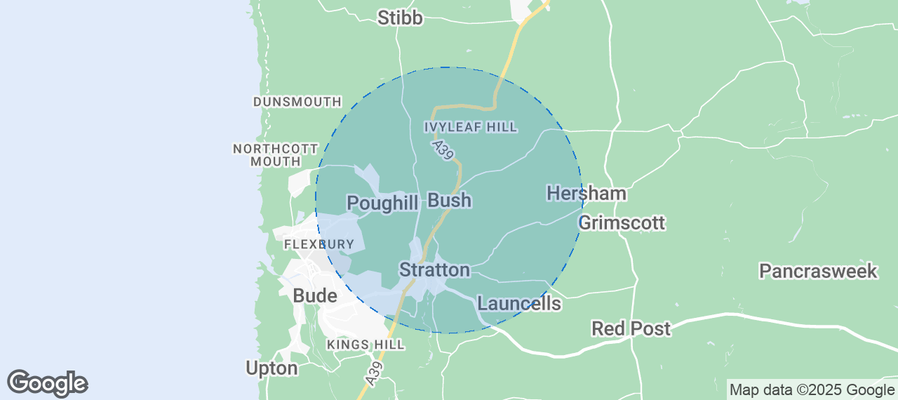
Is Airbnb profitable in Bush in 2026? Explore comprehensive Airbnb analytics for Bush, England, United Kingdom to uncover income potential. This 2026 STR market report for Bush, based on AirROI data from February 2025 to January 2026, reveals key trends in the niche market of 19 active listings.
Whether you're considering an Airbnb investment in Bush, optimizing your existing vacation rental, or exploring rental arbitrage opportunities, understanding the Bush Airbnb data is crucial. Leveraging the low regulation environment is key to maximizing your short term rental income potential. Let's dive into the specifics.
Key Bush Airbnb Performance Metrics Overview
Monthly Airbnb Revenue Variations & Income Potential in Bush (2026)
Understanding the monthly revenue variations for Airbnb listings in Bush is key to maximizing your short term rental income potential. Seasonality significantly impacts earnings. Our analysis, based on data from the past 12 months, shows that the peak revenue month for STRs in Bush is typically August, while February often presents the lowest earnings, highlighting opportunities for strategic pricing adjustments during shoulder and low seasons. Explore the typical Airbnb income in Bush across different performance tiers:
- Best-in-class properties (Top 10%) achieve $5,875+ monthly, often utilizing dynamic pricing and superior guest experiences.
- Strong performing properties (Top 25%) earn $2,646 or more, indicating effective management and desirable locations/amenities.
- Typical properties (Median) generate around $1,516 per month, representing the average market performance.
- Entry-level properties (Bottom 25%) see earnings around $816, often with potential for optimization.
Average Monthly Airbnb Earnings Trend in Bush
Bush Airbnb Occupancy Rate Trends (2026)
Maximize your bookings by understanding the Bush STR occupancy trends. Seasonal demand shifts significantly influence how often properties are booked. Typically, Augustsees the highest demand (peak season occupancy), while January experiences the lowest (low season). Effective strategies, like adjusting minimum stays or offering promotions, can boost occupancy during slower periods. Here's how different property tiers perform in Bush:
- Best-in-class properties (Top 10%) achieve 66%+ occupancy, indicating high desirability and potentially optimized availability.
- Strong performing properties (Top 25%) maintain 51% or higher occupancy, suggesting good market fit and guest satisfaction.
- Typical properties (Median) have an occupancy rate around 34%.
- Entry-level properties (Bottom 25%) average 17% occupancy, potentially facing higher vacancy.
Average Monthly Occupancy Rate Trend in Bush
Average Daily Rate (ADR) Airbnb Trends in Bush (2026)
Effective short term rental pricing strategy in Bush involves understanding monthly ADR fluctuations. The Average Daily Rate (ADR) for Airbnb in Bush typically peaks in August and dips lowest during November. Leveraging Airbnb dynamic pricing tools or strategies based on this seasonality can significantly boost revenue. Here's a look at the typical nightly rates achieved:
- Best-in-class properties (Top 10%) command rates of $410+ per night, often due to premium features or locations.
- Strong performing properties (Top 25%) achieve nightly rates of $235 or more.
- Typical properties (Median) charge around $152 per night.
- Entry-level properties (Bottom 25%) earn around $101 per night.
Average Daily Rate (ADR) Trend by Month in Bush
Get Live Bush Market Intelligence 👇
Explore Real-time Analytics
Airbnb Seasonality Analysis & Trends in Bush (2026)
Peak Season (August, October, September)
- Revenue averages $3,704 per month
- Occupancy rates average 48.0%
- Daily rates average $214
Shoulder Season
- Revenue averages $2,067 per month
- Occupancy maintains around 37.5%
- Daily rates hold near $203
Low Season (January, February, May)
- Revenue drops to average $1,045 per month
- Occupancy decreases to average 22.9%
- Daily rates adjust to average $197
Seasonality Insights for Bush
- The Airbnb seasonality in Bush shows highly seasonal trends requiring careful strategy. While the sections above show seasonal averages, it's also insightful to look at the extremes:
- During the high season, the absolute peak month showcases Bush's highest earning potential, with monthly revenues capable of climbing to $4,967, occupancy reaching a high of 63.0%, and ADRs peaking at $261.
- Conversely, the slowest single month of the year, typically falling within the low season, marks the market's lowest point. In this month, revenue might dip to $649, occupancy could drop to 10.7%, and ADRs may adjust down to $163.
- Understanding both the seasonal averages and these monthly peaks and troughs in revenue, occupancy, and ADR is crucial for maximizing your Airbnb profit potential in Bush.
Seasonal Strategies for Maximizing Profit
- Peak Season: Maximize revenue through premium pricing and potentially longer minimum stays. Ensure high availability.
- Low Season: Offer competitive pricing, special promotions (e.g., extended stay discounts), and flexible cancellation policies. Target off-season travelers like remote workers or budget-conscious guests.
- Shoulder Seasons: Implement dynamic pricing that balances peak and low rates. Target weekend travelers or specific events. Offer slightly more flexible terms than peak season.
- Regularly analyze your own performance against these Bush seasonality benchmarks and adjust your pricing and availability strategy accordingly.
Best Areas for Airbnb Investment in Bush (2026)
Exploring the top neighborhoods for short-term rentals in Bush? This section highlights key areas, outlining why they are attractive for hosts and guests, along with notable local attractions. Consider these locations based on your target guest profile and investment strategy.
| Neighborhood / Area | Why Host Here? (Target Guests & Appeal) | Key Attractions & Landmarks |
|---|---|---|
| Bushy Park | A large Royal Park in London, known for its vast green space, wildlife, and historical landmarks. It attracts families and nature lovers, making it a great spot for Airbnb hosts looking for a peaceful retreat close to the city. | Bushy Park, Royal Deer, The Diana Fountain, Palm House, Hampton Court Palace |
| Hampton Court | Famous for its historic Tudor palace and gardens, this area attracts tourists interested in history and culture. Its proximity to London makes it an ideal location for short-term rentals. | Hampton Court Palace, Hampton Court Gardens, River Thames, Tudor-style architecture, Hampton Court Maze |
| Kingston upon Thames | A vibrant market town known for its shopping, restaurants, and riverside bars. The research indicates a high demand for short stays, especially among visitors to the area’s attractions. | Kingston Market Place, The Bentall Centre, River Thames, Bushy Park (nearby), Historic Town Centre |
| Teddington | A charming residential area with a rural feel, close to the River Thames. Known for its community vibe and green spaces, it appeals to families and potentially long-term guests looking for a more local experience. | Teddington Lock, Bushy Park (nearby), Teddington Studios, Local cafes and shops, River Thames paths |
| Richmond | A picturesque town known for its historic sites, beautiful parks, and vibrant culture. Its proximity to central London makes it a top destination for both tourists and business travelers. | Richmond Park, Richmond Palace, The Thames Path, Kew Gardens (nearby), Richmond Theatre |
| Twickenham | Home to the Rugby Football Union and known as the home of English rugby. The area has a lively atmosphere and attracts sports fans, making it a good choice for event-based rentals. | Twickenham Stadium, The London Irish Centre, Marble Hill House, River Thames, Kings Field |
| Barnes | A quaint village-like area in London known for its riverside charm and artistic community. It’s attractive to those seeking a quiet getaway while still being close to central London. | Barnes Village, The Wetland Centre, The River Thames, Barnes Common, Local shops and cafes |
| Wimbledon | Famous for its tennis championships, this area attracts sports enthusiasts and visitors during the tournament season. It has a variety of accommodations and a lively local culture. | Wimbledon Tennis Club, Wimbledon Common, Polka Theatre, The Village, Historic pubs |
Understanding Airbnb License Requirements & STR Laws in Bush (2026)
While Bush, England, United Kingdom currently shows low STR regulations, specific Airbnb license requirements might still exist or change. Always verify the latest short term rental regulations and Airbnb license requirements directly with local government authorities for Bush to ensure full compliance before hosting.
(Source: AirROI data, 2026, finding no licensed listings among those analyzed)
Top Performing Airbnb Properties in Bush (2026)
Benchmark your potential! Explore examples of top-performing Airbnb properties in Bushbased on Trailing Twelve Month (TTM) revenue. Analyze their characteristics, revenue, occupancy rate, and ADR to understand what drives success in this market.

2 Bed in Bush (oc-h31844)
Entire Place • 2 bedrooms
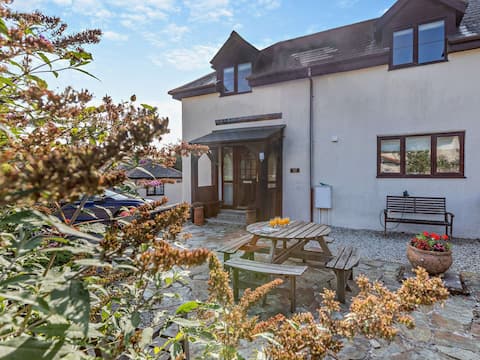
3 Bed in Poughill (TRVVV)
Entire Place • 3 bedrooms
3 bedroom character cottage with distant sea views
Entire Place • 3 bedrooms

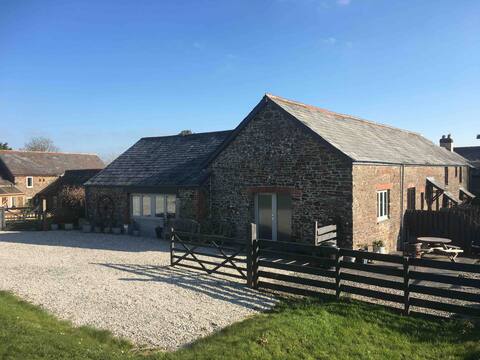
The Granary - cottage with sea views near Bude
Entire Place • 3 bedrooms

3 Bed in Poughill (STAFA)
Entire Place • 3 bedrooms

Mill @ lvyleaf Barton
Entire Place • 2 bedrooms
Note: Performance varies based on location, size, amenities, seasonality, and management quality. Data reflects the past 12 months.
Top Performing Airbnb Hosts in Bush (2026)
Learn from the best! This table showcases top-performing Airbnb hosts in Bush based on the number of properties managed and estimated total revenue over the past year. Analyze their scale and performance metrics.
| Host Name | Properties | Grossing Revenue | Stay Reviews | Avg Rating |
|---|---|---|---|---|
| Jen | 4 | $87,558 | 358 | 4.74/5.0 |
| Holidaycottages.Co.Uk | 2 | $85,709 | 3 | Not Rated |
| Holidaycottages.Co.Uk | 1 | $73,105 | 1 | Not Rated |
| Karen & James | 1 | $25,967 | 149 | 4.73/5.0 |
| Katherine | 3 | $23,311 | 73 | 4.78/5.0 |
| Ann | 2 | $19,667 | 8 | 5.00/5.0 |
| Philip | 1 | $15,052 | 151 | 4.89/5.0 |
| Greg | 1 | $8,531 | 19 | 4.89/5.0 |
| Holly | 3 | $7,916 | 19 | 4.89/5.0 |
| Elizabeth | 1 | $5,181 | 370 | 4.93/5.0 |
Analyzing the strategies of top hosts, such as their property selection, pricing, and guest communication, can offer valuable lessons for optimizing your own Airbnb operations in Bush.
Dive Deeper: Advanced Bush STR Market Data (2026)
Ready to unlock more insights? AirROI provides access to advanced metrics and comprehensive Airbnb data for Bush. Explore detailed analytics beyond this report to refine your investment strategy, optimize pricing, and maximize your vacation rental profits.
Explore Advanced MetricsBush Short-Term Rental Market Composition (2026): Property & Room Types
Room Type Distribution
Property Type Distribution
Market Composition Insights for Bush
- The Bush Airbnb market composition is heavily skewed towards Entire Home/Apt listings, which make up 84.2% of the 19 active rentals. This indicates strong guest preference for privacy and space.
- Looking at the property type distribution in Bush, House properties are the most common (57.9%), reflecting the local real estate landscape.
- Houses represent a significant 57.9% portion, catering likely to families or larger groups.
- The presence of 15.8% Hotel/Boutique listings indicates integration with traditional hospitality.
Bush Airbnb Room Capacity Analysis (2026): Bedroom Distribution
Distribution of Listings by Number of Bedrooms
Room Capacity Insights for Bush
- The dominant room capacity in Bush is 1 bedroom listings, making up 31.6% of the market. This suggests a strong demand for properties suitable for couples or solo travelers.
- Together, 1 bedroom and 3 bedrooms properties represent 63.2% of the active Airbnb listings in Bush, indicating a high concentration in these sizes.
- A significant 31.6% of listings offer 3+ bedrooms, catering to larger groups and families seeking more space in Bush.
Bush Vacation Rental Guest Capacity Trends (2026)
Distribution of Listings by Guest Capacity
Guest Capacity Insights for Bush
- The most common guest capacity trend in Bush vacation rentals is listings accommodating 6 guests (31.6%). This suggests the primary traveler segment is likely larger groups.
- Properties designed for 6 guests and 2 guests dominate the Bush STR market, accounting for 63.2% of listings.
- 31.6% of properties accommodate 6+ guests, serving the market segment for larger families or group travel in Bush.
- On average, properties in Bush are equipped to host 3.4 guests.
Bush Airbnb Booking Patterns (2026): Available vs. Booked Days
Available Days Distribution
Booked Days Distribution
Booking Pattern Insights for Bush
- The most common availability pattern in Bush falls within the 271-366 days range, representing 57.9% of listings. This suggests many properties have significant open periods on their calendars.
- Approximately 84.2% of listings show high availability (181+ days open annually), indicating potential for increased bookings or specific owner usage patterns.
- For booked days, the 91-180 days range is most frequent in Bush (36.8%), reflecting common guest stay durations or potential owner blocking patterns.
- A notable 15.8% of properties secure long booking periods (181+ days booked per year), highlighting successful long-term rental strategies or significant owner usage.
Bush Airbnb Minimum Stay Requirements Analysis
Distribution of Listings by Minimum Night Requirement
1 Night
2 listings
10.5% of total
2 Nights
11 listings
57.9% of total
4-6 Nights
1 listings
5.3% of total
30+ Nights
5 listings
26.3% of total
Key Insights
- The most prevalent minimum stay requirement in Bush is 2 Nights, adopted by 57.9% of listings. This highlights the market's preference for shorter, flexible bookings.
- A strong majority (68.4%) of the Bush Airbnb data shows acceptance of very short stays (1-2 nights), indicating a dynamic, high-turnover market.
- A significant segment (26.3%) caters to monthly stays (30+ nights) in Bush, pointing to opportunities in the extended-stay market.
Recommendations
- Align with the market by considering a 2 Nights minimum stay, as 57.9% of Bush hosts use this setting.
- If feasible, allowing 1-night stays, especially midweek or during low season, could capture last-minute bookings, as only 10.5% currently do.
- A 2-night minimum appears standard (57.9%). Consider this for weekends or peak periods.
- Explore offering discounts for stays of 30+ nights to attract the 26.3% of the market seeking extended stays.
- Adjust minimum nights based on seasonality – potentially shorter during low season and longer during peak demand periods in Bush.
Bush Airbnb Cancellation Policy Trends Analysis (2026)
Super Strict 60 Days
3 listings
15.8% of total
Moderate
8 listings
42.1% of total
Firm
5 listings
26.3% of total
Strict
3 listings
15.8% of total
Cancellation Policy Insights for Bush
- The prevailing Airbnb cancellation policy trend in Bush is Moderate, used by 42.1% of listings.
- There's a relatively balanced mix between guest-friendly (42.1%) and stricter (42.1%) policies, offering choices for different guest needs.
Recommendations for Hosts
- Consider adopting a Moderate policy to align with the 42.1% market standard in Bush.
- Regularly review your cancellation policy against competitors and market demand shifts in Bush.
Bush STR Booking Lead Time Analysis (2026)
Average Booking Lead Time by Month
Booking Lead Time Insights for Bush
- The overall average booking lead time for vacation rentals in Bush is 49 days.
- Guests book furthest in advance for stays during August (average 79 days), likely coinciding with peak travel demand or local events.
- The shortest booking windows occur for stays in January (average 8 days), indicating more last-minute travel plans during this time.
- Seasonally, Summer (55 days avg.) sees the longest lead times, while Winter (16 days avg.) has the shortest, reflecting typical travel planning cycles.
Recommendations for Hosts
- Use the overall average lead time (49 days) as a baseline for your pricing and availability strategy in Bush.
- For August stays, consider implementing length-of-stay discounts or slightly higher rates for bookings made less than 79 days out to capitalize on advance planning.
- During January, focus on last-minute booking availability and promotions, as guests book with very short notice (8 days avg.).
- Target marketing efforts for the Summer season well in advance (at least 55 days) to capture early planners.
- Monitor your own booking lead times against these Bush averages to identify opportunities for dynamic pricing adjustments.
Popular & Essential Airbnb Amenities in Bush (2026)
Amenity Prevalence
Amenity Insights for Bush
- Essential amenities in Bush that guests expect include: Hot water, Dishes and silverware, Smoke alarm, Bed linens. Lacking these (any) could significantly impact bookings.
- Popular amenities like Heating, Free parking on premises, Wifi are common but not universal. Offering these can provide a competitive edge.
- Warning: Wifi is not universally provided but is considered essential globally. Ensure reliable Wifi is offered.
Recommendations for Hosts
- Ensure your listing includes all essential amenities for Bush: Hot water, Dishes and silverware, Smoke alarm, Bed linens.
- Consider adding popular differentiators like Heating or Free parking on premises to increase appeal.
- Highlight unique or less common amenities you offer (e.g., hot tub, dedicated workspace, EV charger) in your listing description and photos.
- Regularly check competitor amenities in Bush to stay competitive.
Bush Airbnb Guest Demographics & Profile Analysis (2026)
Guest Profile Summary for Bush
- The typical guest profile for Airbnb in Bush consists of primarily domestic travelers (96%), often arriving from nearby England, typically belonging to the Post-2000s (Gen Z/Alpha) group (50%), primarily speaking English or French.
- Domestic travelers account for 95.5% of guests.
- Key international markets include United Kingdom (95.5%) and South Africa (1.5%).
- Top languages spoken are English (82.4%) followed by French (11.8%).
- A significant demographic segment is the Post-2000s (Gen Z/Alpha) group, representing 50% of guests.
Recommendations for Hosts
- Target domestic marketing efforts towards travelers from England and London.
- Tailor amenities and listing descriptions to appeal to the dominant Post-2000s (Gen Z/Alpha) demographic (e.g., highlight fast WiFi, smart home features, local guides).
- Highlight unique local experiences or amenities relevant to the primary guest profile.
- Consider seasonal promotions aligned with peak travel times for key origin markets.
Nearby Short-Term Rental Market Comparison
How does the Bush Airbnb market stack up against its neighbors? Compare key performance metrics like average monthly revenue, ADR, and occupancy rates in surrounding areas to understand the broader regional STR landscape.
| Market | Active Properties | Monthly Revenue | Daily Rate | Avg. Occupancy |
|---|---|---|---|---|
| Angle | 13 | $6,069 | $626.63 | 50% |
| Milverton | 10 | $5,067 | $377.17 | 48% |
| Southerndown | 16 | $5,064 | $409.45 | 46% |
| Southgate | 13 | $4,781 | $282.69 | 56% |
| Bridgwater | 18 | $4,662 | $355.91 | 53% |
| Crai | 31 | $4,496 | $552.02 | 38% |
| New Polzeath | 17 | $4,089 | $281.24 | 54% |
| Llantrisant | 15 | $4,086 | $275.56 | 44% |
| Trenance | 25 | $4,037 | $513.80 | 39% |
| Rhossili | 30 | $4,019 | $313.39 | 50% |