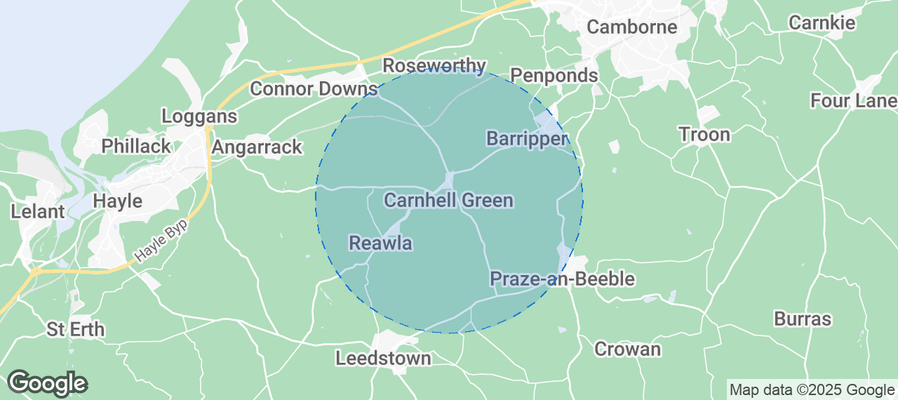
Carnhell Green Airbnb Market Analysis 2026: Short Term Rental Data & Vacation Rental Statistics in England, United Kingdom
Is Airbnb profitable in Carnhell Green in 2026? Explore comprehensive Airbnb analytics for Carnhell Green, England, United Kingdom to uncover income potential. This 2026 STR market report for Carnhell Green, based on AirROI data from February 2025 to January 2026, reveals key trends in the niche market of 19 active listings.
Whether you're considering an Airbnb investment in Carnhell Green, optimizing your existing vacation rental, or exploring rental arbitrage opportunities, understanding the Carnhell Green Airbnb data is crucial. Leveraging the low regulation environment is key to maximizing your short term rental income potential. Let's dive into the specifics.
Key Carnhell Green Airbnb Performance Metrics Overview
Monthly Airbnb Revenue Variations & Income Potential in Carnhell Green (2026)
Understanding the monthly revenue variations for Airbnb listings in Carnhell Green is key to maximizing your short term rental income potential. Seasonality significantly impacts earnings. Our analysis, based on data from the past 12 months, shows that the peak revenue month for STRs in Carnhell Green is typically July, while October often presents the lowest earnings, highlighting opportunities for strategic pricing adjustments during shoulder and low seasons. Explore the typical Airbnb income in Carnhell Green across different performance tiers:
- Best-in-class properties (Top 10%) achieve $3,732+ monthly, often utilizing dynamic pricing and superior guest experiences.
- Strong performing properties (Top 25%) earn $2,789 or more, indicating effective management and desirable locations/amenities.
- Typical properties (Median) generate around $1,659 per month, representing the average market performance.
- Entry-level properties (Bottom 25%) see earnings around $776, often with potential for optimization.
Average Monthly Airbnb Earnings Trend in Carnhell Green
Carnhell Green Airbnb Occupancy Rate Trends (2026)
Maximize your bookings by understanding the Carnhell Green STR occupancy trends. Seasonal demand shifts significantly influence how often properties are booked. Typically, Julysees the highest demand (peak season occupancy), while January experiences the lowest (low season). Effective strategies, like adjusting minimum stays or offering promotions, can boost occupancy during slower periods. Here's how different property tiers perform in Carnhell Green:
- Best-in-class properties (Top 10%) achieve 68%+ occupancy, indicating high desirability and potentially optimized availability.
- Strong performing properties (Top 25%) maintain 51% or higher occupancy, suggesting good market fit and guest satisfaction.
- Typical properties (Median) have an occupancy rate around 31%.
- Entry-level properties (Bottom 25%) average 13% occupancy, potentially facing higher vacancy.
Average Monthly Occupancy Rate Trend in Carnhell Green
Average Daily Rate (ADR) Airbnb Trends in Carnhell Green (2026)
Effective short term rental pricing strategy in Carnhell Green involves understanding monthly ADR fluctuations. The Average Daily Rate (ADR) for Airbnb in Carnhell Green typically peaks in August and dips lowest during February. Leveraging Airbnb dynamic pricing tools or strategies based on this seasonality can significantly boost revenue. Here's a look at the typical nightly rates achieved:
- Best-in-class properties (Top 10%) command rates of $355+ per night, often due to premium features or locations.
- Strong performing properties (Top 25%) achieve nightly rates of $256 or more.
- Typical properties (Median) charge around $146 per night.
- Entry-level properties (Bottom 25%) earn around $109 per night.
Average Daily Rate (ADR) Trend by Month in Carnhell Green
Get Live Carnhell Green Market Intelligence 👇
Explore Real-time Analytics
Airbnb Seasonality Analysis & Trends in Carnhell Green (2026)
Peak Season (July, March, August)
- Revenue averages $2,659 per month
- Occupancy rates average 51.7%
- Daily rates average $216
Shoulder Season
- Revenue averages $1,843 per month
- Occupancy maintains around 33.2%
- Daily rates hold near $209
Low Season (January, February, October)
- Revenue drops to average $1,373 per month
- Occupancy decreases to average 23.5%
- Daily rates adjust to average $200
Seasonality Insights for Carnhell Green
- The Airbnb seasonality in Carnhell Green shows highly seasonal trends requiring careful strategy. While the sections above show seasonal averages, it's also insightful to look at the extremes:
- During the high season, the absolute peak month showcases Carnhell Green's highest earning potential, with monthly revenues capable of climbing to $2,996, occupancy reaching a high of 60.3%, and ADRs peaking at $229.
- Conversely, the slowest single month of the year, typically falling within the low season, marks the market's lowest point. In this month, revenue might dip to $1,269, occupancy could drop to 21.0%, and ADRs may adjust down to $190.
- Understanding both the seasonal averages and these monthly peaks and troughs in revenue, occupancy, and ADR is crucial for maximizing your Airbnb profit potential in Carnhell Green.
Seasonal Strategies for Maximizing Profit
- Peak Season: Maximize revenue through premium pricing and potentially longer minimum stays. Ensure high availability.
- Low Season: Offer competitive pricing, special promotions (e.g., extended stay discounts), and flexible cancellation policies. Target off-season travelers like remote workers or budget-conscious guests.
- Shoulder Seasons: Implement dynamic pricing that balances peak and low rates. Target weekend travelers or specific events. Offer slightly more flexible terms than peak season.
- Regularly analyze your own performance against these Carnhell Green seasonality benchmarks and adjust your pricing and availability strategy accordingly.
Best Areas for Airbnb Investment in Carnhell Green (2026)
Exploring the top neighborhoods for short-term rentals in Carnhell Green? This section highlights key areas, outlining why they are attractive for hosts and guests, along with notable local attractions. Consider these locations based on your target guest profile and investment strategy.
| Neighborhood / Area | Why Host Here? (Target Guests & Appeal) | Key Attractions & Landmarks |
|---|---|---|
| Penzance | A charming coastal town with stunning beaches and a rich cultural heritage, perfect for attracting holidaymakers looking for a seaside escape. | St Michael's Mount, Penlee House Gallery, Penzance Promenade, Newlyn Art Gallery, The Exchange Gallery |
| St Ives | A picturesque fishing village known for its art scene and beautiful beaches, ideal for tourists seeking an artistic and scenic getaway. | The Tate St Ives, St Ives Harbour, Porthminster Beach, The Barbara Hepworth Museum, Leach Pottery |
| Falmouth | A vibrant town known for its maritime history and beautiful coastal scenery, popular with visitors looking for both culture and adventure. | National Maritime Museum, Falmouth Harbour, Pendennis Castle, Falmouth Art Gallery, Gyllyngvase Beach |
| Helston | Famous for the Flora Day festival and nearby natural attractions, great for families and cultural enthusiasts. | Lizard Point, The Cornish Seal Sanctuary, Helston Museum, Penrose Estate, Gweek Seal Sanctuary |
| Marazion | Offers direct access to St Michael's Mount and beautiful coastal views, appealing to tourists and nature lovers alike. | St Michael's Mount, Marazion Beach, Marazion Marsh, The Godolphin Arms, Trencrom Hill |
| Hayle | A gateway to stunning beaches and nature reserves, perfect for outdoor enthusiasts and holidaymakers. | Hayle Towans Beach, RSPB Marazion Marsh, The Paradise Park, West Cornwall Golf Club, Copperhouse Pool |
| Camborne | Rich in mining heritage and close to other attractions, suitable for tourists interested in history and local culture. | Heartlands, Camborne-Redruth Mining Heritage, Tremorvah Playing Fields, Tehidy Country Park, Pitch and Putt |
| Liskeard | A market town close to the scenic Bodmin Moor, ideal for visitors wanting to experience Cornwall's natural beauty. | Liskeard's Market, The Looe Valley Trail, Restormel Castle, Liskeard Museum, Bodmin Moor |
Understanding Airbnb License Requirements & STR Laws in Carnhell Green (2026)
While Carnhell Green, England, United Kingdom currently shows low STR regulations, specific Airbnb license requirements might still exist or change. Always verify the latest short term rental regulations and Airbnb license requirements directly with local government authorities for Carnhell Green to ensure full compliance before hosting.
(Source: AirROI data, 2026, finding no licensed listings among those analyzed)
Top Performing Airbnb Properties in Carnhell Green (2026)
Benchmark your potential! Explore examples of top-performing Airbnb properties in Carnhell Greenbased on Trailing Twelve Month (TTM) revenue. Analyze their characteristics, revenue, occupancy rate, and ADR to understand what drives success in this market.
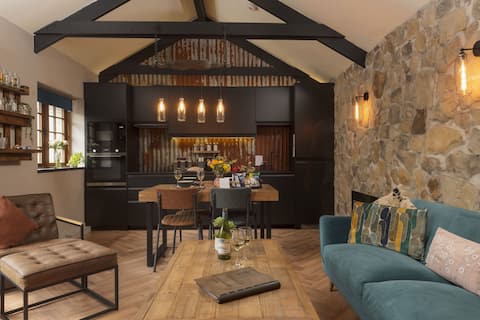
The Old Dairy
Entire Place • 2 bedrooms
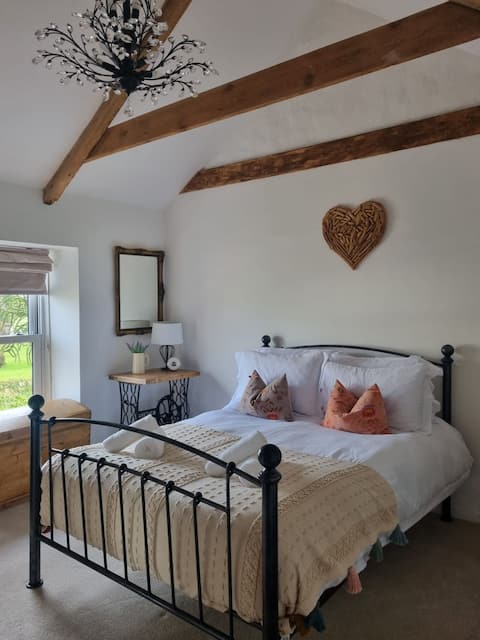
Border Cottage, Carnhell Green, Cornwall
Entire Place • 2 bedrooms
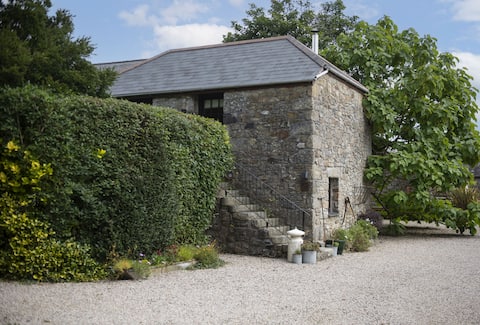
The Hay loft
Entire Place • 1 bedroom
The Corner Cottage
Entire Place • 1 bedroom
Brand new, Gwithian lodge, eco home
Entire Place • 2 bedrooms
Delightful shepherd’s hut in peaceful location
Entire Place • 1 bedroom
Note: Performance varies based on location, size, amenities, seasonality, and management quality. Data reflects the past 12 months.
Top Performing Airbnb Hosts in Carnhell Green (2026)
Learn from the best! This table showcases top-performing Airbnb hosts in Carnhell Green based on the number of properties managed and estimated total revenue over the past year. Analyze their scale and performance metrics.
| Host Name | Properties | Grossing Revenue | Stay Reviews | Avg Rating |
|---|---|---|---|---|
| Cornwall Hideaways Ltd TA Corn | 4 | $99,022 | 35 | 4.92/5.0 |
| Teri | 1 | $38,855 | 69 | 4.97/5.0 |
| Francesca | 4 | $29,364 | 121 | 4.93/5.0 |
| Darren | 1 | $16,979 | 26 | 4.73/5.0 |
| Tom | 1 | $16,734 | 195 | 4.95/5.0 |
| Marie | 1 | $16,470 | 99 | 4.95/5.0 |
| Chris | 1 | $15,788 | 116 | 4.93/5.0 |
| Norma Jane | 1 | $14,836 | 135 | 4.96/5.0 |
| Julia | 1 | $13,800 | 28 | 4.96/5.0 |
| Caroline | 3 | $6,557 | 27 | 4.73/5.0 |
Analyzing the strategies of top hosts, such as their property selection, pricing, and guest communication, can offer valuable lessons for optimizing your own Airbnb operations in Carnhell Green.
Dive Deeper: Advanced Carnhell Green STR Market Data (2026)
Ready to unlock more insights? AirROI provides access to advanced metrics and comprehensive Airbnb data for Carnhell Green. Explore detailed analytics beyond this report to refine your investment strategy, optimize pricing, and maximize your vacation rental profits.
Explore Advanced MetricsCarnhell Green Short-Term Rental Market Composition (2026): Property & Room Types
Room Type Distribution
Property Type Distribution
Market Composition Insights for Carnhell Green
- The Carnhell Green Airbnb market composition is heavily skewed towards Entire Home/Apt listings, which make up 100% of the 19 active rentals. This indicates strong guest preference for privacy and space.
- Looking at the property type distribution in Carnhell Green, House properties are the most common (52.6%), reflecting the local real estate landscape.
- Houses represent a significant 52.6% portion, catering likely to families or larger groups.
Carnhell Green Airbnb Room Capacity Analysis (2026): Bedroom Distribution
Distribution of Listings by Number of Bedrooms
Room Capacity Insights for Carnhell Green
- The dominant room capacity in Carnhell Green is 1 bedroom listings, making up 63.2% of the market. This suggests a strong demand for properties suitable for couples or solo travelers.
- Together, 1 bedroom and 2 bedrooms properties represent 84.3% of the active Airbnb listings in Carnhell Green, indicating a high concentration in these sizes.
- With over half the market (63.2%) consisting of studios or 1-bedroom units, Carnhell Green is particularly well-suited for individuals or couples.
Carnhell Green Vacation Rental Guest Capacity Trends (2026)
Distribution of Listings by Guest Capacity
Guest Capacity Insights for Carnhell Green
- The most common guest capacity trend in Carnhell Green vacation rentals is listings accommodating 2 guests (42.1%). This suggests the primary traveler segment is likely couples or solo travelers.
- Properties designed for 2 guests and 4 guests dominate the Carnhell Green STR market, accounting for 78.9% of listings.
- A significant 42.1% of listings cater specifically to 1-2 guests, highlighting strong demand from couples and solo travelers in Carnhell Green.
- On average, properties in Carnhell Green are equipped to host 3.4 guests.
Carnhell Green Airbnb Booking Patterns (2026): Available vs. Booked Days
Available Days Distribution
Booked Days Distribution
Booking Pattern Insights for Carnhell Green
- The most common availability pattern in Carnhell Green falls within the 271-366 days range, representing 63.2% of listings. This suggests many properties have significant open periods on their calendars.
- Approximately 94.8% of listings show high availability (181+ days open annually), indicating potential for increased bookings or specific owner usage patterns.
- For booked days, the 31-90 days range is most frequent in Carnhell Green (36.8%), reflecting common guest stay durations or potential owner blocking patterns.
- A notable 5.3% of properties secure long booking periods (181+ days booked per year), highlighting successful long-term rental strategies or significant owner usage.
Carnhell Green Airbnb Minimum Stay Requirements Analysis
Distribution of Listings by Minimum Night Requirement
1 Night
3 listings
15.8% of total
2 Nights
7 listings
36.8% of total
3 Nights
2 listings
10.5% of total
30+ Nights
7 listings
36.8% of total
Key Insights
- The most prevalent minimum stay requirement in Carnhell Green is 2 Nights, adopted by 36.8% of listings. This highlights the market's preference for shorter, flexible bookings.
- A significant segment (36.8%) caters to monthly stays (30+ nights) in Carnhell Green, pointing to opportunities in the extended-stay market.
Recommendations
- Align with the market by considering a 2 Nights minimum stay, as 36.8% of Carnhell Green hosts use this setting.
- If feasible, allowing 1-night stays, especially midweek or during low season, could capture last-minute bookings, as only 15.8% currently do.
- A 2-night minimum appears standard (36.8%). Consider this for weekends or peak periods.
- Explore offering discounts for stays of 30+ nights to attract the 36.8% of the market seeking extended stays.
- Adjust minimum nights based on seasonality – potentially shorter during low season and longer during peak demand periods in Carnhell Green.
Carnhell Green Airbnb Cancellation Policy Trends Analysis (2026)
Super Strict 60 Days
1 listings
5.3% of total
Super Strict 30 Days
4 listings
21.1% of total
Flexible
3 listings
15.8% of total
Moderate
6 listings
31.6% of total
Firm
3 listings
15.8% of total
Strict
2 listings
10.5% of total
Cancellation Policy Insights for Carnhell Green
- The prevailing Airbnb cancellation policy trend in Carnhell Green is Moderate, used by 31.6% of listings.
- There's a relatively balanced mix between guest-friendly (47.4%) and stricter (26.3%) policies, offering choices for different guest needs.
Recommendations for Hosts
- Consider adopting a Moderate policy to align with the 31.6% market standard in Carnhell Green.
- Using a Strict policy might deter some guests, as only 10.5% of listings use it. Evaluate if potential revenue protection outweighs possible lower booking rates.
- Regularly review your cancellation policy against competitors and market demand shifts in Carnhell Green.
Carnhell Green STR Booking Lead Time Analysis (2026)
Average Booking Lead Time by Month
Booking Lead Time Insights for Carnhell Green
- The overall average booking lead time for vacation rentals in Carnhell Green is 41 days.
- Guests book furthest in advance for stays during June (average 61 days), likely coinciding with peak travel demand or local events.
- The shortest booking windows occur for stays in February (average 13 days), indicating more last-minute travel plans during this time.
- Seasonally, Summer (55 days avg.) sees the longest lead times, while Winter (28 days avg.) has the shortest, reflecting typical travel planning cycles.
Recommendations for Hosts
- Use the overall average lead time (41 days) as a baseline for your pricing and availability strategy in Carnhell Green.
- For June stays, consider implementing length-of-stay discounts or slightly higher rates for bookings made less than 61 days out to capitalize on advance planning.
- During February, focus on last-minute booking availability and promotions, as guests book with very short notice (13 days avg.).
- Target marketing efforts for the Summer season well in advance (at least 55 days) to capture early planners.
- Monitor your own booking lead times against these Carnhell Green averages to identify opportunities for dynamic pricing adjustments.
Popular & Essential Airbnb Amenities in Carnhell Green (2026)
Amenity Prevalence
Amenity Insights for Carnhell Green
- Popular amenities like Free parking on premises, Smoke alarm, BBQ grill are common but not universal. Offering these can provide a competitive edge.
- Warning: Wifi is not universally provided but is considered essential globally. Ensure reliable Wifi is offered.
Recommendations for Hosts
- Consider adding popular differentiators like Free parking on premises or Smoke alarm to increase appeal.
- Highlight unique or less common amenities you offer (e.g., hot tub, dedicated workspace, EV charger) in your listing description and photos.
- Regularly check competitor amenities in Carnhell Green to stay competitive.
Carnhell Green Airbnb Guest Demographics & Profile Analysis (2026)
Guest Profile Summary for Carnhell Green
- The typical guest profile for Airbnb in Carnhell Green consists of primarily domestic travelers (91%), often arriving from nearby England, typically belonging to the Post-2000s (Gen Z/Alpha) group (50%), primarily speaking English or German.
- Domestic travelers account for 91.3% of guests.
- Key international markets include United Kingdom (91.3%) and Netherlands (2.6%).
- Top languages spoken are English (63.6%) followed by German (7.3%).
- A significant demographic segment is the Post-2000s (Gen Z/Alpha) group, representing 50% of guests.
Recommendations for Hosts
- Target domestic marketing efforts towards travelers from England and London.
- Tailor amenities and listing descriptions to appeal to the dominant Post-2000s (Gen Z/Alpha) demographic (e.g., highlight fast WiFi, smart home features, local guides).
- Highlight unique local experiences or amenities relevant to the primary guest profile.
- Consider seasonal promotions aligned with peak travel times for key origin markets.
Nearby Short-Term Rental Market Comparison
How does the Carnhell Green Airbnb market stack up against its neighbors? Compare key performance metrics like average monthly revenue, ADR, and occupancy rates in surrounding areas to understand the broader regional STR landscape.
| Market | Active Properties | Monthly Revenue | Daily Rate | Avg. Occupancy |
|---|---|---|---|---|
| Angle | 13 | $6,069 | $626.63 | 50% |
| Southgate | 13 | $4,781 | $282.69 | 56% |
| New Polzeath | 17 | $4,089 | $281.24 | 54% |
| Trenance | 25 | $4,037 | $513.80 | 39% |
| Rhossili | 30 | $4,019 | $313.39 | 50% |
| Redberth | 32 | $3,877 | $241.56 | 58% |
| Tiers Cross | 14 | $3,820 | $242.78 | 56% |
| Menheniot | 11 | $3,749 | $349.76 | 45% |
| Kilgetty | 11 | $3,655 | $224.14 | 59% |
| St Issey | 23 | $3,638 | $391.14 | 39% |