Coalbrookdale Airbnb Market Analysis 2025: Short Term Rental Data & Vacation Rental Statistics in England, United Kingdom
Is Airbnb profitable in Coalbrookdale in 2025? Explore comprehensive Airbnb analytics for Coalbrookdale, England, United Kingdom to uncover income potential. This 2025 STR market report for Coalbrookdale, based on AirROI data from October 2024 to September 2025, reveals key trends in the niche market of 18 active listings.
Whether you're considering an Airbnb investment in Coalbrookdale, optimizing your existing vacation rental, or exploring rental arbitrage opportunities, understanding the Coalbrookdale Airbnb data is crucial. Leveraging the low regulation environment is key to maximizing your short term rental income potential. Let's dive into the specifics.
Key Coalbrookdale Airbnb Performance Metrics Overview
Monthly Airbnb Revenue Variations & Income Potential in Coalbrookdale (2025)
Understanding the monthly revenue variations for Airbnb listings in Coalbrookdale is key to maximizing your short term rental income potential. Seasonality significantly impacts earnings. Our analysis, based on data from the past 12 months, shows that the peak revenue month for STRs in Coalbrookdale is typically August, while January often presents the lowest earnings, highlighting opportunities for strategic pricing adjustments during shoulder and low seasons. Explore the typical Airbnb income in Coalbrookdale across different performance tiers:
- Best-in-class properties (Top 10%) achieve $6,150+ monthly, often utilizing dynamic pricing and superior guest experiences.
- Strong performing properties (Top 25%) earn $4,479 or more, indicating effective management and desirable locations/amenities.
- Typical properties (Median) generate around $2,586 per month, representing the average market performance.
- Entry-level properties (Bottom 25%) see earnings around $1,736, often with potential for optimization.
Average Monthly Airbnb Earnings Trend in Coalbrookdale
Coalbrookdale Airbnb Occupancy Rate Trends (2025)
Maximize your bookings by understanding the Coalbrookdale STR occupancy trends. Seasonal demand shifts significantly influence how often properties are booked. Typically, Augustsees the highest demand (peak season occupancy), while January experiences the lowest (low season). Effective strategies, like adjusting minimum stays or offering promotions, can boost occupancy during slower periods. Here's how different property tiers perform in Coalbrookdale:
- Best-in-class properties (Top 10%) achieve 79%+ occupancy, indicating high desirability and potentially optimized availability.
- Strong performing properties (Top 25%) maintain 68% or higher occupancy, suggesting good market fit and guest satisfaction.
- Typical properties (Median) have an occupancy rate around 53%.
- Entry-level properties (Bottom 25%) average 32% occupancy, potentially facing higher vacancy.
Average Monthly Occupancy Rate Trend in Coalbrookdale
Average Daily Rate (ADR) Airbnb Trends in Coalbrookdale (2025)
Effective short term rental pricing strategy in Coalbrookdale involves understanding monthly ADR fluctuations. The Average Daily Rate (ADR) for Airbnb in Coalbrookdale typically peaks in August and dips lowest during March. Leveraging Airbnb dynamic pricing tools or strategies based on this seasonality can significantly boost revenue. Here's a look at the typical nightly rates achieved:
- Best-in-class properties (Top 10%) command rates of $352+ per night, often due to premium features or locations.
- Strong performing properties (Top 25%) achieve nightly rates of $265 or more.
- Typical properties (Median) charge around $191 per night.
- Entry-level properties (Bottom 25%) earn around $130 per night.
Average Daily Rate (ADR) Trend by Month in Coalbrookdale
Get Live Coalbrookdale Market Intelligence 👇

Explore Real-time Analytics
Airbnb Seasonality Analysis & Trends in Coalbrookdale (2025)
Peak Season (August, July, October)
- Revenue averages $4,298 per month
- Occupancy rates average 61.4%
- Daily rates average $221
Shoulder Season
- Revenue averages $3,224 per month
- Occupancy maintains around 49.5%
- Daily rates hold near $212
Low Season (January, February, November)
- Revenue drops to average $2,550 per month
- Occupancy decreases to average 41.5%
- Daily rates adjust to average $207
Seasonality Insights for Coalbrookdale
- The Airbnb seasonality in Coalbrookdale shows highly seasonal trends requiring careful strategy. While the sections above show seasonal averages, it's also insightful to look at the extremes:
- During the high season, the absolute peak month showcases Coalbrookdale's highest earning potential, with monthly revenues capable of climbing to $4,563, occupancy reaching a high of 62.8%, and ADRs peaking at $225.
- Conversely, the slowest single month of the year, typically falling within the low season, marks the market's lowest point. In this month, revenue might dip to $2,193, occupancy could drop to 33.1%, and ADRs may adjust down to $201.
- Understanding both the seasonal averages and these monthly peaks and troughs in revenue, occupancy, and ADR is crucial for maximizing your Airbnb profit potential in Coalbrookdale.
Seasonal Strategies for Maximizing Profit
- Peak Season: Maximize revenue through premium pricing and potentially longer minimum stays. Ensure high availability.
- Low Season: Offer competitive pricing, special promotions (e.g., extended stay discounts), and flexible cancellation policies. Target off-season travelers like remote workers or budget-conscious guests.
- Shoulder Seasons: Implement dynamic pricing that balances peak and low rates. Target weekend travelers or specific events. Offer slightly more flexible terms than peak season.
- Regularly analyze your own performance against these Coalbrookdale seasonality benchmarks and adjust your pricing and availability strategy accordingly.
Best Areas for Airbnb Investment in Coalbrookdale (2025)
Exploring the top neighborhoods for short-term rentals in Coalbrookdale? This section highlights key areas, outlining why they are attractive for hosts and guests, along with notable local attractions. Consider these locations based on your target guest profile and investment strategy.
| Neighborhood / Area | Why Host Here? (Target Guests & Appeal) | Key Attractions & Landmarks |
|---|---|---|
| Coalbrookdale | Historical village known for its connection to the Industrial Revolution and its stunning natural scenery. It attracts history enthusiasts and nature lovers alike. | Ironbridge Gorge, Coalbrookdale Museum of Iron, The Old Bontanic Gardens, The Severn Valley Railway, Enginuity, The Iron Bridge |
| Ironbridge | Famous for its iconic iron bridge and rich industrial heritage, Ironbridge draws tourists interested in history and engineering. | Iron Bridge, Blists Hill Victorian Town, Misterton Hall, Ironbridge Museum, The Tar Tunnel, The Coalport China Museum |
| Shifnal | Quaint market town with a mix of history and modern amenities, ideal for families and couples looking for a peaceful stay near attractions. | St. Andrew's Church, Shifnal Town Park, The Wrekin Hill, Telford Town Park, The Museum of the Gorge |
| Telford | A bustling town with modern developments and close proximity to various attractions, suitable for business travelers and families. | Telford Shopping Centre, Telford Steam Railway, The International Centre, The Telford Town Park, Dawley Town Hall |
| Newport | Charming market town that's suitable for those looking for a quieter retreat, popular for its historical sites and beautiful countryside. | Newport Museum and Art Gallery, Lilleshall Abbey, Newport Town Hall, The Chetwynd Deer Park, The Shropshire Union Canal |
| Broseley | Picturesque town famous for its quaint streets and beautiful views, perfect for travelers who enjoy peace and scenery. | Broseley Pipeworks, The Benthall Hall, The Ironbridge Gorge Museums, The Church of St Mary, The Broseley Lions |
| Wellington | A vibrant town with a rich history and easy access to the countryside, hosts a mix of culture and good food. | Wellington Market, The Dingle, Wellington Park, Borough Theatre, Orchard Park |
| Market Drayton | A market town known for its culinary offerings, especially the famous gingerbread. Great for food lovers and history buffs. | Market Drayton Museum, The Shropshire Union Canal, Snead's Farm, The Gingerbread Trail, The Old Market Square |
| Much Wenlock | A medieval town offering rich history and tranquil surroundings, popular with travelers seeking a historical experience. | Much Wenlock Priory, The Gaskell Recreation Ground, The Olympic National Heritage Centre, The Wenlock Edge, The Old Gaol |
Understanding Airbnb License Requirements & STR Laws in Coalbrookdale (2025)
While Coalbrookdale, England, United Kingdom currently shows low STR regulations, specific Airbnb license requirements might still exist or change. Always verify the latest short term rental regulations and Airbnb license requirements directly with local government authorities for Coalbrookdale to ensure full compliance before hosting.
(Source: AirROI data, 2025, finding no licensed listings among those analyzed)
Top Performing Airbnb Properties in Coalbrookdale (2025)
Benchmark your potential! Explore examples of top-performing Airbnb properties in Coalbrookdalebased on Trailing Twelve Month (TTM) revenue. Analyze their characteristics, revenue, occupancy rate, and ADR to understand what drives success in this market.
Relaxing Ironbridge Hot Tub Retreat
Entire Place • 4 bedrooms
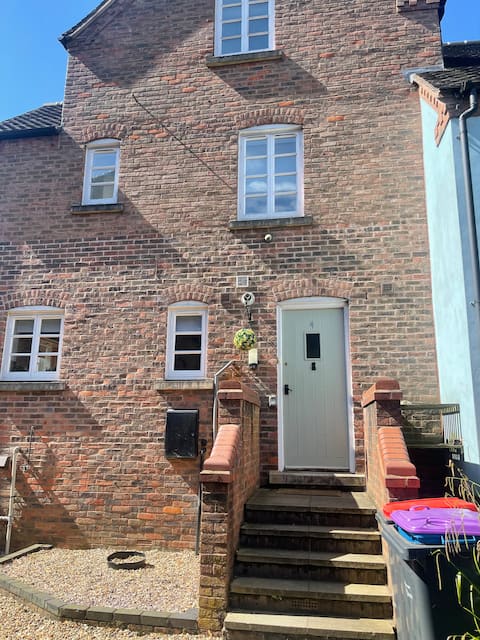
Family Townhouse in the Heart of Ironbridge
Entire Place • 4 bedrooms
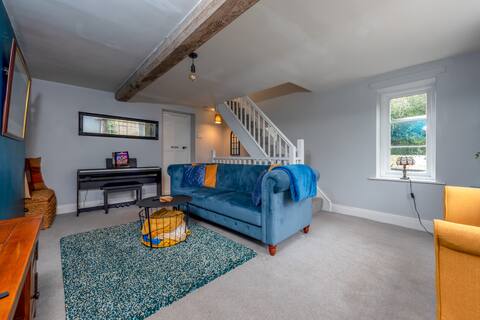
Dale Cottage- Steps from The Iron Bridge
Entire Place • 3 bedrooms

Salthouse Cottage in Ironbridge
Entire Place • 2 bedrooms

School Path Ironbridge Townhouse with Roof Terrace
Entire Place • 3 bedrooms
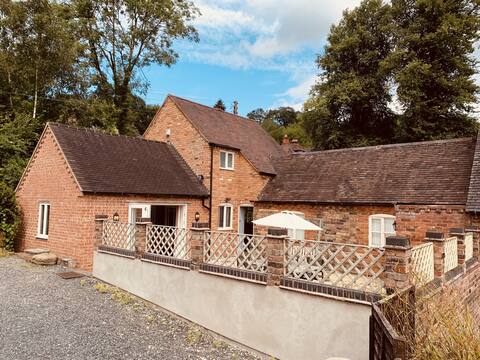
18th Century Mill Cottage
Entire Place • 2 bedrooms
Note: Performance varies based on location, size, amenities, seasonality, and management quality. Data reflects the past 12 months.
Top Performing Airbnb Hosts in Coalbrookdale (2025)
Learn from the best! This table showcases top-performing Airbnb hosts in Coalbrookdale based on the number of properties managed and estimated total revenue over the past year. Analyze their scale and performance metrics.
| Host Name | Properties | Grossing Revenue | Stay Reviews | Avg Rating |
|---|---|---|---|---|
| Affluxi Ltd | 1 | $118,704 | 47 | 4.60/5.0 |
| Hudson Property Group | 4 | $82,584 | 158 | 4.64/5.0 |
| James | 1 | $64,634 | 140 | 4.67/5.0 |
| Charlie | 1 | $56,967 | 51 | 4.80/5.0 |
| Rebecca | 1 | $46,870 | 46 | 4.98/5.0 |
| Jess-Pass The Keys | 1 | $31,934 | 39 | 4.90/5.0 |
| John | 1 | $30,770 | 194 | 4.97/5.0 |
| Alison | 1 | $30,623 | 273 | 4.94/5.0 |
| Holidaycottages.Co.Uk | 1 | $30,217 | 2 | Not Rated |
| Yvonne | 1 | $22,909 | 263 | 4.95/5.0 |
Analyzing the strategies of top hosts, such as their property selection, pricing, and guest communication, can offer valuable lessons for optimizing your own Airbnb operations in Coalbrookdale.
Dive Deeper: Advanced Coalbrookdale STR Market Data (2025)
Ready to unlock more insights? AirROI provides access to advanced metrics and comprehensive Airbnb data for Coalbrookdale. Explore detailed analytics beyond this report to refine your investment strategy, optimize pricing, and maximize your vacation rental profits.
Explore Advanced MetricsCoalbrookdale Short-Term Rental Market Composition (2025): Property & Room Types
Room Type Distribution
Property Type Distribution
Market Composition Insights for Coalbrookdale
- The Coalbrookdale Airbnb market composition is heavily skewed towards Entire Home/Apt listings, which make up 94.4% of the 18 active rentals. This indicates strong guest preference for privacy and space.
- Looking at the property type distribution in Coalbrookdale, House properties are the most common (77.8%), reflecting the local real estate landscape.
- Houses represent a significant 77.8% portion, catering likely to families or larger groups.
- The presence of 5.6% Hotel/Boutique listings indicates integration with traditional hospitality.
Coalbrookdale Airbnb Room Capacity Analysis (2025): Bedroom Distribution
Distribution of Listings by Number of Bedrooms
Room Capacity Insights for Coalbrookdale
- The dominant room capacity in Coalbrookdale is 2 bedrooms listings, making up 38.9% of the market. This suggests a strong demand for properties suitable for couples or solo travelers.
- Together, 2 bedrooms and 3 bedrooms properties represent 66.7% of the active Airbnb listings in Coalbrookdale, indicating a high concentration in these sizes.
- A significant 38.9% of listings offer 3+ bedrooms, catering to larger groups and families seeking more space in Coalbrookdale.
Coalbrookdale Vacation Rental Guest Capacity Trends (2025)
Distribution of Listings by Guest Capacity
Guest Capacity Insights for Coalbrookdale
- The most common guest capacity trend in Coalbrookdale vacation rentals is listings accommodating 6 guests (38.9%). This suggests the primary traveler segment is likely larger groups.
- Properties designed for 6 guests and 4 guests dominate the Coalbrookdale STR market, accounting for 72.2% of listings.
- 50.0% of properties accommodate 6+ guests, serving the market segment for larger families or group travel in Coalbrookdale.
- On average, properties in Coalbrookdale are equipped to host 5.1 guests.
Coalbrookdale Airbnb Booking Patterns (2025): Available vs. Booked Days
Available Days Distribution
Booked Days Distribution
Booking Pattern Insights for Coalbrookdale
- The most common availability pattern in Coalbrookdale falls within the 91-180 days range, representing 38.9% of listings. This suggests many properties have significant open periods on their calendars.
- Approximately 55.5% of listings show high availability (181+ days open annually), indicating potential for increased bookings or specific owner usage patterns.
- For booked days, the 181-270 days range is most frequent in Coalbrookdale (44.4%), reflecting common guest stay durations or potential owner blocking patterns.
- A notable 50.0% of properties secure long booking periods (181+ days booked per year), highlighting successful long-term rental strategies or significant owner usage.
Coalbrookdale Airbnb Minimum Stay Requirements Analysis
Distribution of Listings by Minimum Night Requirement
1 Night
2 listings
11.1% of total
2 Nights
4 listings
22.2% of total
3 Nights
1 listings
5.6% of total
30+ Nights
11 listings
61.1% of total
Key Insights
- The most prevalent minimum stay requirement in Coalbrookdale is 30+ Nights, adopted by 61.1% of listings. This highlights the market's preference for longer commitments.
- A significant segment (61.1%) caters to monthly stays (30+ nights) in Coalbrookdale, pointing to opportunities in the extended-stay market.
Recommendations
- Align with the market by considering a 30+ Nights minimum stay, as 61.1% of Coalbrookdale hosts use this setting.
- If feasible, allowing 1-night stays, especially midweek or during low season, could capture last-minute bookings, as only 11.1% currently do.
- Explore offering discounts for stays of 30+ nights to attract the 61.1% of the market seeking extended stays.
- Adjust minimum nights based on seasonality – potentially shorter during low season and longer during peak demand periods in Coalbrookdale.
Coalbrookdale Airbnb Cancellation Policy Trends Analysis (2025)
Super Strict 60 Days
3 listings
16.7% of total
Super Strict 30 Days
1 listings
5.6% of total
Refundable
1 listings
5.6% of total
Flexible
6 listings
33.3% of total
Moderate
6 listings
33.3% of total
Firm
1 listings
5.6% of total
Cancellation Policy Insights for Coalbrookdale
- The prevailing Airbnb cancellation policy trend in Coalbrookdale is Flexible, used by 33.3% of listings.
- There's a relatively balanced mix between guest-friendly (66.6%) and stricter (5.6%) policies, offering choices for different guest needs.
Recommendations for Hosts
- Consider adopting a Flexible policy to align with the 33.3% market standard in Coalbrookdale.
- Regularly review your cancellation policy against competitors and market demand shifts in Coalbrookdale.
Coalbrookdale STR Booking Lead Time Analysis (2025)
Average Booking Lead Time by Month
Booking Lead Time Insights for Coalbrookdale
- The overall average booking lead time for vacation rentals in Coalbrookdale is 65 days.
- Guests book furthest in advance for stays during May (average 117 days), likely coinciding with peak travel demand or local events.
- The shortest booking windows occur for stays in January (average 52 days), indicating more last-minute travel plans during this time.
- Seasonally, Spring (83 days avg.) sees the longest lead times, while Fall (61 days avg.) has the shortest, reflecting typical travel planning cycles.
Recommendations for Hosts
- Use the overall average lead time (65 days) as a baseline for your pricing and availability strategy in Coalbrookdale.
- For May stays, consider implementing length-of-stay discounts or slightly higher rates for bookings made less than 117 days out to capitalize on advance planning.
- Target marketing efforts for the Spring season well in advance (at least 83 days) to capture early planners.
- Monitor your own booking lead times against these Coalbrookdale averages to identify opportunities for dynamic pricing adjustments.
Popular & Essential Airbnb Amenities in Coalbrookdale (2025)
Amenity Prevalence
Amenity Insights for Coalbrookdale
- Essential amenities in Coalbrookdale that guests expect include: Wifi, Smoke alarm, Heating. Lacking these (any) could significantly impact bookings.
- Popular amenities like Refrigerator, Hot water, Kitchen are common but not universal. Offering these can provide a competitive edge.
Recommendations for Hosts
- Ensure your listing includes all essential amenities for Coalbrookdale: Wifi, Smoke alarm, Heating.
- Consider adding popular differentiators like Refrigerator or Hot water to increase appeal.
- Highlight unique or less common amenities you offer (e.g., hot tub, dedicated workspace, EV charger) in your listing description and photos.
- Regularly check competitor amenities in Coalbrookdale to stay competitive.
Coalbrookdale Airbnb Guest Demographics & Profile Analysis (2025)
Guest Profile Summary for Coalbrookdale
- The typical guest profile for Airbnb in Coalbrookdale consists of primarily domestic travelers (96%), often arriving from nearby England, typically belonging to the Post-2000s (Gen Z/Alpha) group (50%), primarily speaking English or French.
- Domestic travelers account for 96.0% of guests.
- Key international markets include United Kingdom (96%) and United States (1.5%).
- Top languages spoken are English (81.8%) followed by French (6.1%).
- A significant demographic segment is the Post-2000s (Gen Z/Alpha) group, representing 50% of guests.
Recommendations for Hosts
- Target domestic marketing efforts towards travelers from England and London.
- Tailor amenities and listing descriptions to appeal to the dominant Post-2000s (Gen Z/Alpha) demographic (e.g., highlight fast WiFi, smart home features, local guides).
- Highlight unique local experiences or amenities relevant to the primary guest profile.
- Consider seasonal promotions aligned with peak travel times for key origin markets.
Nearby Short-Term Rental Market Comparison
How does the Coalbrookdale Airbnb market stack up against its neighbors? Compare key performance metrics like average monthly revenue, ADR, and occupancy rates in surrounding areas to understand the broader regional STR landscape.
| Market | Active Properties | Monthly Revenue | Daily Rate | Avg. Occupancy |
|---|---|---|---|---|
| Chew Magna | 13 | $7,334 | $430.61 | 46% |
| Long Sutton | 16 | $6,537 | $420.56 | 43% |
| Englishcombe | 15 | $6,334 | $533.72 | 52% |
| Lambourn | 12 | $6,318 | $674.91 | 32% |
| Ashley | 13 | $5,263 | $362.79 | 54% |
| Kintbury | 10 | $5,074 | $266.53 | 55% |
| Southerndown | 14 | $5,033 | $397.07 | 46% |
| Dinton | 11 | $4,995 | $280.30 | 56% |
| Llanbedr Dyffryn Clwyd | 10 | $4,933 | $449.31 | 29% |
| Crai | 31 | $4,743 | $558.69 | 39% |