Corbridge Airbnb Market Analysis 2026: Short Term Rental Data & Vacation Rental Statistics in England, United Kingdom
Is Airbnb profitable in Corbridge in 2026? Explore comprehensive Airbnb analytics for Corbridge, England, United Kingdom to uncover income potential. This 2026 STR market report for Corbridge, based on AirROI data from February 2025 to January 2026, reveals key trends in the niche market of 25 active listings.
Whether you're considering an Airbnb investment in Corbridge, optimizing your existing vacation rental, or exploring rental arbitrage opportunities, understanding the Corbridge Airbnb data is crucial. Leveraging the low regulation environment is key to maximizing your short term rental income potential. Let's dive into the specifics.
Key Corbridge Airbnb Performance Metrics Overview
Monthly Airbnb Revenue Variations & Income Potential in Corbridge (2026)
Understanding the monthly revenue variations for Airbnb listings in Corbridge is key to maximizing your short term rental income potential. Seasonality significantly impacts earnings. Our analysis, based on data from the past 12 months, shows that the peak revenue month for STRs in Corbridge is typically July, while January often presents the lowest earnings, highlighting opportunities for strategic pricing adjustments during shoulder and low seasons. Explore the typical Airbnb income in Corbridge across different performance tiers:
- Best-in-class properties (Top 10%) achieve $4,706+ monthly, often utilizing dynamic pricing and superior guest experiences.
- Strong performing properties (Top 25%) earn $3,722 or more, indicating effective management and desirable locations/amenities.
- Typical properties (Median) generate around $2,314 per month, representing the average market performance.
- Entry-level properties (Bottom 25%) see earnings around $1,568, often with potential for optimization.
Average Monthly Airbnb Earnings Trend in Corbridge
Corbridge Airbnb Occupancy Rate Trends (2026)
Maximize your bookings by understanding the Corbridge STR occupancy trends. Seasonal demand shifts significantly influence how often properties are booked. Typically, Septembersees the highest demand (peak season occupancy), while January experiences the lowest (low season). Effective strategies, like adjusting minimum stays or offering promotions, can boost occupancy during slower periods. Here's how different property tiers perform in Corbridge:
- Best-in-class properties (Top 10%) achieve 83%+ occupancy, indicating high desirability and potentially optimized availability.
- Strong performing properties (Top 25%) maintain 74% or higher occupancy, suggesting good market fit and guest satisfaction.
- Typical properties (Median) have an occupancy rate around 53%.
- Entry-level properties (Bottom 25%) average 29% occupancy, potentially facing higher vacancy.
Average Monthly Occupancy Rate Trend in Corbridge
Average Daily Rate (ADR) Airbnb Trends in Corbridge (2026)
Effective short term rental pricing strategy in Corbridge involves understanding monthly ADR fluctuations. The Average Daily Rate (ADR) for Airbnb in Corbridge typically peaks in August and dips lowest during March. Leveraging Airbnb dynamic pricing tools or strategies based on this seasonality can significantly boost revenue. Here's a look at the typical nightly rates achieved:
- Best-in-class properties (Top 10%) command rates of $277+ per night, often due to premium features or locations.
- Strong performing properties (Top 25%) achieve nightly rates of $235 or more.
- Typical properties (Median) charge around $179 per night.
- Entry-level properties (Bottom 25%) earn around $124 per night.
Average Daily Rate (ADR) Trend by Month in Corbridge
Get Live Corbridge Market Intelligence 👇

Explore Real-time Analytics
Airbnb Seasonality Analysis & Trends in Corbridge (2026)
Peak Season (July, August, September)
- Revenue averages $3,565 per month
- Occupancy rates average 66.4%
- Daily rates average $194
Shoulder Season
- Revenue averages $2,742 per month
- Occupancy maintains around 53.2%
- Daily rates hold near $187
Low Season (January, March, November)
- Revenue drops to average $1,690 per month
- Occupancy decreases to average 34.5%
- Daily rates adjust to average $181
Seasonality Insights for Corbridge
- The Airbnb seasonality in Corbridge shows highly seasonal trends requiring careful strategy. While the sections above show seasonal averages, it's also insightful to look at the extremes:
- During the high season, the absolute peak month showcases Corbridge's highest earning potential, with monthly revenues capable of climbing to $3,640, occupancy reaching a high of 67.7%, and ADRs peaking at $199.
- Conversely, the slowest single month of the year, typically falling within the low season, marks the market's lowest point. In this month, revenue might dip to $1,509, occupancy could drop to 23.8%, and ADRs may adjust down to $178.
- Understanding both the seasonal averages and these monthly peaks and troughs in revenue, occupancy, and ADR is crucial for maximizing your Airbnb profit potential in Corbridge.
Seasonal Strategies for Maximizing Profit
- Peak Season: Maximize revenue through premium pricing and potentially longer minimum stays. Ensure high availability.
- Low Season: Offer competitive pricing, special promotions (e.g., extended stay discounts), and flexible cancellation policies. Target off-season travelers like remote workers or budget-conscious guests.
- Shoulder Seasons: Implement dynamic pricing that balances peak and low rates. Target weekend travelers or specific events. Offer slightly more flexible terms than peak season.
- Regularly analyze your own performance against these Corbridge seasonality benchmarks and adjust your pricing and availability strategy accordingly.
Best Areas for Airbnb Investment in Corbridge (2026)
Exploring the top neighborhoods for short-term rentals in Corbridge? This section highlights key areas, outlining why they are attractive for hosts and guests, along with notable local attractions. Consider these locations based on your target guest profile and investment strategy.
| Neighborhood / Area | Why Host Here? (Target Guests & Appeal) | Key Attractions & Landmarks |
|---|---|---|
| Corbridge Village | Charming historic village with picturesque streets and ancient Roman history. Attracts tourists looking for a quaint English village experience with local shops and cafes. | Corbridge Roman Town, St Andrew's Church, Corbridge Market, Hexham Abbey, Tyne Valley Rail Trail |
| Hadrian's Wall | Famous UNESCO World Heritage Site offering stunning walks and historical significance. Ideal for guests interested in history and outdoor activities. | Hadrian's Wall Path, Housesteads Roman Fort, Vindolanda, Cawfields Quarry, Steel Rigg |
| Hexham | Nearby market town known for its beautiful architecture and vibrant market. Great for visitors looking for more amenities and cultural experiences. | Hexham Abbey, Hexham Old Gaol, Corbridge Roman Town, Market Square, Thornley Woods |
| Tyne Valley | Beautiful rural area offering scenic landscapes and outdoor activities, great for nature lovers and families. | Ebchester Roman Fort, Dintingdale, Tyne Riverside Country Park, Foxton Locks, Rowlands Gill |
| Brampton | Historic market town with access to nearby attractions and beautiful countryside, perfect for those seeking relaxation and nature. | Brampton Old Church, Talkin Tarn Country Park, Talkin Tarn, Huntington Castle, Wishaw Hall |
| Northumberland National Park | Stunning national park ideal for hiking, camping, and nature lovers. Appeals to adventure tourists and outdoor enthusiasts. | Cheviot Hills, Kielder Water, Hexham Race Course, Simonside Hills, Hadrian's Wall |
| Newcastle upon Tyne | Vibrant city with rich cultural scene, nightlife and history, appealing to young travelers and city explorers. | Newcastle Quayside, Tyne Bridge, Baltic Centre for Contemporary Art, Ouseburn Valley, St. Nicholas Cathedral |
| Durham City | Historic city known for its cathedral and beautiful riverside. A great option for tourists interested in history and culture. | Durham Cathedral, Durham Castle, Botanic Garden, River Wear, Durham Market Place |
Understanding Airbnb License Requirements & STR Laws in Corbridge (2026)
While Corbridge, England, United Kingdom currently shows low STR regulations, specific Airbnb license requirements might still exist or change. Always verify the latest short term rental regulations and Airbnb license requirements directly with local government authorities for Corbridge to ensure full compliance before hosting.
(Source: AirROI data, 2026, finding no licensed listings among those analyzed)
Top Performing Airbnb Properties in Corbridge (2026)
Benchmark your potential! Explore examples of top-performing Airbnb properties in Corbridgebased on Trailing Twelve Month (TTM) revenue. Analyze their characteristics, revenue, occupancy rate, and ADR to understand what drives success in this market.
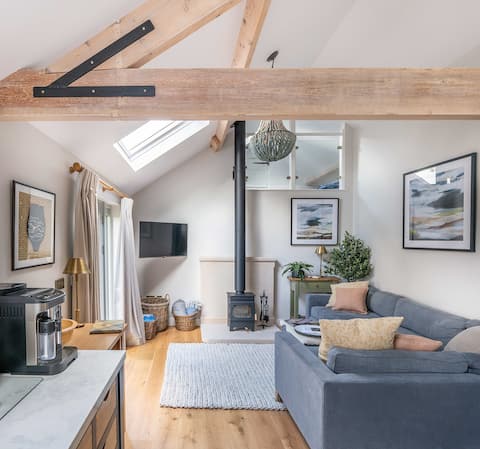
Peaceful and luxurious hideaway in Corbridge
Entire Place • 2 bedrooms
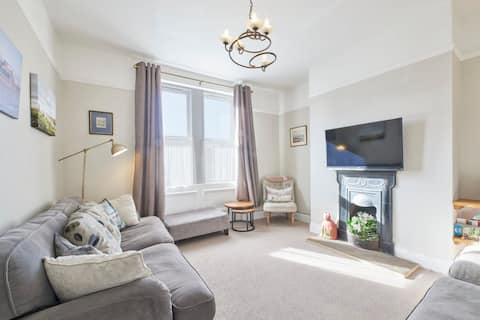
Host & Stay | The Cottage in Corbridge
Entire Place • 3 bedrooms

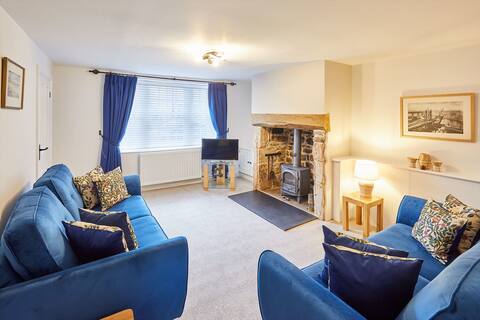
Cosy Cottage in Large Peaceful Gardens.
Entire Place • 4 bedrooms
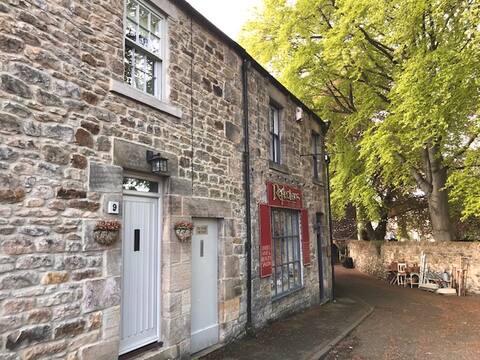
9 Hill St - a hideaway in the heart of Corbridge
Entire Place • 3 bedrooms

Stylish cottage with large garden & stunning view
Entire Place • 1 bedroom
Host & Stay | Kenmore
Entire Place • 2 bedrooms
Note: Performance varies based on location, size, amenities, seasonality, and management quality. Data reflects the past 12 months.
Top Performing Airbnb Hosts in Corbridge (2026)
Learn from the best! This table showcases top-performing Airbnb hosts in Corbridge based on the number of properties managed and estimated total revenue over the past year. Analyze their scale and performance metrics.
| Host Name | Properties | Grossing Revenue | Stay Reviews | Avg Rating |
|---|---|---|---|---|
| Host & Stay | 2 | $105,280 | 102 | 4.84/5.0 |
| Debbie | 2 | $83,992 | 270 | 4.96/5.0 |
| Sally | 1 | $69,270 | 44 | 5.00/5.0 |
| Vanessa | 1 | $56,737 | 136 | 4.99/5.0 |
| Lucy | 1 | $48,485 | 109 | 4.93/5.0 |
| Richard | 1 | $41,793 | 152 | 4.85/5.0 |
| Nicholas | 1 | $32,738 | 9 | 4.78/5.0 |
| Susan | 1 | $30,237 | 168 | 4.91/5.0 |
| Katie | 1 | $27,553 | 126 | 4.92/5.0 |
| Hugo | 1 | $27,021 | 175 | 4.98/5.0 |
Analyzing the strategies of top hosts, such as their property selection, pricing, and guest communication, can offer valuable lessons for optimizing your own Airbnb operations in Corbridge.
Dive Deeper: Advanced Corbridge STR Market Data (2026)
Ready to unlock more insights? AirROI provides access to advanced metrics and comprehensive Airbnb data for Corbridge. Explore detailed analytics beyond this report to refine your investment strategy, optimize pricing, and maximize your vacation rental profits.
Explore Advanced MetricsCorbridge Short-Term Rental Market Composition (2026): Property & Room Types
Room Type Distribution
Property Type Distribution
Market Composition Insights for Corbridge
- The Corbridge Airbnb market composition is heavily skewed towards Entire Home/Apt listings, which make up 80% of the 25 active rentals. This indicates strong guest preference for privacy and space.
- Looking at the property type distribution in Corbridge, House properties are the most common (64%), reflecting the local real estate landscape.
- Houses represent a significant 64% portion, catering likely to families or larger groups.
- The presence of 24% Hotel/Boutique listings indicates integration with traditional hospitality.
- Smaller segments like others (combined 4.0%) offer potential for unique stay experiences.
Corbridge Airbnb Room Capacity Analysis (2026): Bedroom Distribution
Distribution of Listings by Number of Bedrooms
Room Capacity Insights for Corbridge
- The dominant room capacity in Corbridge is 2 bedrooms listings, making up 36% of the market. This suggests a strong demand for properties suitable for couples or solo travelers.
- Together, 2 bedrooms and 1 bedroom properties represent 64.0% of the active Airbnb listings in Corbridge, indicating a high concentration in these sizes.
- A significant 28.0% of listings offer 3+ bedrooms, catering to larger groups and families seeking more space in Corbridge.
Corbridge Vacation Rental Guest Capacity Trends (2026)
Distribution of Listings by Guest Capacity
Guest Capacity Insights for Corbridge
- The most common guest capacity trend in Corbridge vacation rentals is listings accommodating 4 guests (28%). This suggests the primary traveler segment is likely small families or groups.
- Properties designed for 4 guests and 2 guests dominate the Corbridge STR market, accounting for 52.0% of listings.
- 12.0% of properties accommodate 6+ guests, serving the market segment for larger families or group travel in Corbridge.
- On average, properties in Corbridge are equipped to host 3.3 guests.
Corbridge Airbnb Booking Patterns (2026): Available vs. Booked Days
Available Days Distribution
Booked Days Distribution
Booking Pattern Insights for Corbridge
- The most common availability pattern in Corbridge falls within the 91-180 days range, representing 36% of listings. This suggests many properties have significant open periods on their calendars.
- Approximately 52.0% of listings show high availability (181+ days open annually), indicating potential for increased bookings or specific owner usage patterns.
- For booked days, the 181-270 days range is most frequent in Corbridge (36%), reflecting common guest stay durations or potential owner blocking patterns.
- A notable 48.0% of properties secure long booking periods (181+ days booked per year), highlighting successful long-term rental strategies or significant owner usage.
Corbridge Airbnb Minimum Stay Requirements Analysis
Distribution of Listings by Minimum Night Requirement
1 Night
4 listings
16% of total
2 Nights
8 listings
32% of total
3 Nights
3 listings
12% of total
4-6 Nights
2 listings
8% of total
7-29 Nights
1 listings
4% of total
30+ Nights
7 listings
28% of total
Key Insights
- The most prevalent minimum stay requirement in Corbridge is 2 Nights, adopted by 32% of listings. This highlights the market's preference for shorter, flexible bookings.
- A significant segment (28%) caters to monthly stays (30+ nights) in Corbridge, pointing to opportunities in the extended-stay market.
Recommendations
- Align with the market by considering a 2 Nights minimum stay, as 32% of Corbridge hosts use this setting.
- If feasible, allowing 1-night stays, especially midweek or during low season, could capture last-minute bookings, as only 16% currently do.
- A 2-night minimum appears standard (32%). Consider this for weekends or peak periods.
- Explore offering discounts for stays of 30+ nights to attract the 28% of the market seeking extended stays.
- Adjust minimum nights based on seasonality – potentially shorter during low season and longer during peak demand periods in Corbridge.
Corbridge Airbnb Cancellation Policy Trends Analysis (2026)
Super Strict 60 Days
2 listings
8% of total
Flexible
3 listings
12% of total
Moderate
6 listings
24% of total
Firm
12 listings
48% of total
Strict
2 listings
8% of total
Cancellation Policy Insights for Corbridge
- The prevailing Airbnb cancellation policy trend in Corbridge is Firm, used by 48% of listings.
- A majority (56.0%) of hosts in Corbridge utilize Firm or Strict policies, indicating a market where hosts prioritize booking security.
- Strict cancellation policies are quite rare (8%), potentially making listings with this policy less competitive unless justified by high demand or property type.
Recommendations for Hosts
- Consider adopting a Firm policy to align with the 48% market standard in Corbridge.
- Using a Strict policy might deter some guests, as only 8% of listings use it. Evaluate if potential revenue protection outweighs possible lower booking rates.
- Regularly review your cancellation policy against competitors and market demand shifts in Corbridge.
Corbridge STR Booking Lead Time Analysis (2026)
Average Booking Lead Time by Month
Booking Lead Time Insights for Corbridge
- The overall average booking lead time for vacation rentals in Corbridge is 68 days.
- Guests book furthest in advance for stays during September (average 102 days), likely coinciding with peak travel demand or local events.
- The shortest booking windows occur for stays in November (average 36 days), indicating more last-minute travel plans during this time.
- Seasonally, Summer (87 days avg.) sees the longest lead times, while Winter (51 days avg.) has the shortest, reflecting typical travel planning cycles.
Recommendations for Hosts
- Use the overall average lead time (68 days) as a baseline for your pricing and availability strategy in Corbridge.
- For September stays, consider implementing length-of-stay discounts or slightly higher rates for bookings made less than 102 days out to capitalize on advance planning.
- Target marketing efforts for the Summer season well in advance (at least 87 days) to capture early planners.
- Monitor your own booking lead times against these Corbridge averages to identify opportunities for dynamic pricing adjustments.
Popular & Essential Airbnb Amenities in Corbridge (2026)
Amenity Prevalence
Amenity Insights for Corbridge
- Essential amenities in Corbridge that guests expect include: Smoke alarm, Wifi, Heating. Lacking these (any) could significantly impact bookings.
- Popular amenities like Carbon monoxide alarm, Essentials, Hot water are common but not universal. Offering these can provide a competitive edge.
Recommendations for Hosts
- Ensure your listing includes all essential amenities for Corbridge: Smoke alarm, Wifi, Heating.
- Prioritize adding missing essentials: Heating.
- Consider adding popular differentiators like Carbon monoxide alarm or Essentials to increase appeal.
- Highlight unique or less common amenities you offer (e.g., hot tub, dedicated workspace, EV charger) in your listing description and photos.
- Regularly check competitor amenities in Corbridge to stay competitive.
Corbridge Airbnb Guest Demographics & Profile Analysis (2026)
Guest Profile Summary for Corbridge
- The typical guest profile for Airbnb in Corbridge consists of primarily domestic travelers (88%), often arriving from nearby England, typically belonging to the Post-2000s (Gen Z/Alpha) group (50%), primarily speaking English or French.
- Domestic travelers account for 88.3% of guests.
- Key international markets include United Kingdom (88.3%) and Australia (3.2%).
- Top languages spoken are English (66.7%) followed by French (11.9%).
- A significant demographic segment is the Post-2000s (Gen Z/Alpha) group, representing 50% of guests.
Recommendations for Hosts
- Target domestic marketing efforts towards travelers from England and London.
- Tailor amenities and listing descriptions to appeal to the dominant Post-2000s (Gen Z/Alpha) demographic (e.g., highlight fast WiFi, smart home features, local guides).
- Highlight unique local experiences or amenities relevant to the primary guest profile.
- Consider seasonal promotions aligned with peak travel times for key origin markets.
Nearby Short-Term Rental Market Comparison
How does the Corbridge Airbnb market stack up against its neighbors? Compare key performance metrics like average monthly revenue, ADR, and occupancy rates in surrounding areas to understand the broader regional STR landscape.
| Market | Active Properties | Monthly Revenue | Daily Rate | Avg. Occupancy |
|---|---|---|---|---|
| Dalkeith | 10 | $5,775 | $478.16 | 55% |
| Buttermere | 14 | $4,802 | $415.13 | 49% |
| Llanbedr Dyffryn Clwyd | 10 | $4,746 | $463.17 | 38% |
| City of Edinburgh | 4,083 | $4,617 | $289.88 | 60% |
| Cartmel Fell | 23 | $4,560 | $364.59 | 48% |
| Burneside | 10 | $4,526 | $331.60 | 54% |
| Grinton | 12 | $4,363 | $338.85 | 48% |
| Ellingham | 12 | $4,350 | $318.71 | 51% |
| Bowness-on-Windermere | 358 | $4,223 | $357.92 | 45% |
| Rowen | 26 | $4,220 | $376.11 | 46% |