Deritend Airbnb Market Analysis 2026: Short Term Rental Data & Vacation Rental Statistics in England, United Kingdom
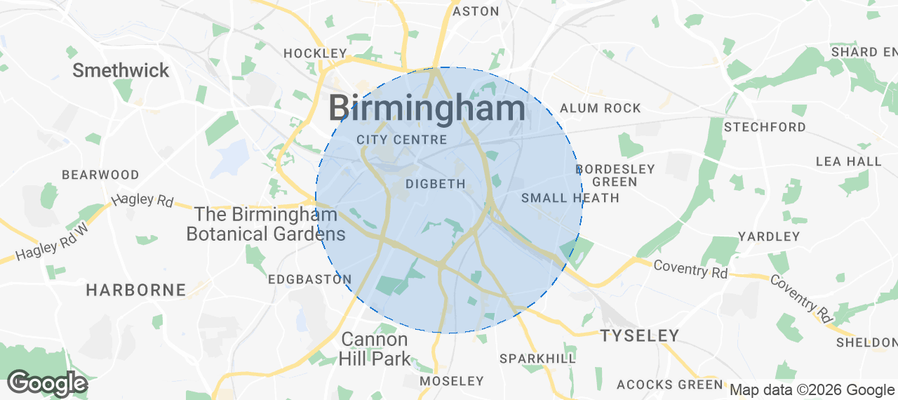
Is Airbnb profitable in Deritend in 2026? Explore comprehensive Airbnb analytics for Deritend, England, United Kingdom to uncover income potential. This 2026 STR market report for Deritend, based on AirROI data from February 2025 to January 2026, reveals key trends in the niche market of 25 active listings.
Whether you're considering an Airbnb investment in Deritend, optimizing your existing vacation rental, or exploring rental arbitrage opportunities, understanding the Deritend Airbnb data is crucial. Leveraging the low regulation environment is key to maximizing your short term rental income potential. Let's dive into the specifics.
Key Deritend Airbnb Performance Metrics Overview
Monthly Airbnb Revenue Variations & Income Potential in Deritend (2026)
Understanding the monthly revenue variations for Airbnb listings in Deritend is key to maximizing your short term rental income potential. Seasonality significantly impacts earnings. Our analysis, based on data from the past 12 months, shows that the peak revenue month for STRs in Deritend is typically June, while May often presents the lowest earnings, highlighting opportunities for strategic pricing adjustments during shoulder and low seasons. Explore the typical Airbnb income in Deritend across different performance tiers:
- Best-in-class properties (Top 10%) achieve $3,439+ monthly, often utilizing dynamic pricing and superior guest experiences.
- Strong performing properties (Top 25%) earn $2,472 or more, indicating effective management and desirable locations/amenities.
- Typical properties (Median) generate around $1,650 per month, representing the average market performance.
- Entry-level properties (Bottom 25%) see earnings around $957, often with potential for optimization.
Average Monthly Airbnb Earnings Trend in Deritend
Deritend Airbnb Occupancy Rate Trends (2026)
Maximize your bookings by understanding the Deritend STR occupancy trends. Seasonal demand shifts significantly influence how often properties are booked. Typically, Junesees the highest demand (peak season occupancy), while May experiences the lowest (low season). Effective strategies, like adjusting minimum stays or offering promotions, can boost occupancy during slower periods. Here's how different property tiers perform in Deritend:
- Best-in-class properties (Top 10%) achieve 68%+ occupancy, indicating high desirability and potentially optimized availability.
- Strong performing properties (Top 25%) maintain 57% or higher occupancy, suggesting good market fit and guest satisfaction.
- Typical properties (Median) have an occupancy rate around 39%.
- Entry-level properties (Bottom 25%) average 21% occupancy, potentially facing higher vacancy.
Average Monthly Occupancy Rate Trend in Deritend
Average Daily Rate (ADR) Airbnb Trends in Deritend (2026)
Effective short term rental pricing strategy in Deritend involves understanding monthly ADR fluctuations. The Average Daily Rate (ADR) for Airbnb in Deritend typically peaks in October and dips lowest during August. Leveraging Airbnb dynamic pricing tools or strategies based on this seasonality can significantly boost revenue. Here's a look at the typical nightly rates achieved:
- Best-in-class properties (Top 10%) command rates of $217+ per night, often due to premium features or locations.
- Strong performing properties (Top 25%) achieve nightly rates of $175 or more.
- Typical properties (Median) charge around $138 per night.
- Entry-level properties (Bottom 25%) earn around $108 per night.
Average Daily Rate (ADR) Trend by Month in Deritend
Get Live Deritend Market Intelligence 👇
Explore Real-time Analytics
Airbnb Seasonality Analysis & Trends in Deritend (2026)
Peak Season (June, December, October)
- Revenue averages $2,358 per month
- Occupancy rates average 47.5%
- Daily rates average $153
Shoulder Season
- Revenue averages $1,644 per month
- Occupancy maintains around 37.0%
- Daily rates hold near $144
Low Season (February, March, April)
- Revenue drops to average $0 per month
- Occupancy decreases to average 0.0%
- Daily rates adjust to average $142
Seasonality Insights for Deritend
- The Airbnb seasonality in Deritend shows highly seasonal trends requiring careful strategy. While the sections above show seasonal averages, it's also insightful to look at the extremes:
- During the high season, the absolute peak month showcases Deritend's highest earning potential, with monthly revenues capable of climbing to $2,524, occupancy reaching a high of 51.9%, and ADRs peaking at $158.
- Conversely, the slowest single month of the year, typically falling within the low season, marks the market's lowest point. In this month, revenue might dip to $0, occupancy could drop to 0.0%, and ADRs may adjust down to $131.
- Understanding both the seasonal averages and these monthly peaks and troughs in revenue, occupancy, and ADR is crucial for maximizing your Airbnb profit potential in Deritend.
Seasonal Strategies for Maximizing Profit
- Peak Season: Maximize revenue through premium pricing and potentially longer minimum stays. Ensure high availability.
- Low Season: Offer competitive pricing, special promotions (e.g., extended stay discounts), and flexible cancellation policies. Target off-season travelers like remote workers or budget-conscious guests.
- Shoulder Seasons: Implement dynamic pricing that balances peak and low rates. Target weekend travelers or specific events. Offer slightly more flexible terms than peak season.
- Regularly analyze your own performance against these Deritend seasonality benchmarks and adjust your pricing and availability strategy accordingly.
Best Areas for Airbnb Investment in Deritend (2026)
Exploring the top neighborhoods for short-term rentals in Deritend? This section highlights key areas, outlining why they are attractive for hosts and guests, along with notable local attractions. Consider these locations based on your target guest profile and investment strategy.
| Neighborhood / Area | Why Host Here? (Target Guests & Appeal) | Key Attractions & Landmarks |
|---|---|---|
| Birmingham City Centre | The bustling heart of Birmingham, featuring a wide range of attractions, restaurants, and shopping options. Ideal for tourists and business travelers alike. | Bullring Shopping Centre, Birmingham Museum and Art Gallery, Library of Birmingham, Odeon Birmingham, Birmingham Hippodrome |
| Custard Factory | A creative and cultural hub in Digbeth, known for its independent shops, art studios, and vibrant nightlife. Great for younger crowds seeking a unique experience. | The Custard Factory, Digbeth Dining Club, Street Art, The Rainbow Venues, The Old Crown |
| Jewellery Quarter | Famous for its historic jewelry shops and artisans, this area also offers a rich history and quaint cafes, making it appealing to tourists. | Birmingham Assay Office, Museum of the Jewellery Quarter, St. Paul's Church, Jewellery Quarter Birmingham, The Pen Museum |
| Edgbaston | A leafy suburb close to the city center, known for its beautiful parks and Victorian architecture. Popular with families and professionals. | Edgbaston Reservoir, Winterbourne House and Garden, Birmingham Botanical Gardens, Edgbaston Golf Club, Cannon Hill Park |
| Selly Oak | Home to many students and young professionals due to its proximity to the University of Birmingham. Offers affordable accommodations and lively atmosphere. | Selly Oak Park, University of Birmingham, Selly Oak shopping area, Bournbrook, The Green Man |
| Harborne | A charming suburb with a village feel, featuring independent shops, bars, and restaurants. Attractive for families and professionals looking for a community vibe. | Harborne High Street, Queens Park, The Light Cinema, BrewDog Harborne, The Hare and Hounds |
| Kings Heath | A vibrant area known for its community spirit and numerous parks. Hosts a range of events and is popular among families and young people. | Kings Heath Village Square, High Street shops, KIngs Heath Park, The Hippodrome, Kings Heath Farmers Market |
| Moseley | A hip neighborhood known for its arts scene, Music and independent cafes. Great for visitors looking for a bohemian atmosphere. | Moseley Park, The Moseley Exchange, Moseley Village, Kingsmeadow Park, The Dark Horse |
Understanding Airbnb License Requirements & STR Laws in Deritend (2026)
While Deritend, England, United Kingdom currently shows low STR regulations, specific Airbnb license requirements might still exist or change. Always verify the latest short term rental regulations and Airbnb license requirements directly with local government authorities for Deritend to ensure full compliance before hosting.
(Source: AirROI data, 2026, finding no licensed listings among those analyzed)
Top Performing Airbnb Properties in Deritend (2026)
Benchmark your potential! Explore examples of top-performing Airbnb properties in Deritendbased on Trailing Twelve Month (TTM) revenue. Analyze their characteristics, revenue, occupancy rate, and ADR to understand what drives success in this market.
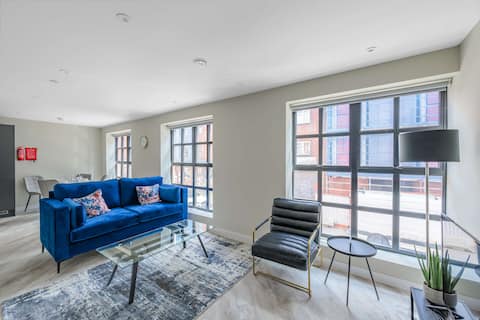
Central Birmingham Beautiful 2 Bedroom Apartment
Entire Place • 2 bedrooms
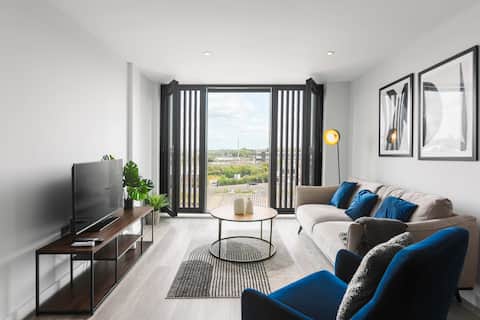
Modern Central Birmingham 2 Bed Apartment
Entire Place • 2 bedrooms
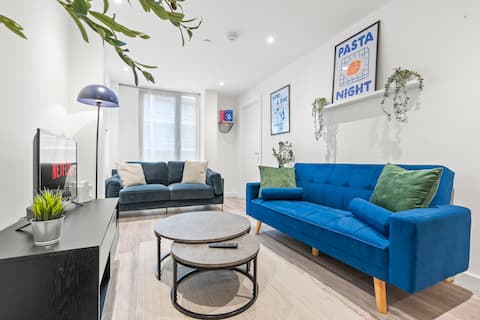
#20 2 Bed 2 Bath Balcony Lux Digbeth Apt
Entire Place • 2 bedrooms
#31 Lux Apex Loft – 2 Bed, 2 Bath & Rooftop Views
Entire Place • 2 bedrooms
#21 2 Bedr 2 Bath Balcony Lux Digbeth Apex Lofts
Entire Place • 2 bedrooms
Meadow Bliss 2 BED 2 BATH+ Netflix +OnStreet Park
Entire Place • 2 bedrooms
Note: Performance varies based on location, size, amenities, seasonality, and management quality. Data reflects the past 12 months.
Top Performing Airbnb Hosts in Deritend (2026)
Learn from the best! This table showcases top-performing Airbnb hosts in Deritend based on the number of properties managed and estimated total revenue over the past year. Analyze their scale and performance metrics.
| Host Name | Properties | Grossing Revenue | Stay Reviews | Avg Rating |
|---|---|---|---|---|
| Sophie | 5 | $85,663 | 80 | 4.86/5.0 |
| My Property Host | 3 | $65,867 | 42 | 4.38/5.0 |
| My Property Host | 4 | $27,949 | 13 | 3.65/5.0 |
| My Property Host | 4 | $25,640 | 18 | 3.83/5.0 |
| Eiréine | 2 | $21,956 | 42 | 4.64/5.0 |
| Lynn | 1 | $10,336 | 22 | 4.64/5.0 |
| Nicola | 1 | $8,652 | 7 | 4.86/5.0 |
| Graham | 1 | $6,562 | 4 | 3.00/5.0 |
| Toy | 1 | $5,470 | 11 | 4.00/5.0 |
| RPP Management | 1 | $5,371 | 2 | Not Rated |
Analyzing the strategies of top hosts, such as their property selection, pricing, and guest communication, can offer valuable lessons for optimizing your own Airbnb operations in Deritend.
Dive Deeper: Advanced Deritend STR Market Data (2026)
Ready to unlock more insights? AirROI provides access to advanced metrics and comprehensive Airbnb data for Deritend. Explore detailed analytics beyond this report to refine your investment strategy, optimize pricing, and maximize your vacation rental profits.
Explore Advanced MetricsDeritend Short-Term Rental Market Composition (2026): Property & Room Types
Room Type Distribution
Property Type Distribution
Market Composition Insights for Deritend
- The Deritend Airbnb market composition is heavily skewed towards Entire Home/Apt listings, which make up 100% of the 25 active rentals. This indicates strong guest preference for privacy and space.
- Looking at the property type distribution in Deritend, Apartment/Condo properties are the most common (100%), reflecting the local real estate landscape.
Deritend Airbnb Room Capacity Analysis (2026): Bedroom Distribution
Distribution of Listings by Number of Bedrooms
Room Capacity Insights for Deritend
- The dominant room capacity in Deritend is 2 bedrooms listings, making up 56% of the market. This suggests a strong demand for properties suitable for couples or solo travelers.
- Together, 2 bedrooms and 1 bedroom properties represent 100.0% of the active Airbnb listings in Deritend, indicating a high concentration in these sizes.
Deritend Vacation Rental Guest Capacity Trends (2026)
Distribution of Listings by Guest Capacity
Guest Capacity Insights for Deritend
- The most common guest capacity trend in Deritend vacation rentals is listings accommodating 2 guests (28%). This suggests the primary traveler segment is likely couples or solo travelers.
- Properties designed for 2 guests and 4 guests dominate the Deritend STR market, accounting for 52.0% of listings.
- 32.0% of properties accommodate 6+ guests, serving the market segment for larger families or group travel in Deritend.
- On average, properties in Deritend are equipped to host 4.2 guests.
Deritend Airbnb Booking Patterns (2026): Available vs. Booked Days
Available Days Distribution
Booked Days Distribution
Booking Pattern Insights for Deritend
- The most common availability pattern in Deritend falls within the 271-366 days range, representing 64% of listings. This suggests many properties have significant open periods on their calendars.
- Approximately 100.0% of listings show high availability (181+ days open annually), indicating potential for increased bookings or specific owner usage patterns.
- For booked days, the 31-90 days range is most frequent in Deritend (44%), reflecting common guest stay durations or potential owner blocking patterns.
Deritend Airbnb Minimum Stay Requirements Analysis
Distribution of Listings by Minimum Night Requirement
1 Night
2 listings
8% of total
2 Nights
4 listings
16% of total
4-6 Nights
9 listings
36% of total
7-29 Nights
3 listings
12% of total
30+ Nights
7 listings
28% of total
Key Insights
- The most prevalent minimum stay requirement in Deritend is 4-6 Nights, adopted by 36% of listings. This highlights the market's preference for longer commitments.
- A significant segment (28%) caters to monthly stays (30+ nights) in Deritend, pointing to opportunities in the extended-stay market.
Recommendations
- Align with the market by considering a 4-6 Nights minimum stay, as 36% of Deritend hosts use this setting.
- If feasible, allowing 1-night stays, especially midweek or during low season, could capture last-minute bookings, as only 8% currently do.
- Explore offering discounts for stays of 30+ nights to attract the 28% of the market seeking extended stays.
- Adjust minimum nights based on seasonality – potentially shorter during low season and longer during peak demand periods in Deritend.
Deritend Airbnb Cancellation Policy Trends Analysis (2026)
Limited
1 listings
4% of total
Flexible
8 listings
32% of total
Moderate
16 listings
64% of total
Cancellation Policy Insights for Deritend
- The prevailing Airbnb cancellation policy trend in Deritend is Moderate, used by 64% of listings.
- The market strongly favors guest-friendly terms, with 96.0% of listings offering Flexible or Moderate policies. This suggests guests in Deritend may expect booking flexibility.
Recommendations for Hosts
- Consider adopting a Moderate policy to align with the 64% market standard in Deritend.
- Regularly review your cancellation policy against competitors and market demand shifts in Deritend.
Deritend STR Booking Lead Time Analysis (2026)
Average Booking Lead Time by Month
Booking Lead Time Insights for Deritend
- The overall average booking lead time for vacation rentals in Deritend is 14 days.
- Guests book furthest in advance for stays during October (average 26 days), likely coinciding with peak travel demand or local events.
- The shortest booking windows occur for stays in April (average 0 days), indicating more last-minute travel plans during this time.
- Seasonally, Fall (21 days avg.) sees the longest lead times, while Spring (1 days avg.) has the shortest, reflecting typical travel planning cycles.
Recommendations for Hosts
- Use the overall average lead time (14 days) as a baseline for your pricing and availability strategy in Deritend.
- For October stays, consider implementing length-of-stay discounts or slightly higher rates for bookings made less than 26 days out to capitalize on advance planning.
- During April, focus on last-minute booking availability and promotions, as guests book with very short notice (0 days avg.).
- Target marketing efforts for the Fall season well in advance (at least 21 days) to capture early planners.
- Monitor your own booking lead times against these Deritend averages to identify opportunities for dynamic pricing adjustments.
Popular & Essential Airbnb Amenities in Deritend (2026)
Amenity Prevalence
No amenities with partial availability (less than 100%) were found to display in the chart. All essential amenities might be present in all listings. Check insights below.
Amenity Insights for Deritend
- Essential amenities in Deritend that guests expect include: Smoke alarm, Washer, Wifi, Microwave, Oven, Hot water kettle, Toaster, Refrigerator, Heating, Hot water. Lacking these (any) could significantly impact bookings.
Recommendations for Hosts
- Ensure your listing includes all essential amenities for Deritend: Smoke alarm, Washer, Wifi, Microwave, Oven, Hot water kettle, Toaster, Refrigerator, Heating, Hot water.
- Highlight unique or less common amenities you offer (e.g., hot tub, dedicated workspace, EV charger) in your listing description and photos.
- Regularly check competitor amenities in Deritend to stay competitive.
Deritend Airbnb Guest Demographics & Profile Analysis (2026)
Guest Profile Summary for Deritend
- The typical guest profile for Airbnb in Deritend consists of primarily domestic travelers (70%), often arriving from nearby London, typically belonging to the Post-2000s (Gen Z/Alpha) group (50%), primarily speaking English or Spanish.
- Domestic travelers account for 69.6% of guests.
- Key international markets include United Kingdom (69.6%) and France (6.5%).
- Top languages spoken are English (54.5%) followed by Spanish (9.1%).
- A significant demographic segment is the Post-2000s (Gen Z/Alpha) group, representing 50% of guests.
Recommendations for Hosts
- Target domestic marketing efforts towards travelers from London and England.
- Tailor amenities and listing descriptions to appeal to the dominant Post-2000s (Gen Z/Alpha) demographic (e.g., highlight fast WiFi, smart home features, local guides).
- Highlight unique local experiences or amenities relevant to the primary guest profile.
- Consider seasonal promotions aligned with peak travel times for key origin markets.
Nearby Short-Term Rental Market Comparison
How does the Deritend Airbnb market stack up against its neighbors? Compare key performance metrics like average monthly revenue, ADR, and occupancy rates in surrounding areas to understand the broader regional STR landscape.
| Market | Active Properties | Monthly Revenue | Daily Rate | Avg. Occupancy |
|---|---|---|---|---|
| Dorney | 11 | $7,510 | $743.63 | 39% |
| Chew Magna | 13 | $7,041 | $430.65 | 44% |
| Englishcombe | 15 | $6,734 | $511.35 | 53% |
| Lambourn | 11 | $6,499 | $723.41 | 31% |
| East Knoyle | 10 | $6,300 | $407.06 | 44% |
| Wraysbury | 16 | $6,199 | $530.56 | 49% |
| City of Westminster | 1,424 | $6,053 | $515.72 | 50% |
| Long Sutton | 18 | $6,029 | $383.58 | 46% |
| Withington | 10 | $5,690 | $499.79 | 44% |
| Ashley | 13 | $5,497 | $364.68 | 54% |