Dorset Airbnb Market Analysis 2026: Short Term Rental Data & Vacation Rental Statistics in England, United Kingdom
Is Airbnb profitable in Dorset in 2026? Explore comprehensive Airbnb analytics for Dorset, England, United Kingdom to uncover income potential. This 2026 STR market report for Dorset, based on AirROI data from February 2025 to January 2026, reveals key trends in the niche market of 152 active listings.
Whether you're considering an Airbnb investment in Dorset, optimizing your existing vacation rental, or exploring rental arbitrage opportunities, understanding the Dorset Airbnb data is crucial. Leveraging the low regulation environment is key to maximizing your short term rental income potential. Let's dive into the specifics.
Key Dorset Airbnb Performance Metrics Overview
Monthly Airbnb Revenue Variations & Income Potential in Dorset (2026)
Understanding the monthly revenue variations for Airbnb listings in Dorset is key to maximizing your short term rental income potential. Seasonality significantly impacts earnings. Our analysis, based on data from the past 12 months, shows that the peak revenue month for STRs in Dorset is typically August, while January often presents the lowest earnings, highlighting opportunities for strategic pricing adjustments during shoulder and low seasons. Explore the typical Airbnb income in Dorset across different performance tiers:
- Best-in-class properties (Top 10%) achieve $7,897+ monthly, often utilizing dynamic pricing and superior guest experiences.
- Strong performing properties (Top 25%) earn $4,373 or more, indicating effective management and desirable locations/amenities.
- Typical properties (Median) generate around $2,406 per month, representing the average market performance.
- Entry-level properties (Bottom 25%) see earnings around $1,169, often with potential for optimization.
Average Monthly Airbnb Earnings Trend in Dorset
Dorset Airbnb Occupancy Rate Trends (2026)
Maximize your bookings by understanding the Dorset STR occupancy trends. Seasonal demand shifts significantly influence how often properties are booked. Typically, Augustsees the highest demand (peak season occupancy), while January experiences the lowest (low season). Effective strategies, like adjusting minimum stays or offering promotions, can boost occupancy during slower periods. Here's how different property tiers perform in Dorset:
- Best-in-class properties (Top 10%) achieve 73%+ occupancy, indicating high desirability and potentially optimized availability.
- Strong performing properties (Top 25%) maintain 57% or higher occupancy, suggesting good market fit and guest satisfaction.
- Typical properties (Median) have an occupancy rate around 36%.
- Entry-level properties (Bottom 25%) average 18% occupancy, potentially facing higher vacancy.
Average Monthly Occupancy Rate Trend in Dorset
Average Daily Rate (ADR) Airbnb Trends in Dorset (2026)
Effective short term rental pricing strategy in Dorset involves understanding monthly ADR fluctuations. The Average Daily Rate (ADR) for Airbnb in Dorset typically peaks in August and dips lowest during January. Leveraging Airbnb dynamic pricing tools or strategies based on this seasonality can significantly boost revenue. Here's a look at the typical nightly rates achieved:
- Best-in-class properties (Top 10%) command rates of $644+ per night, often due to premium features or locations.
- Strong performing properties (Top 25%) achieve nightly rates of $333 or more.
- Typical properties (Median) charge around $209 per night.
- Entry-level properties (Bottom 25%) earn around $143 per night.
Average Daily Rate (ADR) Trend by Month in Dorset
Get Live Dorset Market Intelligence 👇

Explore Real-time Analytics
Airbnb Seasonality Analysis & Trends in Dorset (2026)
Peak Season (August, July, June)
- Revenue averages $4,914 per month
- Occupancy rates average 53.2%
- Daily rates average $327
Shoulder Season
- Revenue averages $3,465 per month
- Occupancy maintains around 38.5%
- Daily rates hold near $294
Low Season (January, May, December)
- Revenue drops to average $2,153 per month
- Occupancy decreases to average 26.7%
- Daily rates adjust to average $274
Seasonality Insights for Dorset
- The Airbnb seasonality in Dorset shows highly seasonal trends requiring careful strategy. While the sections above show seasonal averages, it's also insightful to look at the extremes:
- During the high season, the absolute peak month showcases Dorset's highest earning potential, with monthly revenues capable of climbing to $5,905, occupancy reaching a high of 62.6%, and ADRs peaking at $330.
- Conversely, the slowest single month of the year, typically falling within the low season, marks the market's lowest point. In this month, revenue might dip to $1,740, occupancy could drop to 22.2%, and ADRs may adjust down to $248.
- Understanding both the seasonal averages and these monthly peaks and troughs in revenue, occupancy, and ADR is crucial for maximizing your Airbnb profit potential in Dorset.
Seasonal Strategies for Maximizing Profit
- Peak Season: Maximize revenue through premium pricing and potentially longer minimum stays. Ensure high availability.
- Low Season: Offer competitive pricing, special promotions (e.g., extended stay discounts), and flexible cancellation policies. Target off-season travelers like remote workers or budget-conscious guests.
- Shoulder Seasons: Implement dynamic pricing that balances peak and low rates. Target weekend travelers or specific events. Offer slightly more flexible terms than peak season.
- Regularly analyze your own performance against these Dorset seasonality benchmarks and adjust your pricing and availability strategy accordingly.
Best Areas for Airbnb Investment in Dorset (2026)
Exploring the top neighborhoods for short-term rentals in Dorset? This section highlights key areas, outlining why they are attractive for hosts and guests, along with notable local attractions. Consider these locations based on your target guest profile and investment strategy.
| Neighborhood / Area | Why Host Here? (Target Guests & Appeal) | Key Attractions & Landmarks |
|---|---|---|
| Bournemouth | A popular coastal resort known for its beautiful sandy beaches, vibrant nightlife, and variety of attractions. Ideal for tourists looking for a seaside getaway and cultural experiences. | Bournemouth Pier, Hengistbury Head, Bournemouth Gardens, Russell-Cotes Art Gallery & Museum, Oceanarium |
| Dorset Coast | Famous for its stunning natural scenery and fossil-rich cliffs, the Jurassic Coast is a World Heritage site that attracts nature lovers and families. Great for outdoor activities and scenic stays. | Durdle Door, Lulworth Cove, Weymouth Beach, Charmouth Beach, Lyme Regis |
| Swanage | A picturesque seaside town known for its charming Victorian architecture and proximity to the Jurassic Coast. A favorite for families and those looking for a relaxed beach holiday. | Swanage Pier, Durlston Country Park, Swanage Railway, Corfe Castle, Old Harry Rocks |
| Dorchester | The county town of Dorset, rich in history and culture. Provides a great base for exploring the surrounding countryside and attractions. | The Dinosaur Museum, Max Gate, Maumbury Rings, County Museum, Dorset County Museum |
| Christchurch | Known for its historic buildings and beautiful riverside setting. Offers a mix of history and leisure with access to the New Forest. | Christchurch Priory, Avon Beach, Christchurch Quay, Somerset Court, Normandy Landing Beaches |
| Lyme Regis | A charming coastal town famous for its beaches and fossil-hunting opportunities. Perfect for families and history enthusiasts. | Lyme Regis Fossil Beach, Lyme Regis Museum, The Cobb, Lyme Regis Marine Aquarium, Charmouth Heritage Coast Centre |
| Sherborne | A historic market town known for its beautiful abbey and range of independent shops. Ideal for those looking for a quaint and quieter stay. | Sherborne Abbey, Sherborne Castle, Haynes International Motor Museum, Gardens of Sherborne, Dorset Historic Towns |
| Weymouth | A popular beach resort with a long sandy beach and a busy harbor. Known for family-friendly attractions and water sports. | Weymouth Beach, Nothe Fort, Sea Life Adventure Park, Weymouth Harbour, Chesil Beach |
Understanding Airbnb License Requirements & STR Laws in Dorset (2026)
While Dorset, England, United Kingdom currently shows low STR regulations, specific Airbnb license requirements might still exist or change. Always verify the latest short term rental regulations and Airbnb license requirements directly with local government authorities for Dorset to ensure full compliance before hosting.
(Source: AirROI data, 2026, finding no licensed listings among those analyzed)
Top Performing Airbnb Properties in Dorset (2026)
Benchmark your potential! Explore examples of top-performing Airbnb properties in Dorsetbased on Trailing Twelve Month (TTM) revenue. Analyze their characteristics, revenue, occupancy rate, and ADR to understand what drives success in this market.

Weywood House
Entire Place • 5 bedrooms
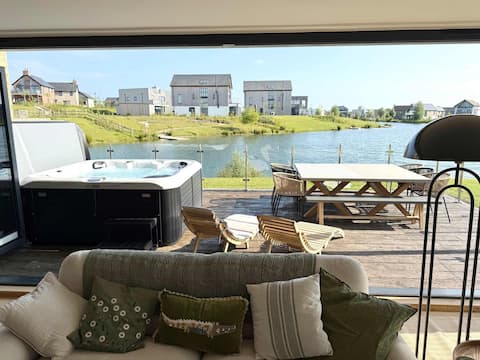
Luxury Lakeside Retreat with Hot Tub- sleeps 12-14
Entire Place • 5 bedrooms
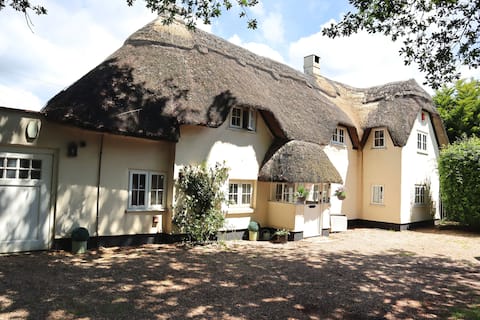
Large 5 Bedroom Thatched Cottage - Great Location!
Entire Place • 5 bedrooms
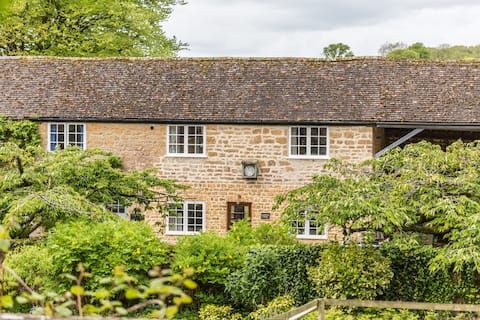
Beautiful Lambrook Cottage
Entire Place • 4 bedrooms
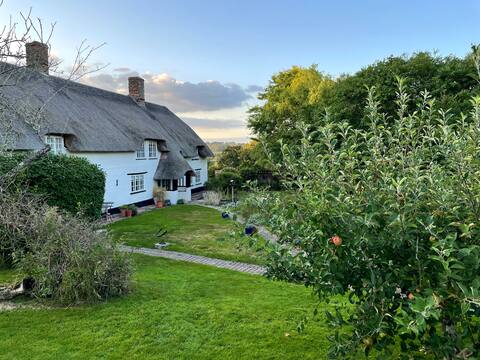
Stunning 17th c. listed cottage
Entire Place • 4 bedrooms

Reinventing the farm.
Entire Place • 5 bedrooms
Note: Performance varies based on location, size, amenities, seasonality, and management quality. Data reflects the past 12 months.
Top Performing Airbnb Hosts in Dorset (2026)
Learn from the best! This table showcases top-performing Airbnb hosts in Dorset based on the number of properties managed and estimated total revenue over the past year. Analyze their scale and performance metrics.
| Host Name | Properties | Grossing Revenue | Stay Reviews | Avg Rating |
|---|---|---|---|---|
| Emma | 5 | $296,146 | 1056 | 4.91/5.0 |
| Cottages | 7 | $280,848 | 21 | 3.73/5.0 |
| Wyke Dorset Cottages | 4 | $275,151 | 8 | 4.80/5.0 |
| Matthew | 3 | $182,831 | 280 | 4.94/5.0 |
| Sarah | 6 | $138,938 | 141 | 4.79/5.0 |
| Natalie | 5 | $137,142 | 261 | 4.88/5.0 |
| Jon | 1 | $132,313 | 21 | 4.86/5.0 |
| Miranda | 1 | $126,816 | 16 | 4.94/5.0 |
| Joe | 1 | $110,782 | 138 | 4.46/5.0 |
| Mohan | 1 | $109,730 | 45 | 4.89/5.0 |
Analyzing the strategies of top hosts, such as their property selection, pricing, and guest communication, can offer valuable lessons for optimizing your own Airbnb operations in Dorset.
Dive Deeper: Advanced Dorset STR Market Data (2026)
Ready to unlock more insights? AirROI provides access to advanced metrics and comprehensive Airbnb data for Dorset. Explore detailed analytics beyond this report to refine your investment strategy, optimize pricing, and maximize your vacation rental profits.
Explore Advanced MetricsDorset Short-Term Rental Market Composition (2026): Property & Room Types
Room Type Distribution
Property Type Distribution
Market Composition Insights for Dorset
- The Dorset Airbnb market composition is heavily skewed towards Entire Home/Apt listings, which make up 90.8% of the 152 active rentals. This indicates strong guest preference for privacy and space.
- Looking at the property type distribution in Dorset, House properties are the most common (65.8%), reflecting the local real estate landscape.
- Houses represent a significant 65.8% portion, catering likely to families or larger groups.
- Smaller segments like unique stays, hotel/boutique, others (combined 5.9%) offer potential for unique stay experiences.
Dorset Airbnb Room Capacity Analysis (2026): Bedroom Distribution
Distribution of Listings by Number of Bedrooms
Room Capacity Insights for Dorset
- The dominant room capacity in Dorset is 2 bedrooms listings, making up 32.2% of the market. This suggests a strong demand for properties suitable for couples or solo travelers.
- Together, 2 bedrooms and 1 bedroom properties represent 57.9% of the active Airbnb listings in Dorset, indicating a high concentration in these sizes.
- A significant 34.2% of listings offer 3+ bedrooms, catering to larger groups and families seeking more space in Dorset.
Dorset Vacation Rental Guest Capacity Trends (2026)
Distribution of Listings by Guest Capacity
Guest Capacity Insights for Dorset
- The most common guest capacity trend in Dorset vacation rentals is listings accommodating 4 guests (29.6%). This suggests the primary traveler segment is likely small families or groups.
- Properties designed for 4 guests and 8+ guests dominate the Dorset STR market, accounting for 45.4% of listings.
- 34.2% of properties accommodate 6+ guests, serving the market segment for larger families or group travel in Dorset.
- On average, properties in Dorset are equipped to host 4.4 guests.
Dorset Airbnb Booking Patterns (2026): Available vs. Booked Days
Available Days Distribution
Booked Days Distribution
Booking Pattern Insights for Dorset
- The most common availability pattern in Dorset falls within the 271-366 days range, representing 61.8% of listings. This suggests many properties have significant open periods on their calendars.
- Approximately 92.1% of listings show high availability (181+ days open annually), indicating potential for increased bookings or specific owner usage patterns.
- For booked days, the 31-90 days range is most frequent in Dorset (39.5%), reflecting common guest stay durations or potential owner blocking patterns.
- A notable 7.9% of properties secure long booking periods (181+ days booked per year), highlighting successful long-term rental strategies or significant owner usage.
Dorset Airbnb Minimum Stay Requirements Analysis
Distribution of Listings by Minimum Night Requirement
1 Night
28 listings
18.4% of total
2 Nights
46 listings
30.3% of total
3 Nights
11 listings
7.2% of total
4-6 Nights
1 listings
0.7% of total
7-29 Nights
1 listings
0.7% of total
30+ Nights
65 listings
42.8% of total
Key Insights
- The most prevalent minimum stay requirement in Dorset is 30+ Nights, adopted by 42.8% of listings. This highlights the market's preference for longer commitments.
- A significant segment (42.8%) caters to monthly stays (30+ nights) in Dorset, pointing to opportunities in the extended-stay market.
Recommendations
- Align with the market by considering a 30+ Nights minimum stay, as 42.8% of Dorset hosts use this setting.
- If feasible, allowing 1-night stays, especially midweek or during low season, could capture last-minute bookings, as only 18.4% currently do.
- A 2-night minimum appears standard (30.3%). Consider this for weekends or peak periods.
- Explore offering discounts for stays of 30+ nights to attract the 42.8% of the market seeking extended stays.
- Adjust minimum nights based on seasonality – potentially shorter during low season and longer during peak demand periods in Dorset.
Dorset Airbnb Cancellation Policy Trends Analysis (2026)
Super Strict 30 Days
3 listings
2% of total
Limited
2 listings
1.3% of total
Super Strict 60 Days
28 listings
18.4% of total
Flexible
29 listings
19.1% of total
Moderate
39 listings
25.7% of total
Firm
43 listings
28.3% of total
Strict
8 listings
5.3% of total
Cancellation Policy Insights for Dorset
- The prevailing Airbnb cancellation policy trend in Dorset is Firm, used by 28.3% of listings.
- There's a relatively balanced mix between guest-friendly (44.8%) and stricter (33.6%) policies, offering choices for different guest needs.
- Strict cancellation policies are quite rare (5.3%), potentially making listings with this policy less competitive unless justified by high demand or property type.
Recommendations for Hosts
- Consider adopting a Firm policy to align with the 28.3% market standard in Dorset.
- Using a Strict policy might deter some guests, as only 5.3% of listings use it. Evaluate if potential revenue protection outweighs possible lower booking rates.
- Regularly review your cancellation policy against competitors and market demand shifts in Dorset.
Dorset STR Booking Lead Time Analysis (2026)
Average Booking Lead Time by Month
Booking Lead Time Insights for Dorset
- The overall average booking lead time for vacation rentals in Dorset is 37 days.
- Guests book furthest in advance for stays during March (average 52 days), likely coinciding with peak travel demand or local events.
- The shortest booking windows occur for stays in May (average 26 days), indicating more last-minute travel plans during this time.
- Seasonally, Spring (41 days avg.) sees the longest lead times, while Winter (33 days avg.) has the shortest, reflecting typical travel planning cycles.
Recommendations for Hosts
- Use the overall average lead time (37 days) as a baseline for your pricing and availability strategy in Dorset.
- For March stays, consider implementing length-of-stay discounts or slightly higher rates for bookings made less than 52 days out to capitalize on advance planning.
- Target marketing efforts for the Spring season well in advance (at least 41 days) to capture early planners.
- Monitor your own booking lead times against these Dorset averages to identify opportunities for dynamic pricing adjustments.
Popular & Essential Airbnb Amenities in Dorset (2026)
Amenity Prevalence
Amenity Insights for Dorset
- Essential amenities in Dorset that guests expect include: Smoke alarm. Lacking these (this) could significantly impact bookings.
- Popular amenities like Heating, Wifi, Kitchen are common but not universal. Offering these can provide a competitive edge.
- Warning: Wifi is not universally provided but is considered essential globally. Ensure reliable Wifi is offered.
Recommendations for Hosts
- Ensure your listing includes all essential amenities for Dorset: Smoke alarm.
- Prioritize adding missing essentials: Smoke alarm.
- Consider adding popular differentiators like Heating or Wifi to increase appeal.
- Highlight unique or less common amenities you offer (e.g., hot tub, dedicated workspace, EV charger) in your listing description and photos.
- Regularly check competitor amenities in Dorset to stay competitive.
Dorset Airbnb Guest Demographics & Profile Analysis (2026)
Guest Profile Summary for Dorset
- The typical guest profile for Airbnb in Dorset consists of primarily domestic travelers (92%), often arriving from nearby England, typically belonging to the Post-2000s (Gen Z/Alpha) group (50%), primarily speaking English or French.
- Domestic travelers account for 92.2% of guests.
- Key international markets include United Kingdom (92.2%) and United States (1.8%).
- Top languages spoken are English (62.1%) followed by French (9.2%).
- A significant demographic segment is the Post-2000s (Gen Z/Alpha) group, representing 50% of guests.
Recommendations for Hosts
- Target domestic marketing efforts towards travelers from England and London.
- Tailor amenities and listing descriptions to appeal to the dominant Post-2000s (Gen Z/Alpha) demographic (e.g., highlight fast WiFi, smart home features, local guides).
- Highlight unique local experiences or amenities relevant to the primary guest profile.
- Consider seasonal promotions aligned with peak travel times for key origin markets.
Nearby Short-Term Rental Market Comparison
How does the Dorset Airbnb market stack up against its neighbors? Compare key performance metrics like average monthly revenue, ADR, and occupancy rates in surrounding areas to understand the broader regional STR landscape.
| Market | Active Properties | Monthly Revenue | Daily Rate | Avg. Occupancy |
|---|---|---|---|---|
| Chew Magna | 13 | $7,041 | $430.65 | 44% |
| Englishcombe | 15 | $6,734 | $511.35 | 53% |
| Lambourn | 11 | $6,499 | $723.41 | 31% |
| East Knoyle | 10 | $6,300 | $407.06 | 44% |
| Long Sutton | 18 | $6,029 | $383.58 | 46% |
| Ashley | 13 | $5,497 | $364.68 | 54% |
| Freshford | 12 | $5,333 | $317.81 | 58% |
| Grosmont | 11 | $5,211 | $459.67 | 55% |
| Milverton | 10 | $5,067 | $377.17 | 48% |
| Southerndown | 16 | $5,064 | $409.45 | 46% |